I have selected very small ROI, nothing changed! Perhaps I am missing a step…
Thanks
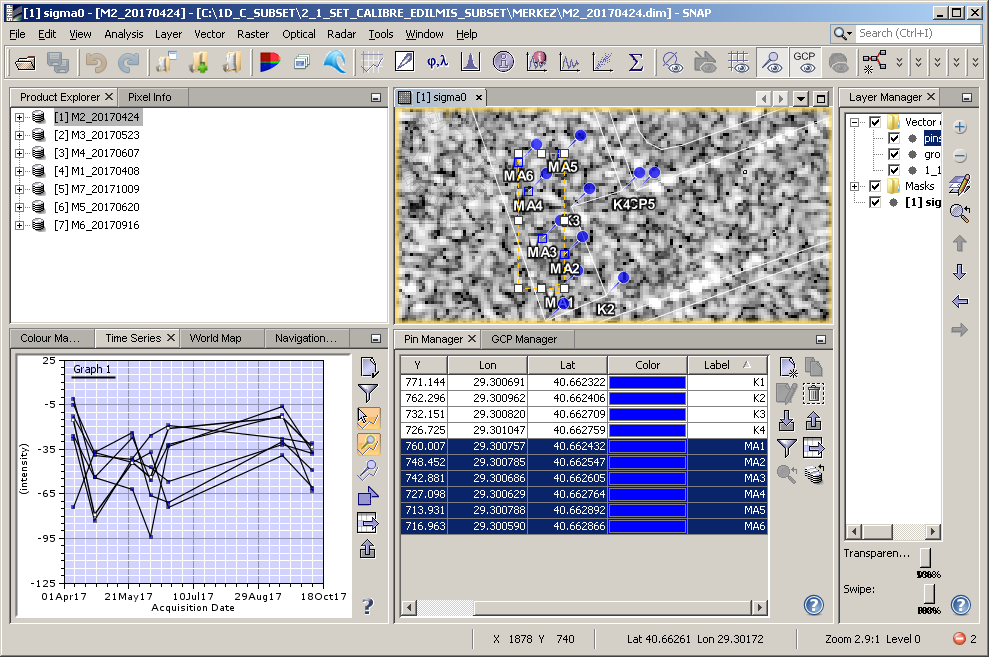
Dear Braun, there is a picture from time series analysis tool. In picture, in bands section, there are Sigma0 VV band beginning from 14 Oct. But in graph, there is a line beginning from May.
Can you explain time series analysis tool with stacked bands?
the labels start with may but the points are placed at October.
Simply add your bands in the settings and move your mouse over a raster.
Sorry Braun, i can not achieve this in stacked band images… Simply, can you write this procedure step by step please?
- add the bands to the tool
- move your mouse over the image
sorry, I don’t understand where you struggle. Please provide more information about your problem.
I can view time series graph with different date images.
In your example, there is a stacked images of Dubai. There is one image with stacked bands. How did you do it?
you can stack the basds with
Radar > Coregistration > Stack Tools > Stack (if they are already ortho-corrected)
or
Radar > Coregistration > Coregistration (if they are not yet ortho-corrected)
However, some people experienced issues with a stack as an input so if adding multiple images works for you, it is fine!
Dear Braun, i have a images with stacked bands.
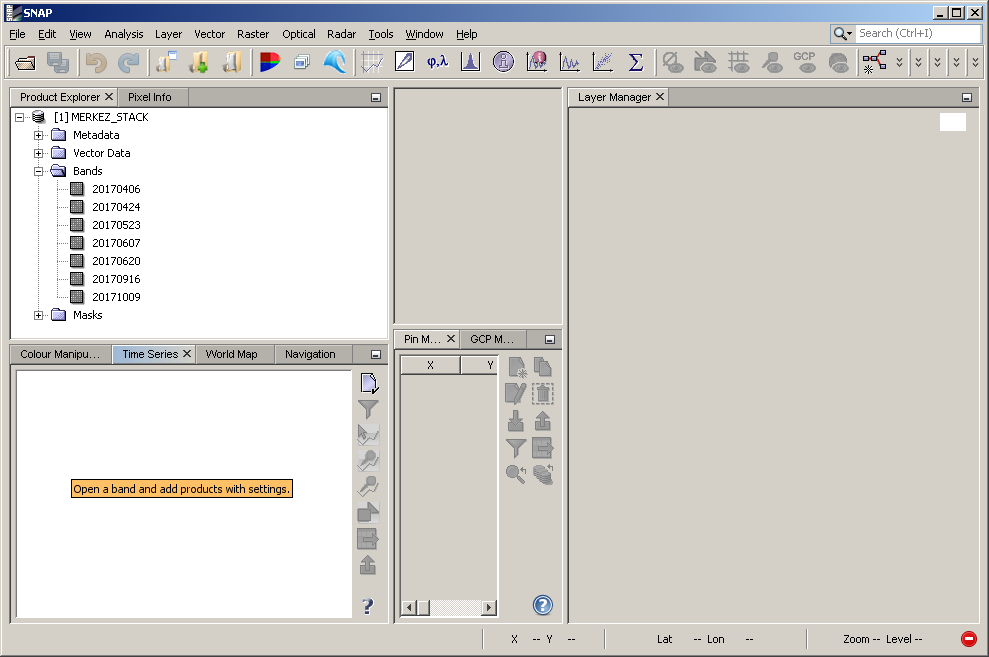
I want to view times series stacked band views like your example picture. How did yo do it? Is it possible with stacked bands in one image?
as I said - for me it worked with a stack but some other reported that it only worked with all images added separately.
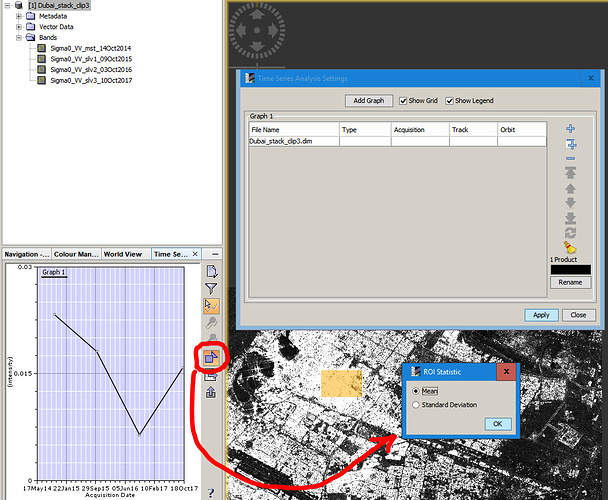
Click here ![]()
Add the stack, open a raster and test of you see a graph.
It is important that SNAP recognizes the date of each scene from the metadata.
1 Like
Hi ABraun, so i have uploaded the images but the is no graph . Does this mean there is no difference ? I have treid to check both on the mean and standard deviation . All the three images have been masked out using a shapefile .
Thanks
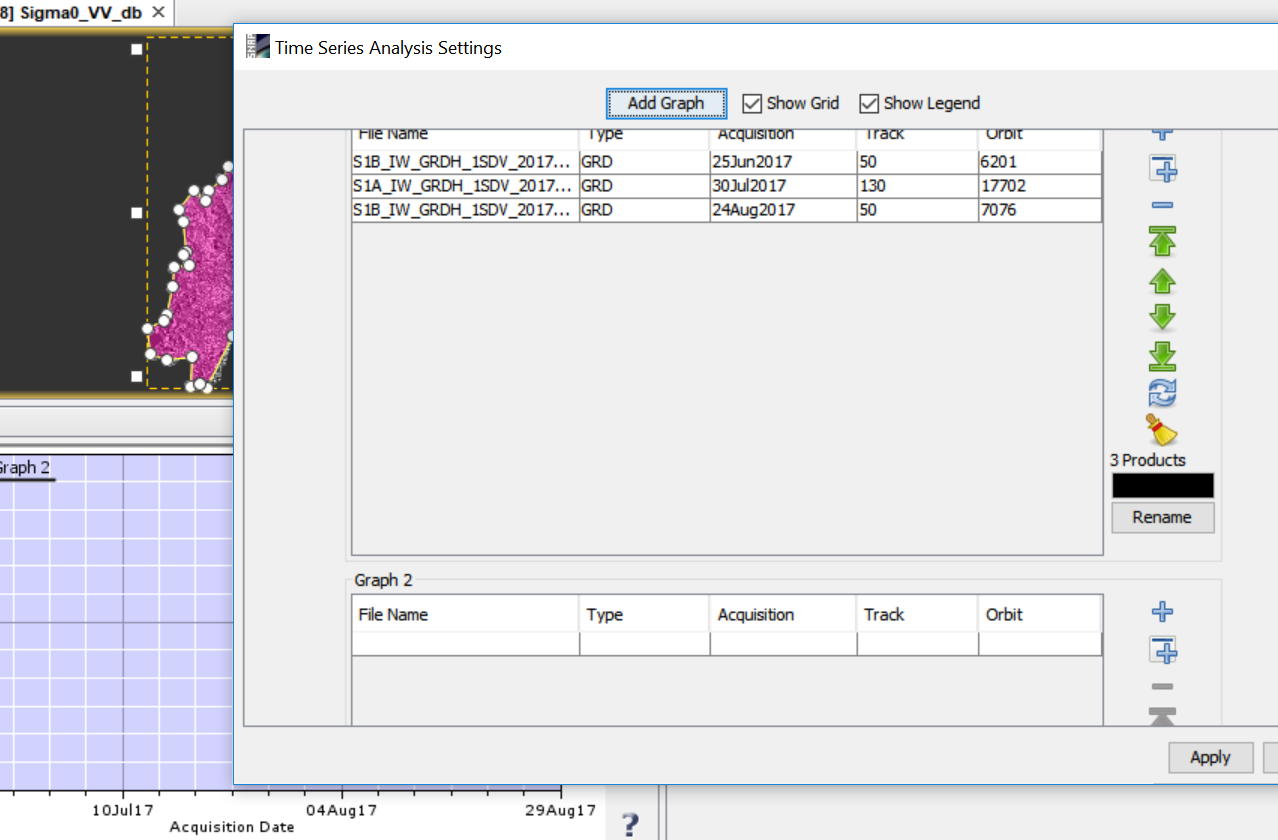
Did you try if the graph works on simple mouse-over first?
If you want to use the polygon, you need to select it accordingly. If you did it, I cannot think of a reason, sorry.
Ok thanks . Is there any other technique that i can use to show a difference of three images at a go ?
you can create an RGB image to visualize the differences at each date
Thanks Once more
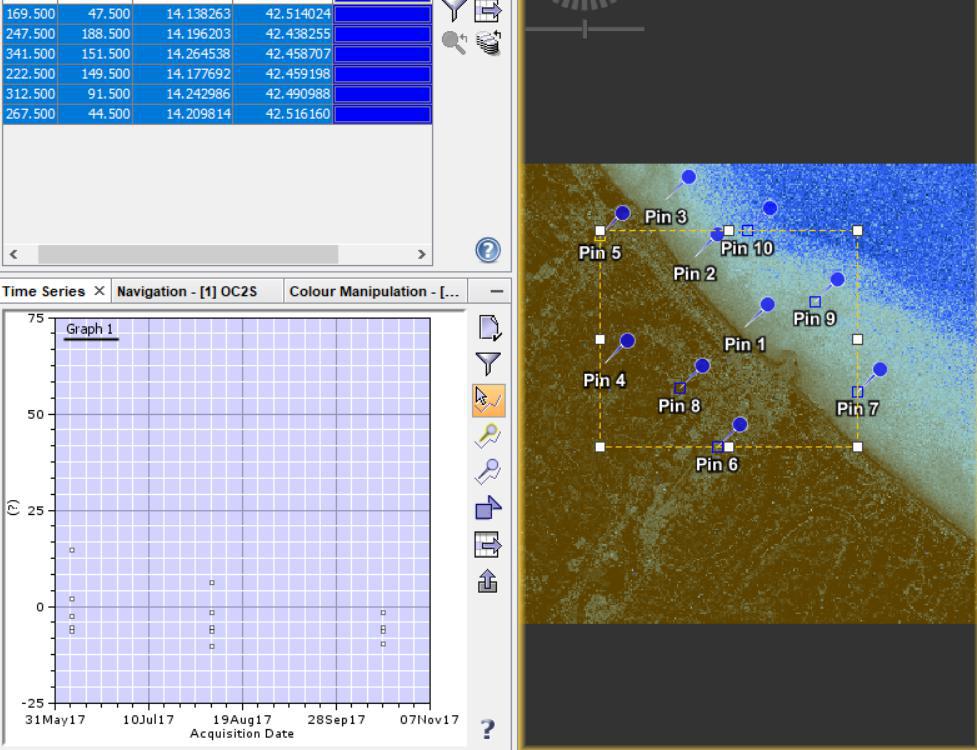
hi Guys, I faced with strange problem. when i apply the time series i see just points without lines. would you please tell me what is problem with?
There is a problem that I realized in the time series tool. When I do “export graph to text file”, VH, VV etc. bands values are just in certain values such as -4, -7, -5 but when I open the VH, VV values on “pin manager” they are like -4.00336, -7.504325, -5.503495 as you see below:
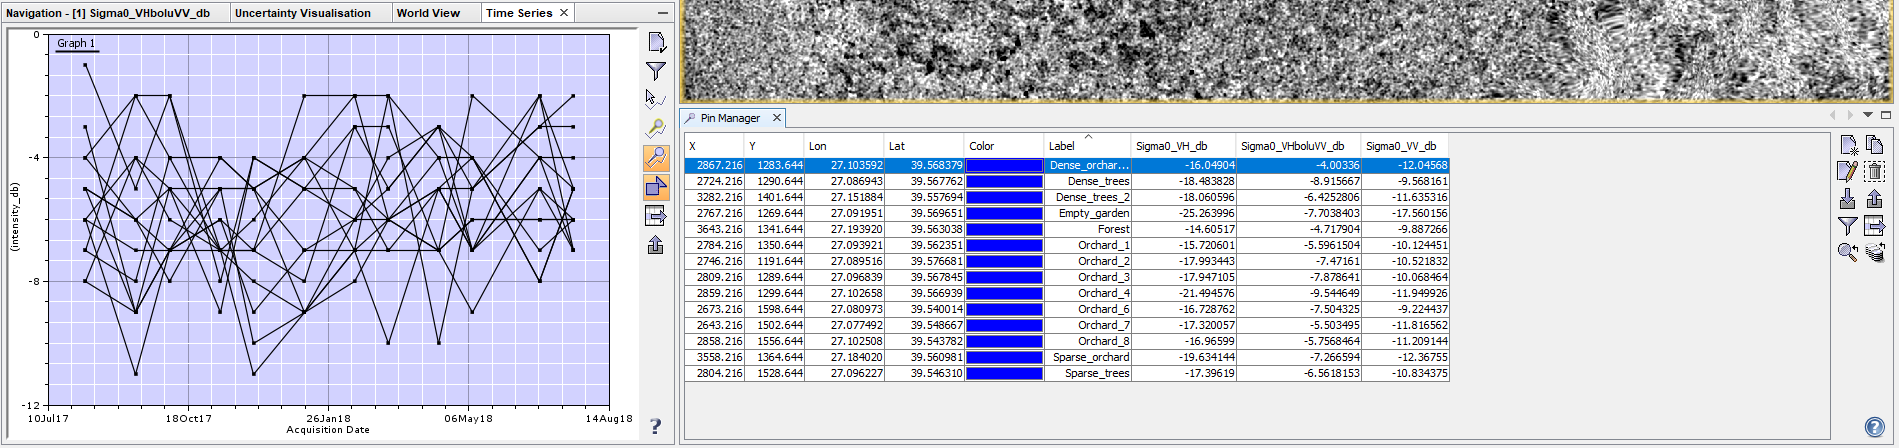
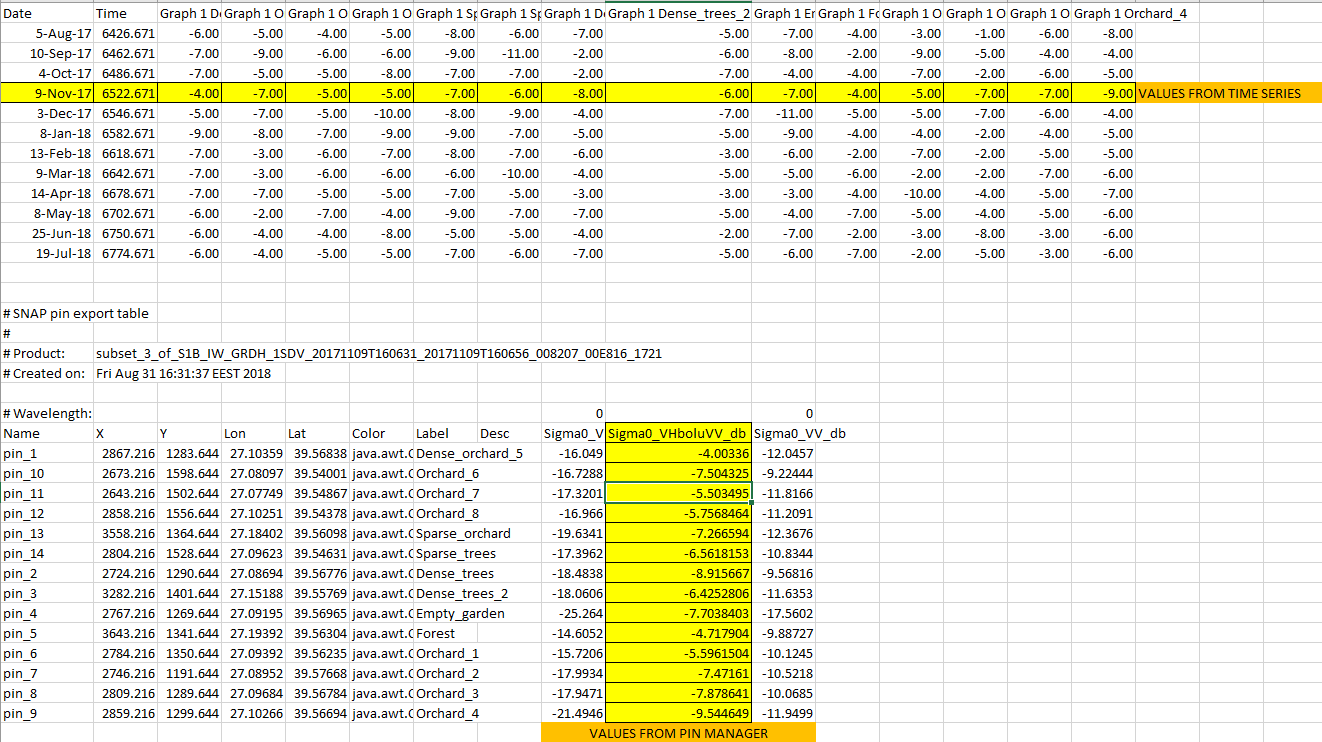
I think pin manager shows real values. But why values are different when I “export graph to text file” from time series?
hi team,
I have given 4 images for time series tool, but sir in the output only three image points are coming, what is the problem behind that can you please help me…
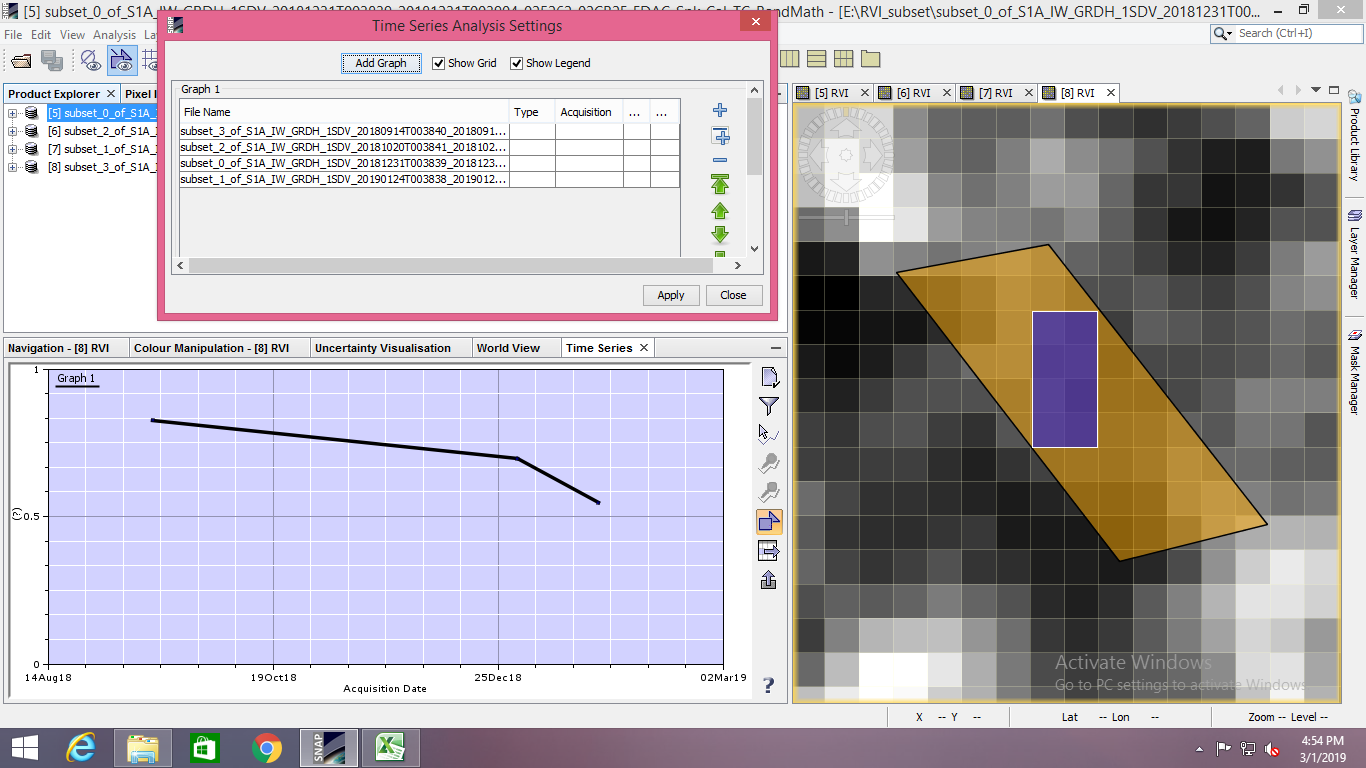
thanks in advance.
these two are separate
- the pins allow to extract the values through all rasters into a table, so you can create a graph in MS Excel, for example
- the time-series tool allows to directly display the values of the stack in a line. Make sure you have them selected by the filter button and chose the right option (cursor, ppins, or AOI). For large stacks, it can take a lot of time.
Hi everyone
Could some one still clarify some of the exportation options here. With this time-series analysis tool one can view mean values within certain polygon. With the pins or “Extract pixel values” -tool one can export single pixel values from multiple products simultaneously.
I have multiple polygons depicting small areas and a time series of Sentinel-1 GRD-images. I want to export mean values of pixels that fall within the polygons from every image. Is this possible with time-series analysis tool, or is there some better option within SNAP?
Can I use multi-polygon shapefiles to get the mean backscatter values instead of drawing ROI?