I have a stack with both VV and VH data. Will the time series tool work on this stack by just selecting all the VH data or should I make separate stacks for both the polarisations?
you can segregate the polarization based on your need in time series tool filter bands…
time series tool> settings>select the stack>apply
under time series settings there is a filter band option select and choose based on your application
I have timeseries of sentinel-1 IW GRD -data processed to gamma0. If I add all the products to Time series-tool and export ROI mean values as .csv, I get every products information written on its own row, including date-info (column names are not correctly exported, but this is easy to correct manually)
If I try to create a stack or to co-register the products and then do the same operation. Resulting csv-file has only master file’s date information, also rest of the data is written on that same row. Even if I would correct the column names, date/time information of separate products is lost. As I have to relate images to insitu-measurements at certain time, this creates problems. So does stacking the images actually bring any value to process, or is the outcome the same. Can one trust that these preprocessed gamma0 -images are already aligned?
Hi,
I use the same Data right now. did you find out the answer?
Hello,
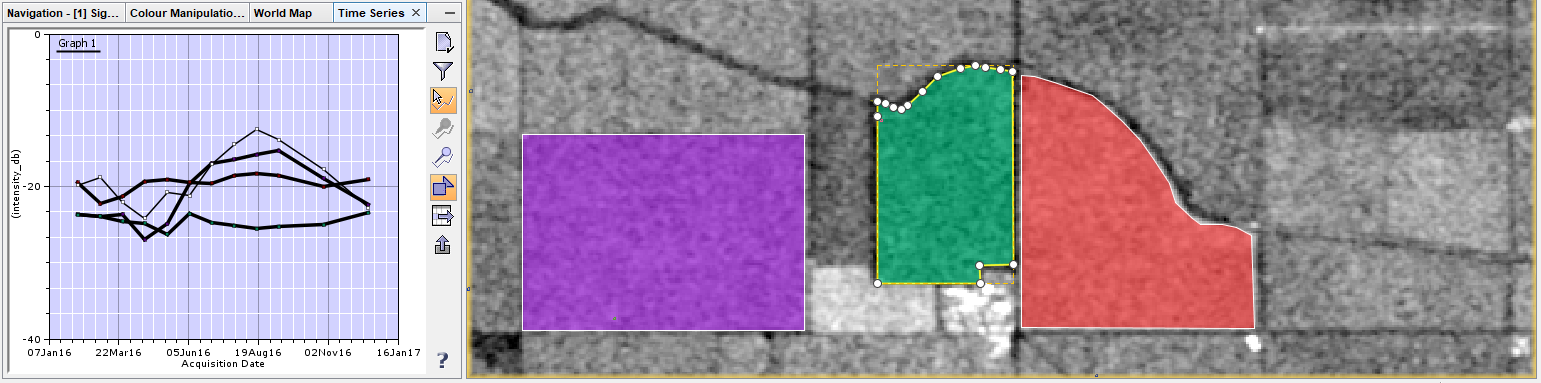
I’ve got a question regarding the time series analysis tool. Is it possible to create a graph for more than one ROI in one Image, to compare the different ROI’s over time?
no, currently only multiple points are supported
Although it is already some months ago, I tested this again and it works out (the show at cursor position option must be active as well)
a new tutorial on time-series analysis has been published: Time-series analysis with Sentinel-1
3 Likes
Excellent material! Thank you very much.
It will be very useful for me.
happy to hear that, thank you.
Dear Andreas, this tutorial is awesome. Very clear, although I have a few doubts.
- Can I use it over the ocean (As this is an example of a scene over terrain)?
- Can you please explain what information does the temporal stack of avg, min, std dev give? As you have mentioned
temporal statistics are not identical to the mathematical average and standard deviation, because these are calculated based on linearly scaled data?
Can you please explain what does this mean? How do I interpret the output as?
Thanks in advance
as long as you don’t remove the ocean areas during the terrain correction, you can use it on any data. If it is open sea area, I recommend the Ellipsoid correction instead.
They compute the mean, min/max and standard deviation of all values along the time series of one pixel. The arithmetic mean is just not 100% correct when the data was converted into log-scale (dB), because here other laws apply (https://www.reddit.com/r/explainlikeimfive/comments/6d49o6/eli5_why_shouldnt_i_average_logarithmic_values/)
2 Likes
Whoa, I just forgot to mention that I was not using terrain correction and used Ellipsoid correction instead since the scene is completely over the ocean, which I realised through this forum.
Glad for the confirmation.
And thanks for the link on log values. So, I assume mean, min/max & std dev ultimately means how on an avg that particular pixel pinned is varying?
Well, in the end, min/max are still mathematically valid, and the mean still gives you a good representation of how all images in the stack look at average. Same applies for the standard deviation (which areas are constant, which are changing over time). So you can use them but the absolute values have to be treated with care.
1 Like
Thanks a ton for the response. Will use them carefully.

Hello! ABraun, why can’t I find the time series icon you referred?
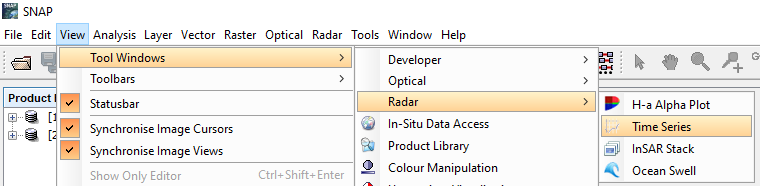
OK, I find it. Thanks a lot!
Another question,when I export the time series data. It shows like this, 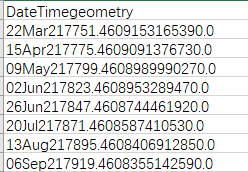 the value seems not the same as radar dB value as in the graph.
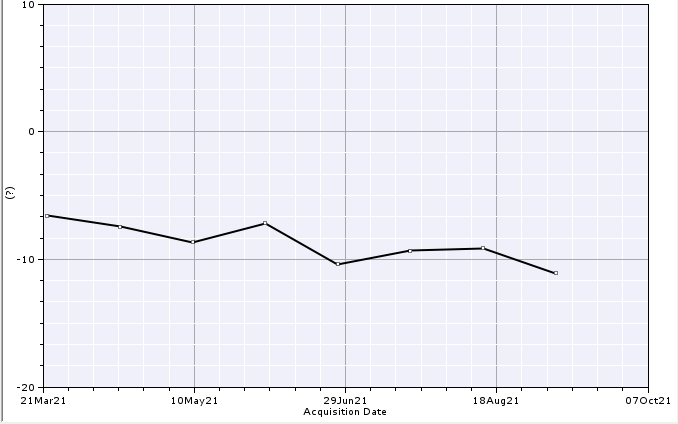
probably MS Excel did not interpret these values correctly because of missing information on the column separator. Please check here how to load them while controlling these parameters: How to open CSV files with the correct delimiter/separator – Affinity Help Center
Thanks! I’ll have a try!