I’ve got my coherence image using:
Apply orbit files -> Back geocoding -> Interferogram (selecting ‘include coherence’)
But before going on to filtering, multilooking and terrain correction, I was wondering if in theory at least, including the below steps would help to better constrain coherence to these temporal changes in scatterers:
subtract flat-earth (reduce effect of earth curvature)
topo-phase removal (reduce effects of topography)
remove thermal-noise (limit atmospheric effects on phase difference)
I thought that subtract flat earth and topo-phase removal have only effects on the interferogram, but not on coherence. But now I see that they are also included in the module “Coherence Estimation”. So I am interested in the answer as well.
I thought it wouldn’t have any effect on coherence as well.
I’m going to attempt the above steps with coherence estimation at the end. I’ll compare the output to the coherence you get out of interferogram generation and post the results.
‘Coherence estimation’ will not accept any interferogram derived product, asking instead for a stack of complex images.
Am I right in saying coherence is the magnitude of phase correlation between images (comparing master and slave phase) and an interferogram is the phase difference between images (master phase minus slave phase)?
I’m trying to get to grips with why it wouldn’t be possible!
I have get the coherence using two Sentinel-1 SLC images. According to a paper titled “Relating Sentinel-1 Interferometric Coherence to Mowing Events on Grasslands (https://www.mdpi.com/2072-4292/8/10/802)”, additional decorrelation sources have to be taken into account to get temporal derorrelation from this coherence (end of P5).
The paper also mentioned the ways to get rid of other decorrelation sources. But I have several questions on how to get temporal decorrelation from the total coherence.
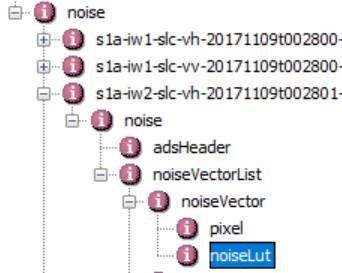
How to get the NESZ for the study area from the Sentinel-1 SLC data? I found the metadata about noise. Is it this equal to NESZ? If yes, how can I locate my study area?
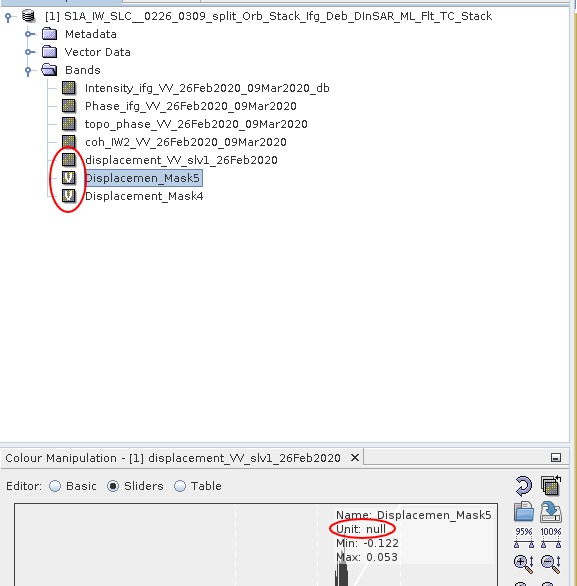
Hi @ABraun How can we check the coherence before generating the interferogram and how is it different from the one which is used in Band math? As I have used and expression " Coh < 0.4 then NaN else displacement?
Please Anyone help.
you can also run the coherence operator separately to compute the coherence without an interferogram. But in practice it doesn’t take much longer.
The band maths expression just uses the coherence values to mask the result (remove areas of low coherence). It does not produce new information.
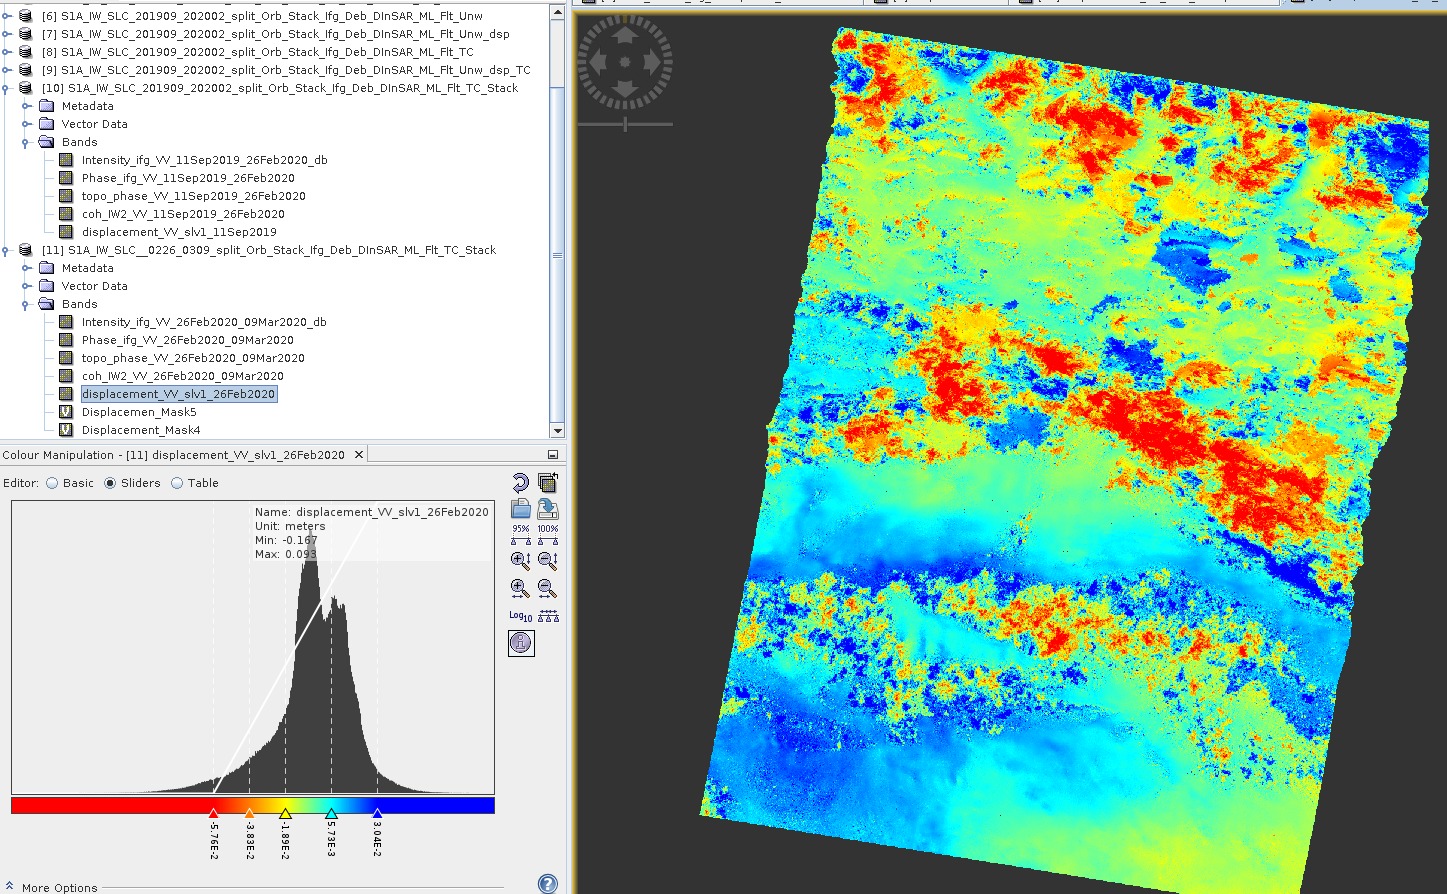
coherence is a pixel information, so it may be more than 0.3 in the small area in the center, but clearly below in the rest of the image (median around 0.1). These are no good conditions for analyzing interferograms.
as I said, the coherence is too low in large parts of the area, so the results are not correct. The workflow is suitable, but the data quality does not allow to retrieve accurate results.
What yo usee in in your results are variations caused by atmospheric disturbances and random patterns caused during the unwrapping.
For many regions 6 days of temporal baseline are already too high, because vegetation destroys the interferometric phase signal.
I don’t see how this is related to the number of bursts.
The most important thing is to avoid temporal decorrelation by selecting pairs with short temporal baseline, little atmospheric disturbance, and minimized vegetation cover.