I am trying to convert “Methane” L2 S5P product to a GeoTIFF in order to utilize in GIS. I have tried multiple approaches, few described in THIS thread amongst others. I am however not getting any valid results thus far.
The extent of the dataset as viewed in Copernicus platform is as follows:
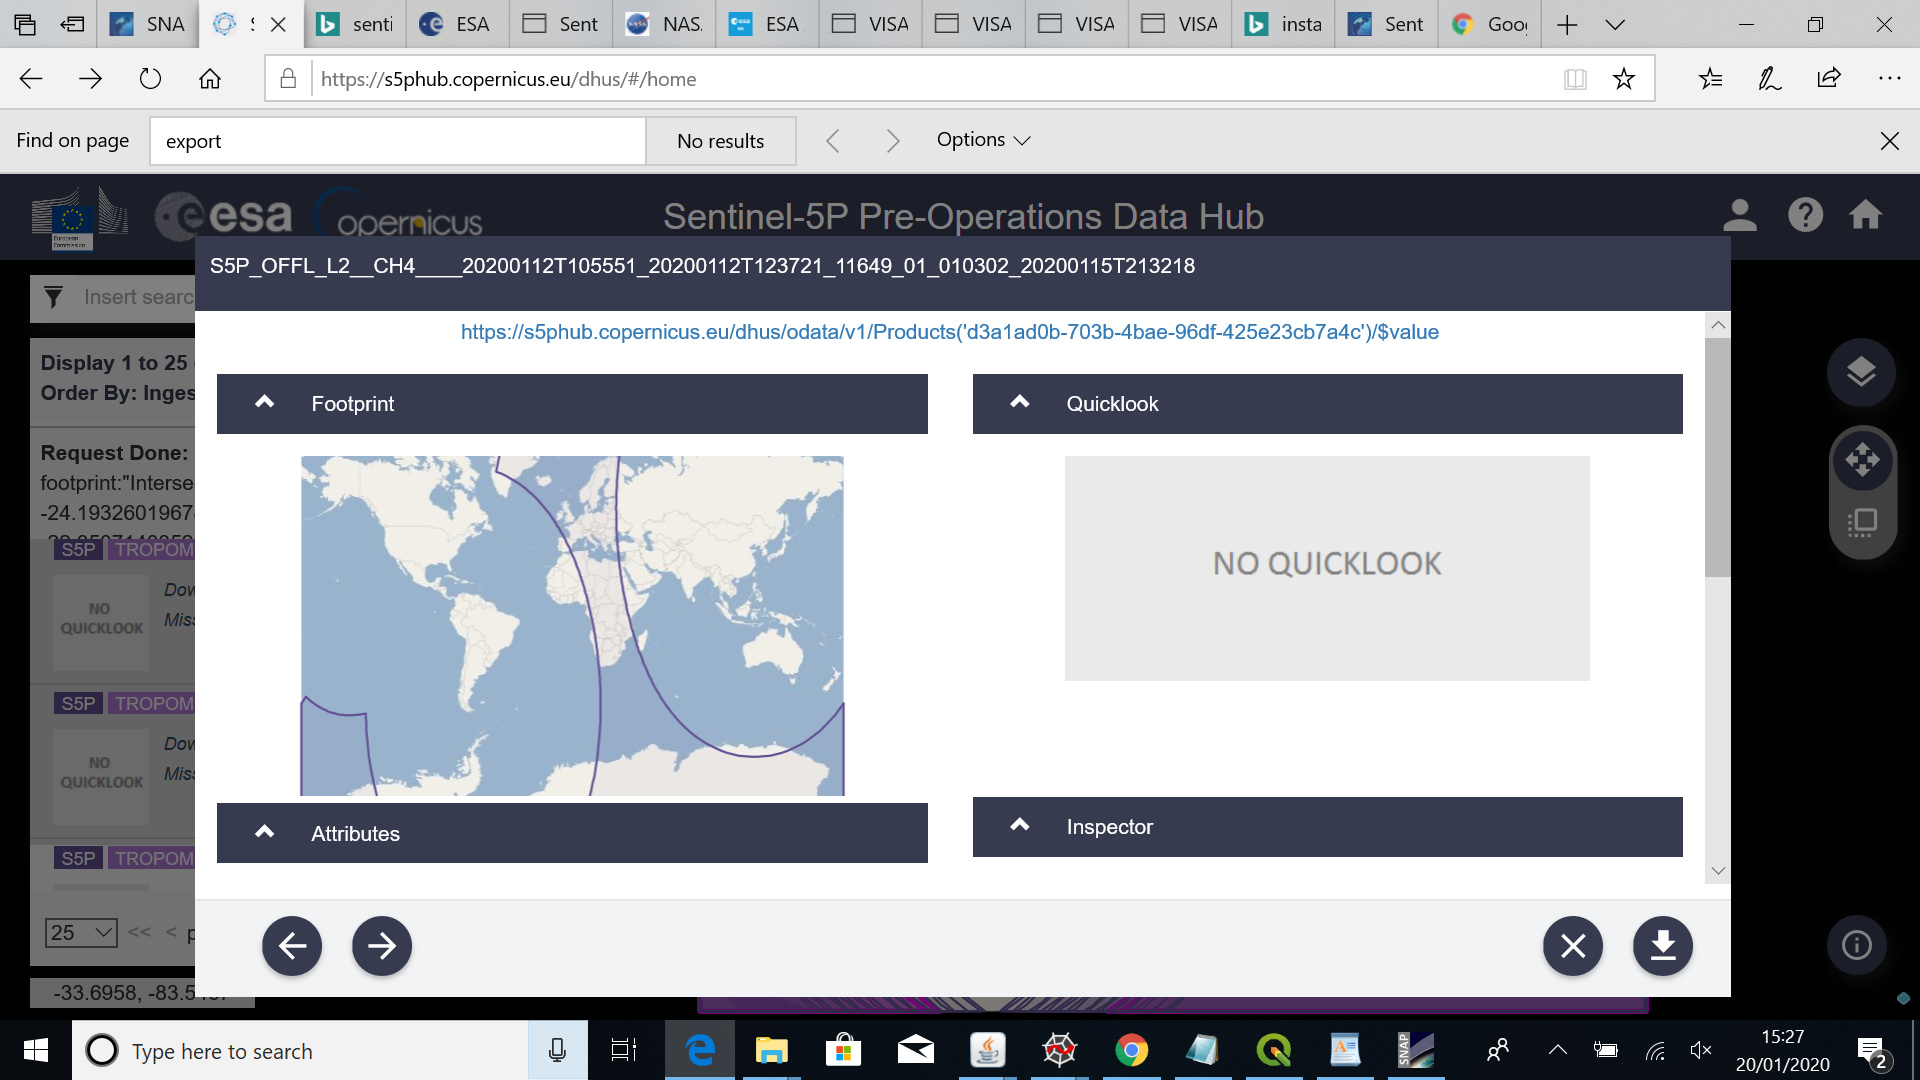
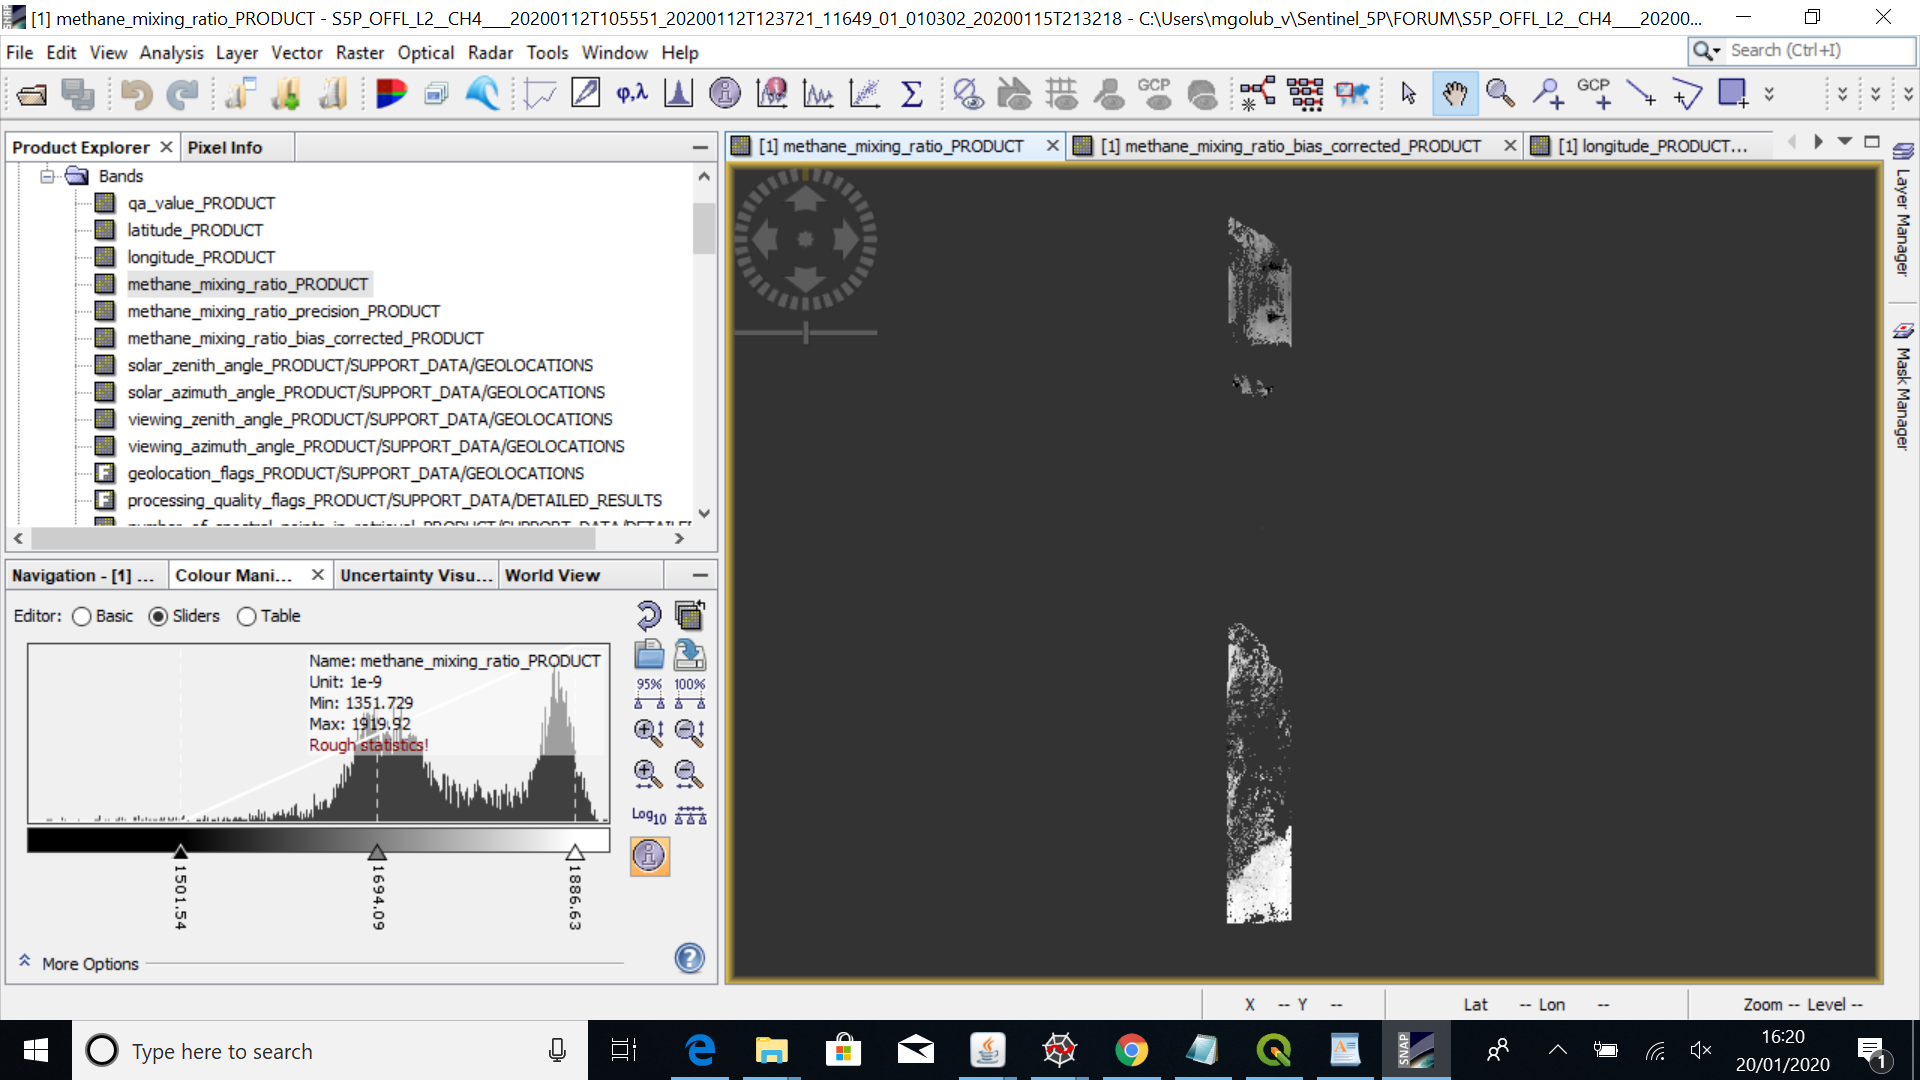
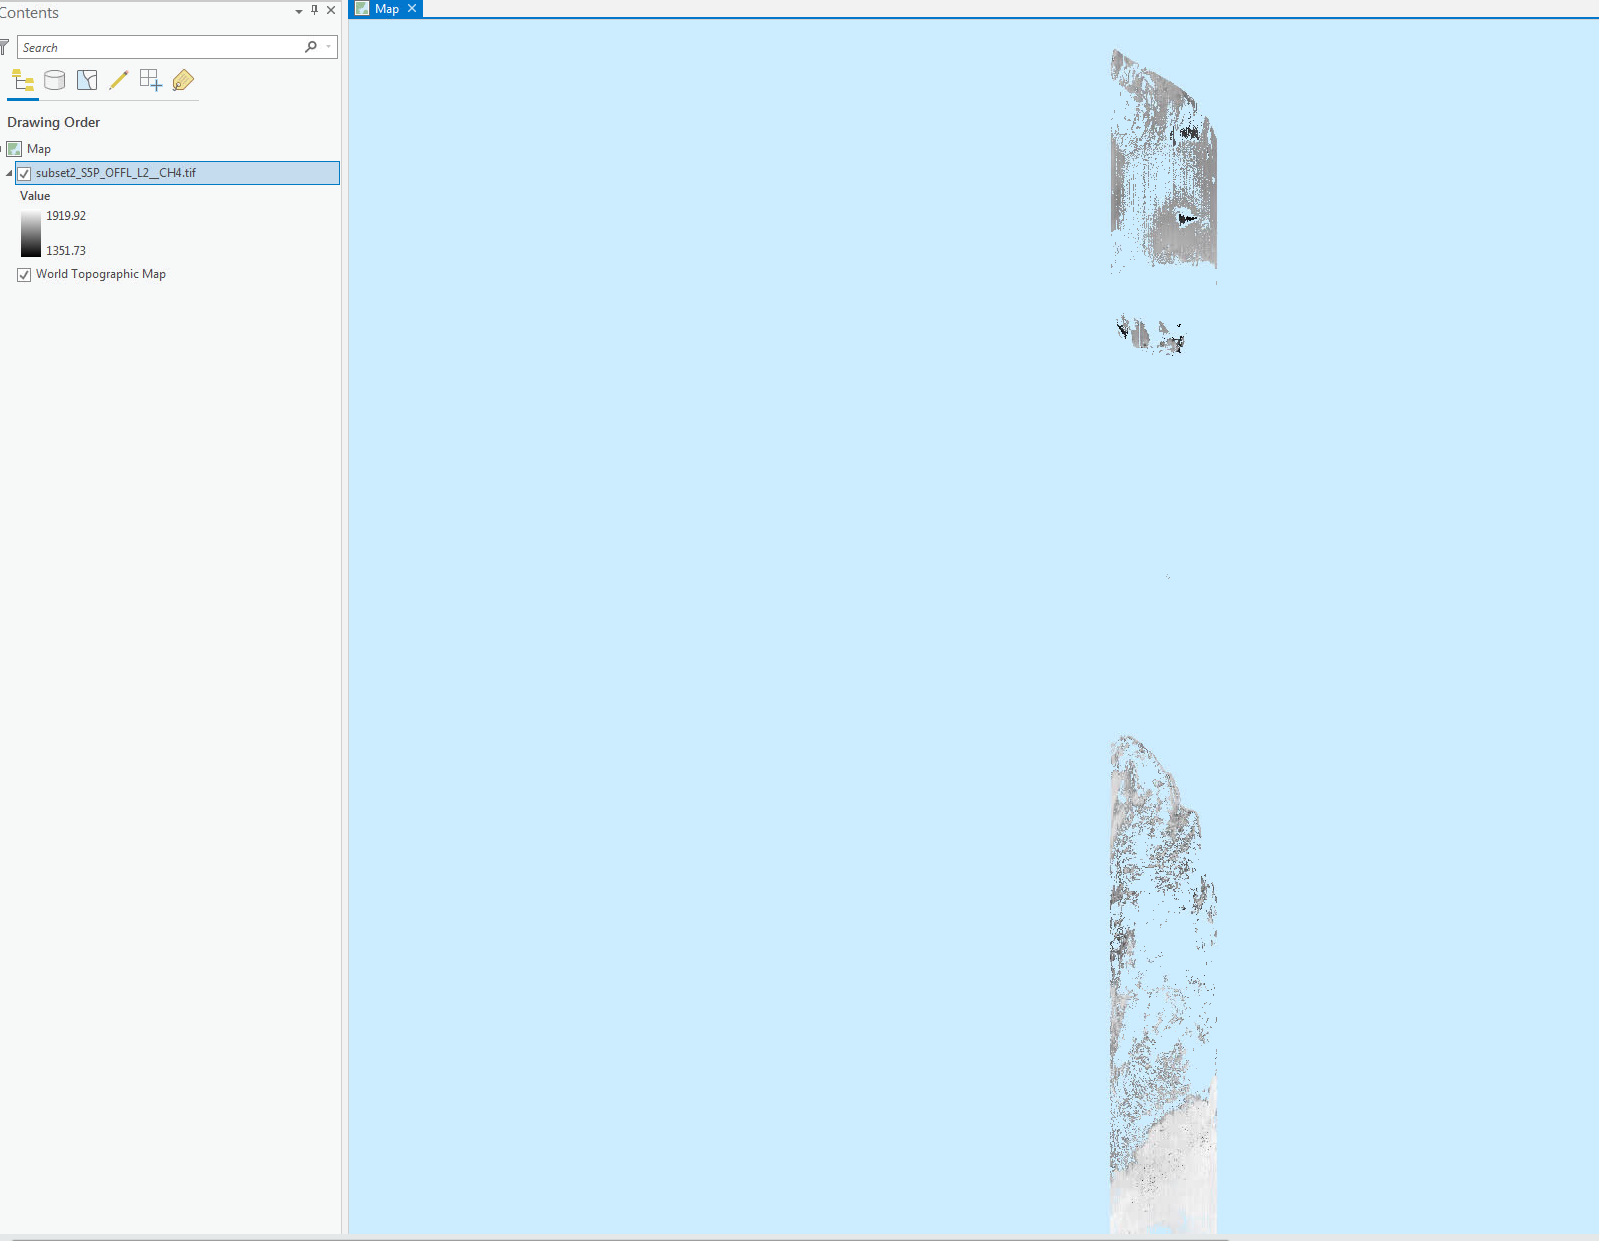
As a first pass, I created a subset of only the “methane_mixing_ratio_PRODUCT” in SNAP and exported this as GeoTIFF. When I brought this into GIS, I have applied Min/Max values, as well as defined “No Data”, replicating the metadata for this from SNAP. This has created a raster which looks similar to what I see in SNAP, though in GIS it is placed in a wrong location. Also - the spatial extents are incorrect, so is the spatial resolution - I understand this should be 7x7km:
SNAP View:
ArcGIS View:
Following these attempts I then tried the “SNAP Only” way as described by @marpet. I have exported only the band of interest “methane_mixing_ratio_PRODUCT” as a GeoTIFF subset, and brought this back into SNAP. However - when I export it again, I do not see the lat/lon bands, and also I do not see the tie-point grids on the corresponding tab either. I am using SNAP 7.0.3.
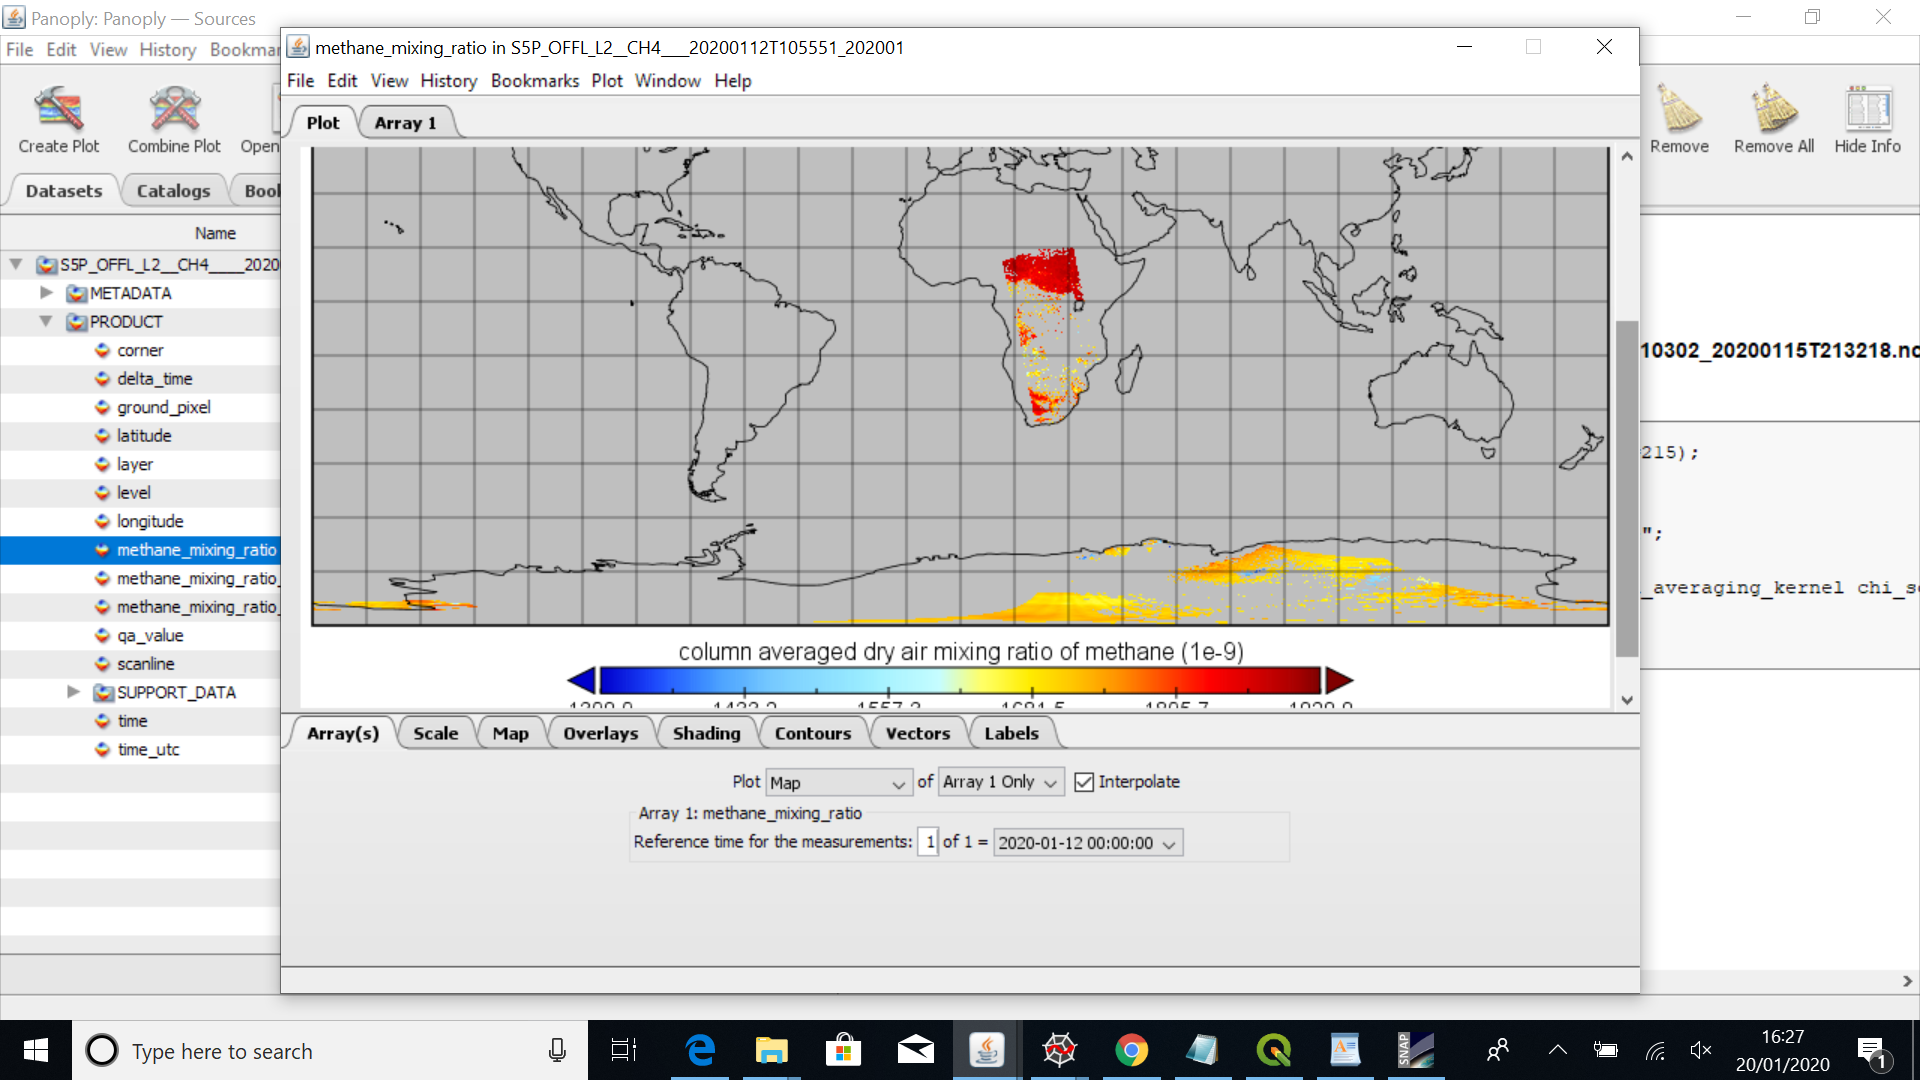
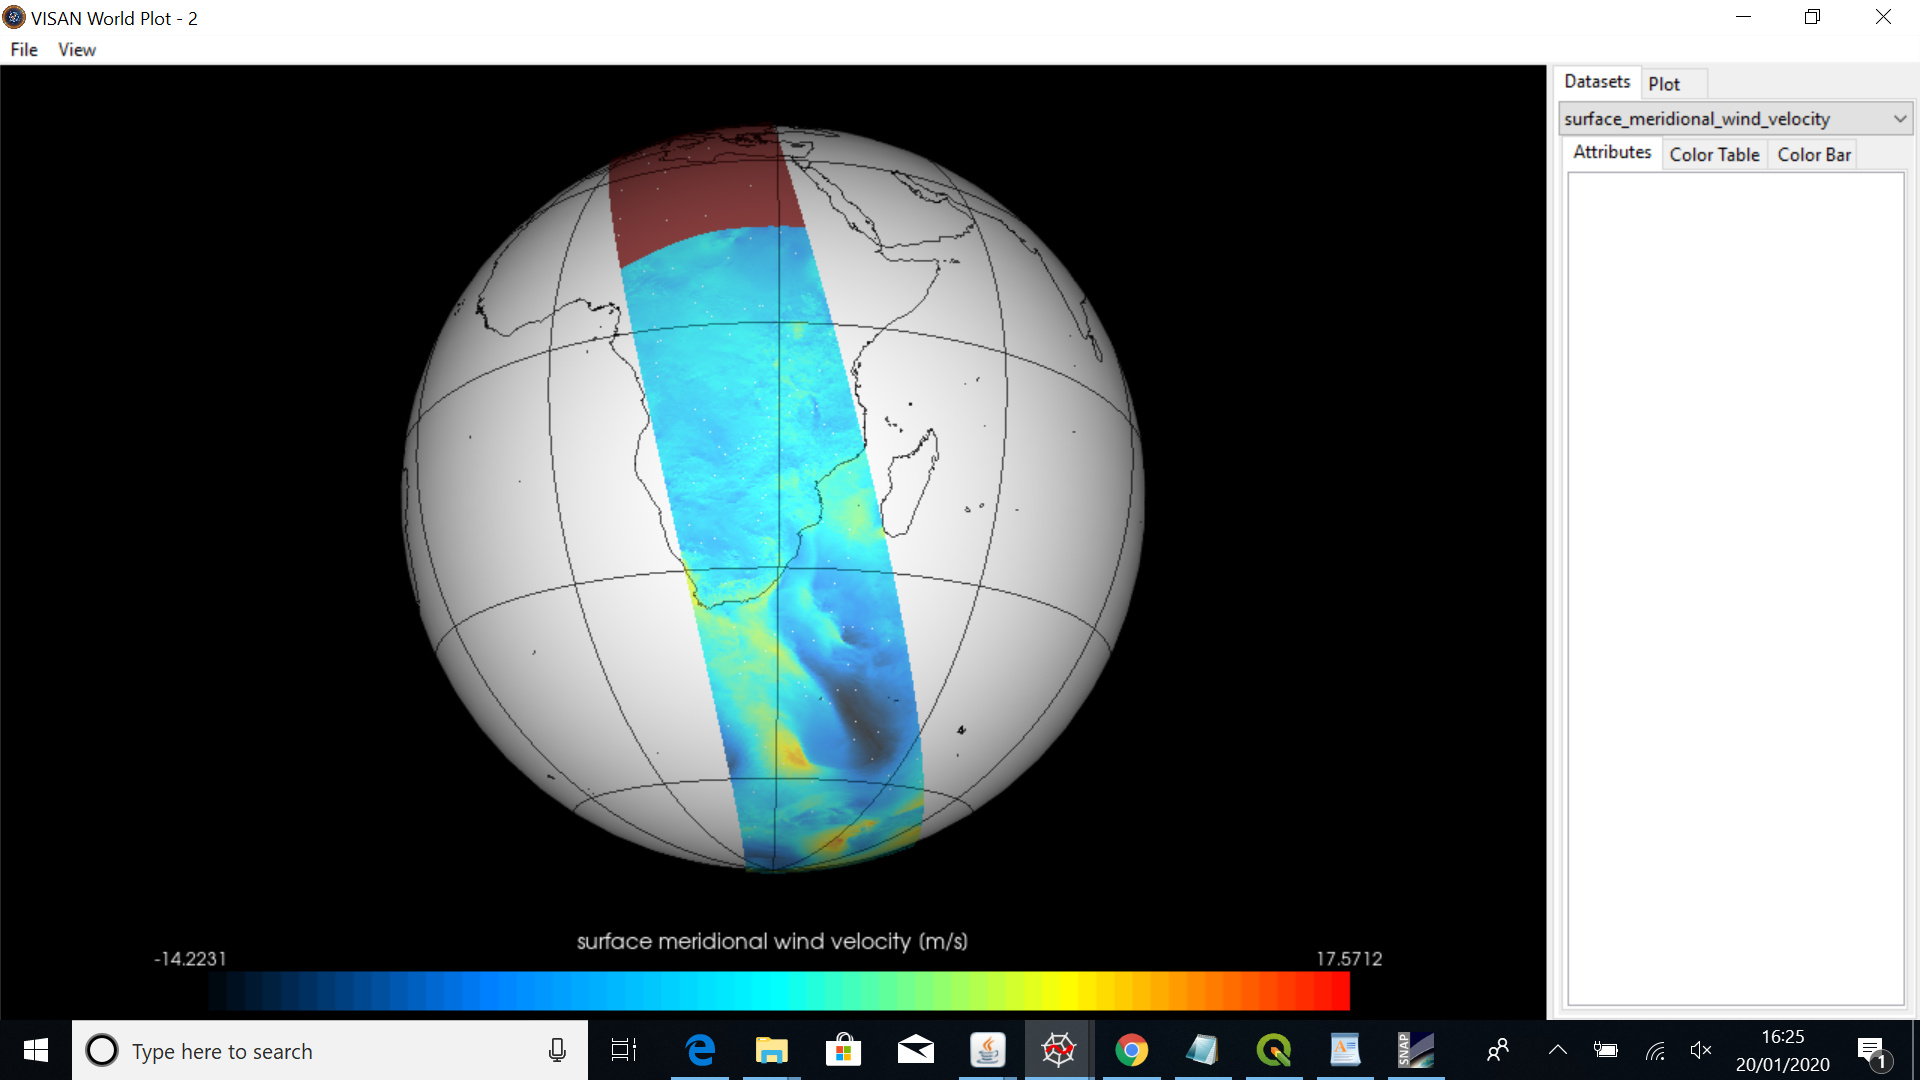
When I view the same nc file in SNAP, VISAN and Panoply, each of these displays look slightly different. Reading the file via wplot VISAN function, shows me a “surface_meridional_wind_velocity” attribute only - not sure why this is the case.
Panoply View:
VISAN View:
If anyone has any other workflow, or can offer any insights, this would be very much appreciated.