Dear all,
I need to know how create boundary for my data (decomposition of Hentropy, Alpha, Anisotropy) using a shape file I create before in ArcGIS.
Thank you so much.
Piero
Dear all,
I need to know how create boundary for my data (decomposition of Hentropy, Alpha, Anisotropy) using a shape file I create before in ArcGIS.
Thank you so much.
Piero
Import a vector file and add it to the vector nodes of the product. You will then be able to use it in statistics or classification.
Dear Lveci,
Let me know if I got you… I open the product I want to process, than I import the vector (and it will appear in its nodes) then I can start running the Polarimetry “processing chain” (such as split, deburst, speckle, and so on) ???
If you’re using S1 IW SLCs, it might matter that you do the import after the deburst. Also the coordinates in the shape file may not match precisely if the image is in SAR geometry. Doing the import after terrain correction will be precise. If you want to do your analysis without terrain correction then first apply the Update Georeference operator and then import your shape file. Note that this will create a pixel geocoding which can make any processing after it very slow.
Ok, I’ll try this solution.
Unless I make a subset after the split and deburst…so I can reduce even more the size of my data and so I can avoid the slow processing which is produced by the applying of the shape.
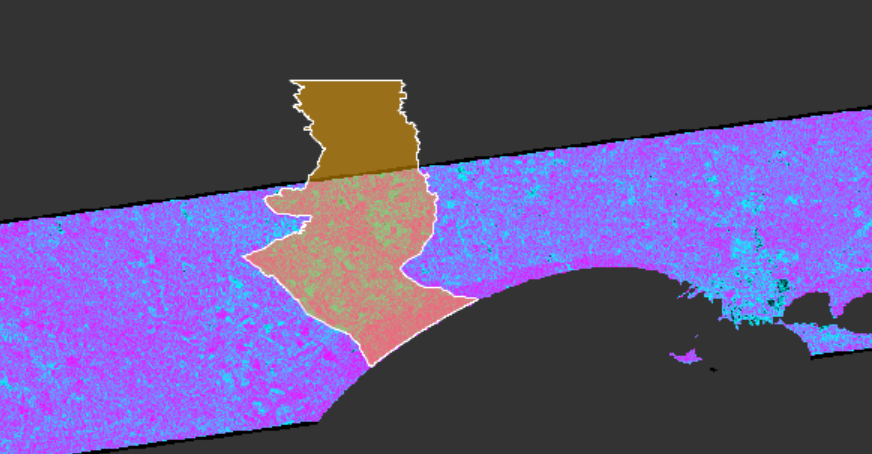
Hi Lveci,
This is what I obtained: the pic below shows the Entropy and as you can see the orange polygon is the shape file I imported. What if I want to have only the area inside of that polygon?
You could right click on the band and go to properties. In the valid pixel expression you could type the name of the vector node.
Alternatively, in a graph you could use the land/sea mask and apply the vector node as the mask.
Ok Great!
Is that possible to change the color (no color) of the polygon? And what about if I need to export the result into an ASCII so i can use it in R?
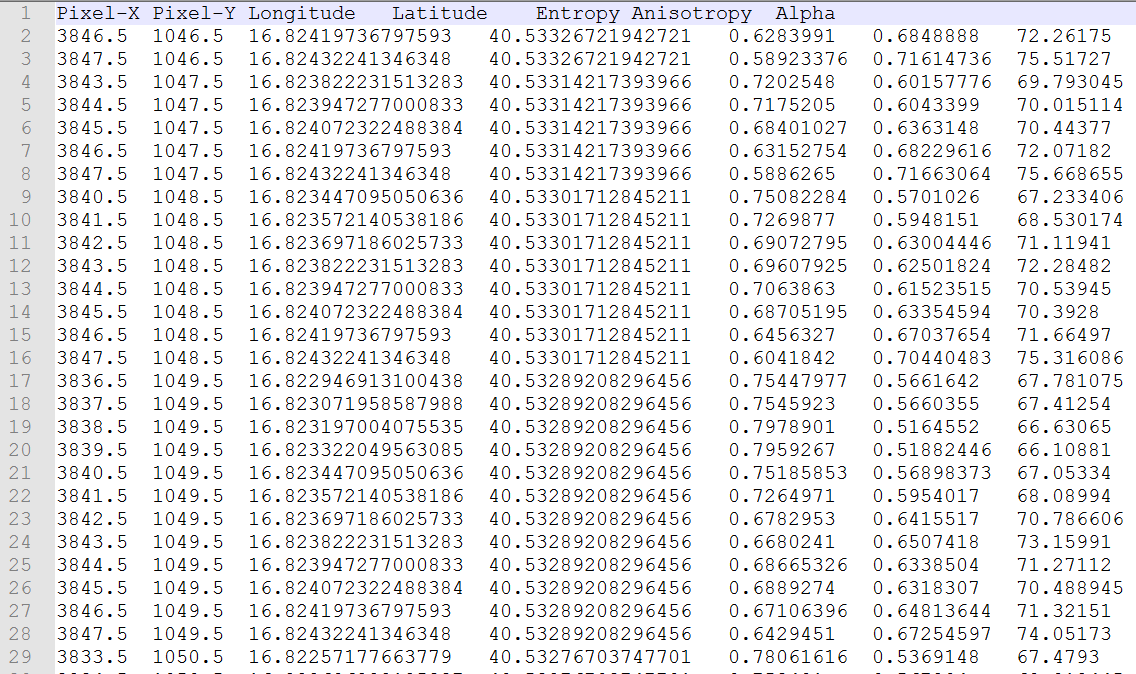
Go to the layer manager if you want to stop showing the polygon. Exporting there are a few options - exporting csv, exporting mask pixels, export pixel values
mm ok, thank you. Can these format be used in R (if you know).
Regarding the colour.
You can open the layer manager and find the vector your are working with. Select it and the open the layer editor. The button the layers and the pencil. There you can change the colour.
For the export to ASCI.
Right click on the image and select Export Mask Pixels. And then select you vector from the list of masks.
Or you select from the menu File/Export/CSV. Before you should create a subset of you data which only contains your area of interest. Unfortunately this can not be done based on the vector data right now. But you can do it roughly.
Probably not right away. Maybe you have to rearrange it.
Hi Marpet!
First of all thank you for the answer! Then… what would you suggest me checking between these options?
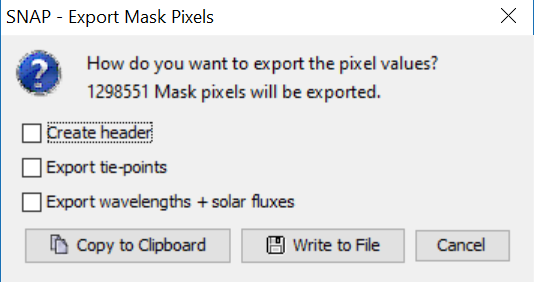
It depends on you.
If you want to have header information or not, if you want to have the values of the tie-points or not.
Or if you want to see the wavelength and solar fluxes for the bands as metadata.
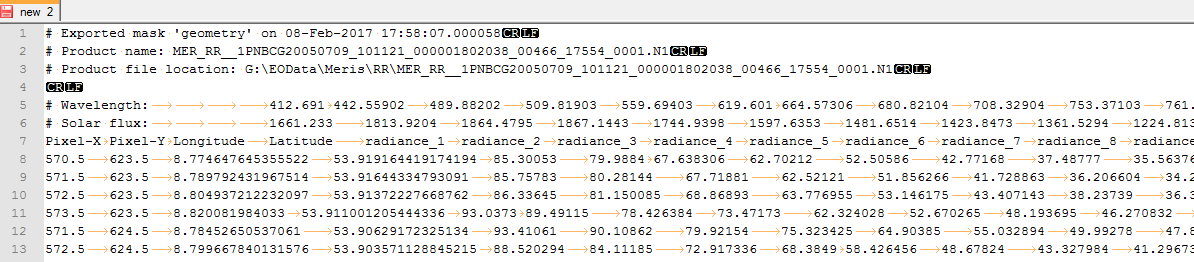
The following image shows you how the export will look like.
Oh ok very interesting! Thank you so much!
Great it works! Thank you!
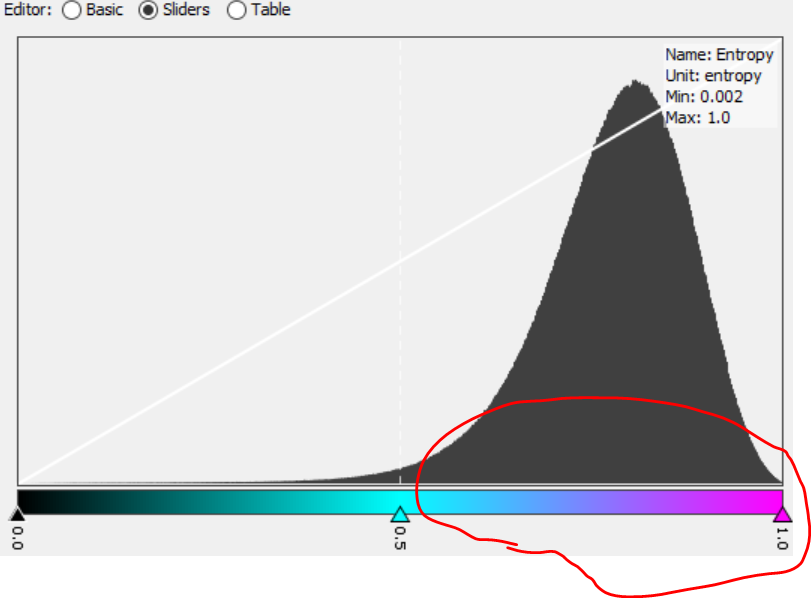
I’d like to know one more thing  … what about if I want the band (Entropy band for example) shows me only the values “>0.5” (for example)???
Regards!
You can add an expression in Band Maths or in the band properties valid pixel expression.
IF Entropy > 0.5 THEN Entropy ELSE NaN
Very good, thank you!
Best regards! Piero
Hello lveci,
I’d like to apply this operation to band maths -> “45 <= Alpha <= 60”.
Could you explain me how can I go through it?
Dou you want to create a new band with Band Maths or do you want to change the valid-pixel-expression?
As valid-pixel expression you can write
Alpha > 45 && Alpha < 60
Now values between 45 and 60 are valid.
As band maths you can do:
if (Alpha > 45 && Alpha < 60) then Alpha else NaN