I am working with some SMOS data and I realised some difference between the SNAP image and the Table generated.
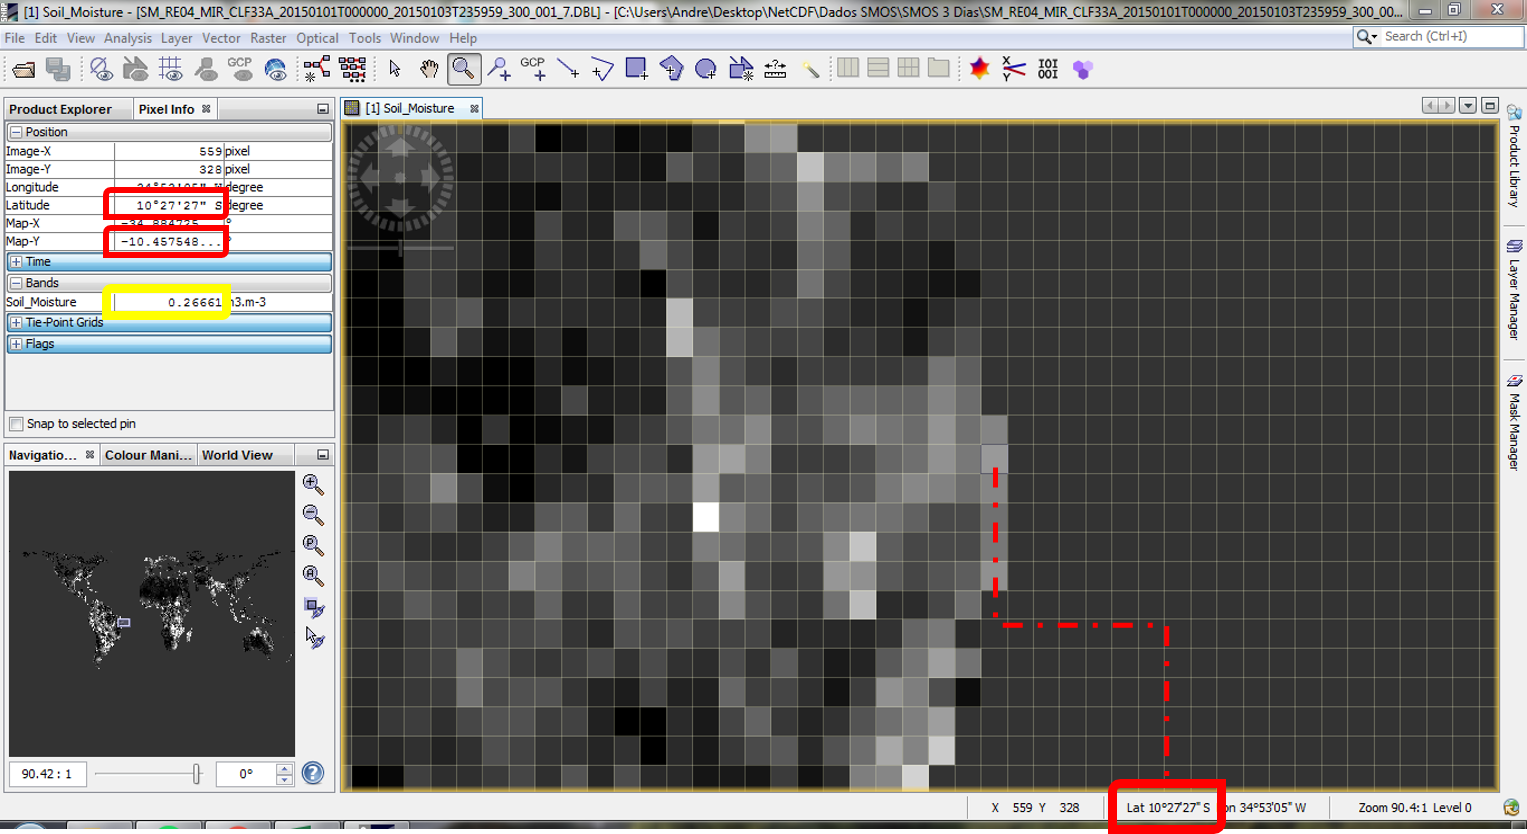
For example, I had attached two images, the first one show the SNAP visualization. In that image you can see the Lattitude shown in the red squares: 10º 27’ 27’’. At this cell, the Soil Moisture value is show in the yellow square: 0.26661 m³/m³.
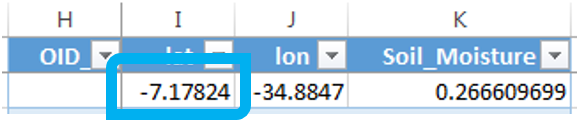
But, when you go to the table, you can see the same soil moisture value, at the same Longitude value, but with a different Lattitude value. You can see it the the second image in a blue square: 7.17824 (or 7º10’42’’).
Why is this happening? Is this any problem with the SNAP software? I attach also the SMOS file if you want to check something.
The Table was generated exported from AcrMAP 10.3 (using Make NetCDF Table View) as .txt, then pasted in the Microsoft Excel.
As we intent to work for a long time with SMOS, it is important that this things get clear for us.
Thanks in advance,
André Gadêlha
Water Resources Laboratory - Federal University of Paraíba (UFPB - Brazil)
BRAMAR Project - http://www.bramar.net/en/
This is a product which is not officially supported by the SMOS-Box.
Probably it is read by the generic NetCDF reader.
Even in this case it should give the correct geo-coordinates. The question is from where do you get this SMOS product and can you provide it to us?
I send you a separate message regarding the upload.
This product was not developed by the ESA. It is a CATDS (french center that study SMOS) product, and it is being very well used to the scientific community. It uses another grid (EASE 2.0 version). The cellsize is 25km also.
Thanks for providing the data. I had a look at it.
I can say that this is a general problem in our NetCDF reader. I’ve added your report (SNAP-724) to our issue tracker.
At the moment there is no workaround.
Maybe you can convert it with gdal.
GDAL is a software package for reading and writing geospatial data.
Maybe you can read it with this software and convert it into a different format or projection.