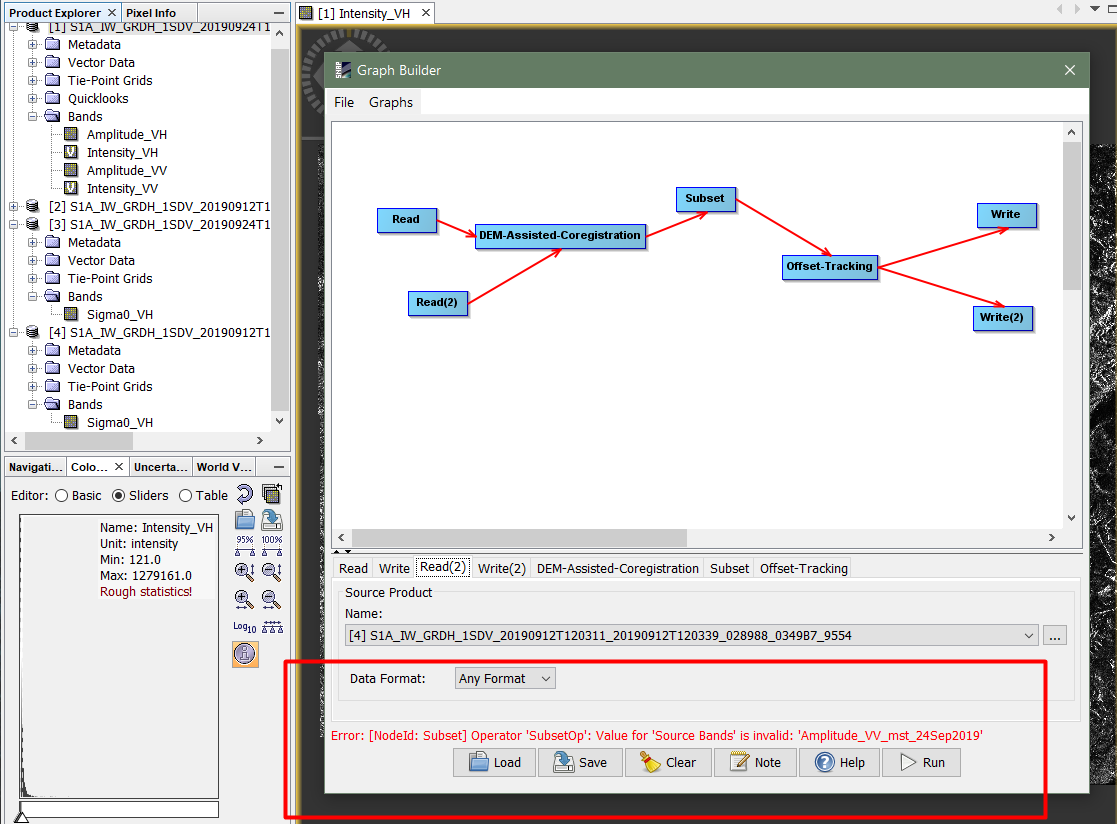
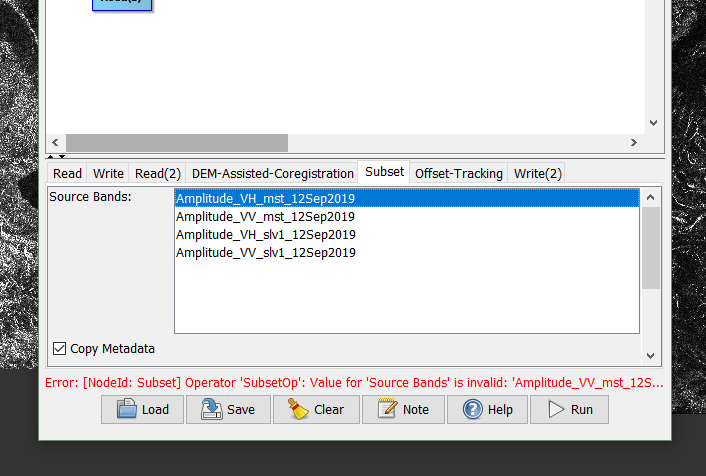
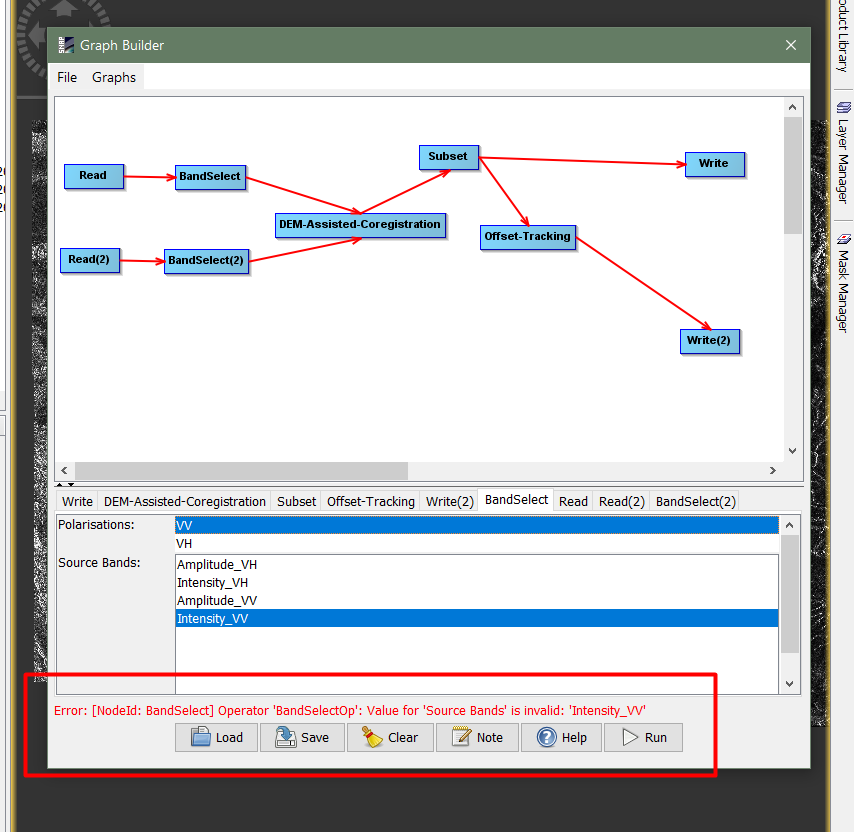
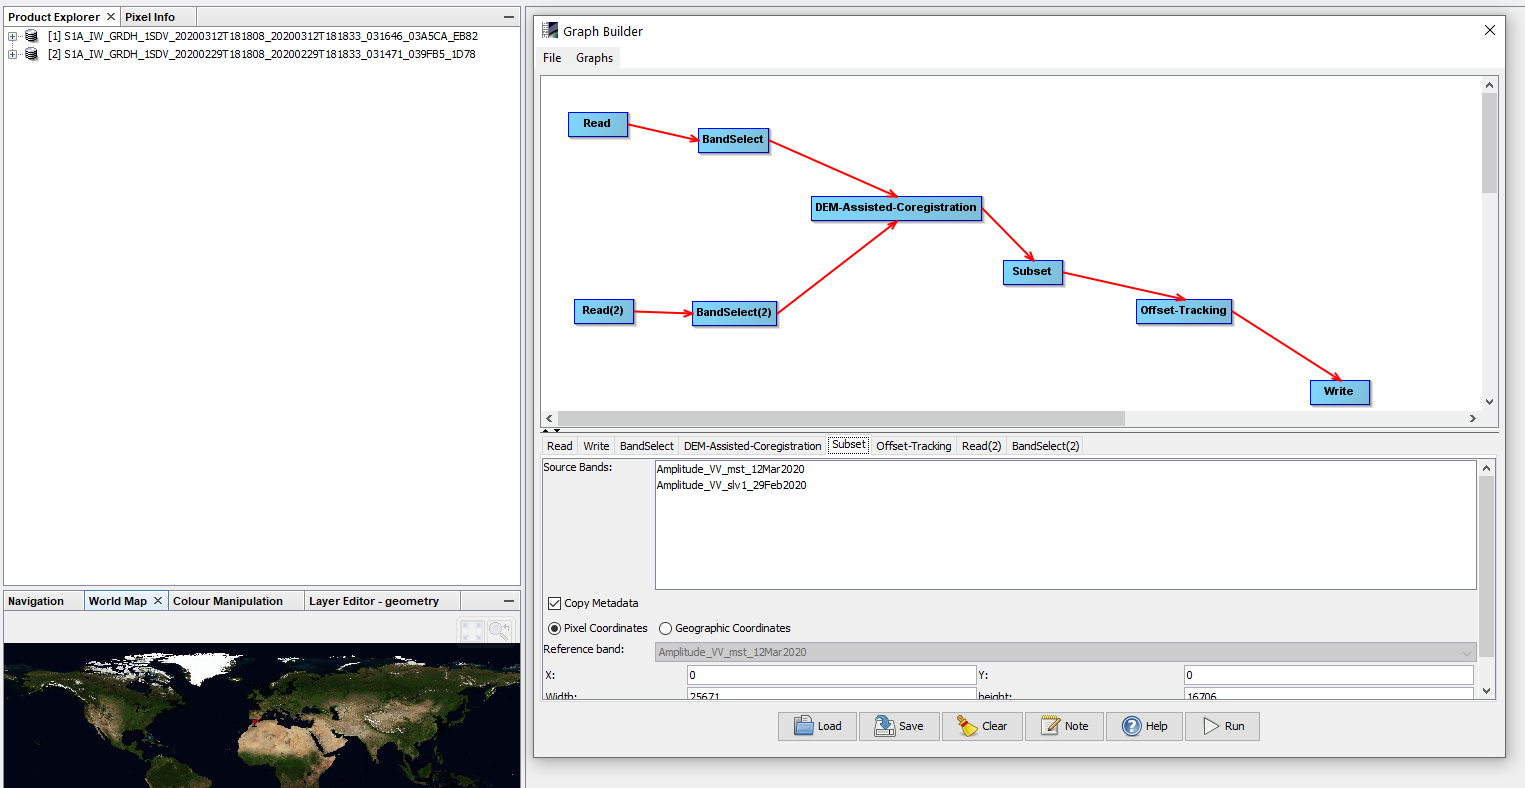
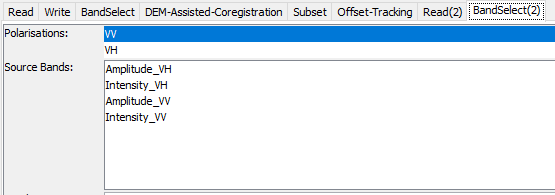
you could set a Band-Select operator after each Read module to reduce the information to the VV intensity, for example, so the coregistration will use only two input rasters.
Sometimes the XML gets messed up if the elements are changed too often in the Graph Builder. Please try creating it agian, piece by piece, and select the VV polarization in the BandSelect operator of both (leave the SourceBands unselected)
Is it possible that I downloaded strange data or processed it incorrectly? It’s a shame that I do everything according to the tutorial, but there are mistakes that just confuse me at all
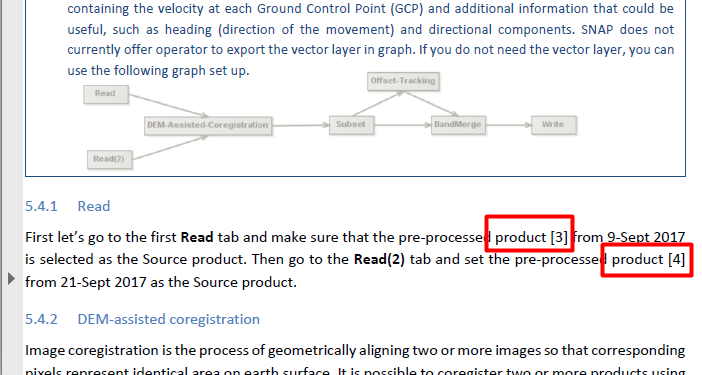
I noticed that you were working with products [1] and [2], but my tutorial at this stage already uses products [3] and [4], which were pre-processed by the following graph (screenshot 1 and screenshot 2, respectively)
so i delete subset operator and process has started.
I’m very sorry to bother you with such simple questions, but can I ask you for help inside this topic if needed?
ahead of me is one of the most incomprehensible moments where I have an error “The specified region, if not null, must intersect with the image’s bounds” and I’m afraid that I can’t solve this issue, even using EXACTLY THE SAME DATA as in the tutorial (now I’m trying with my territory)
Have you tried SAR Simulation Terrain Correction instead of Range Doppler Terrain Correction as I suggested here?
I get the feeling that you are following the steps without understanding their purpose.
Especially when you experience many errors, it is often better to execute the steps separately and not as a graph. Otherwise you never know at which step the error occurs. Also you have no control about the contents of your data.
Applying graphs is great to automate processes for repeated use. But for single studies I see little benefit from it.
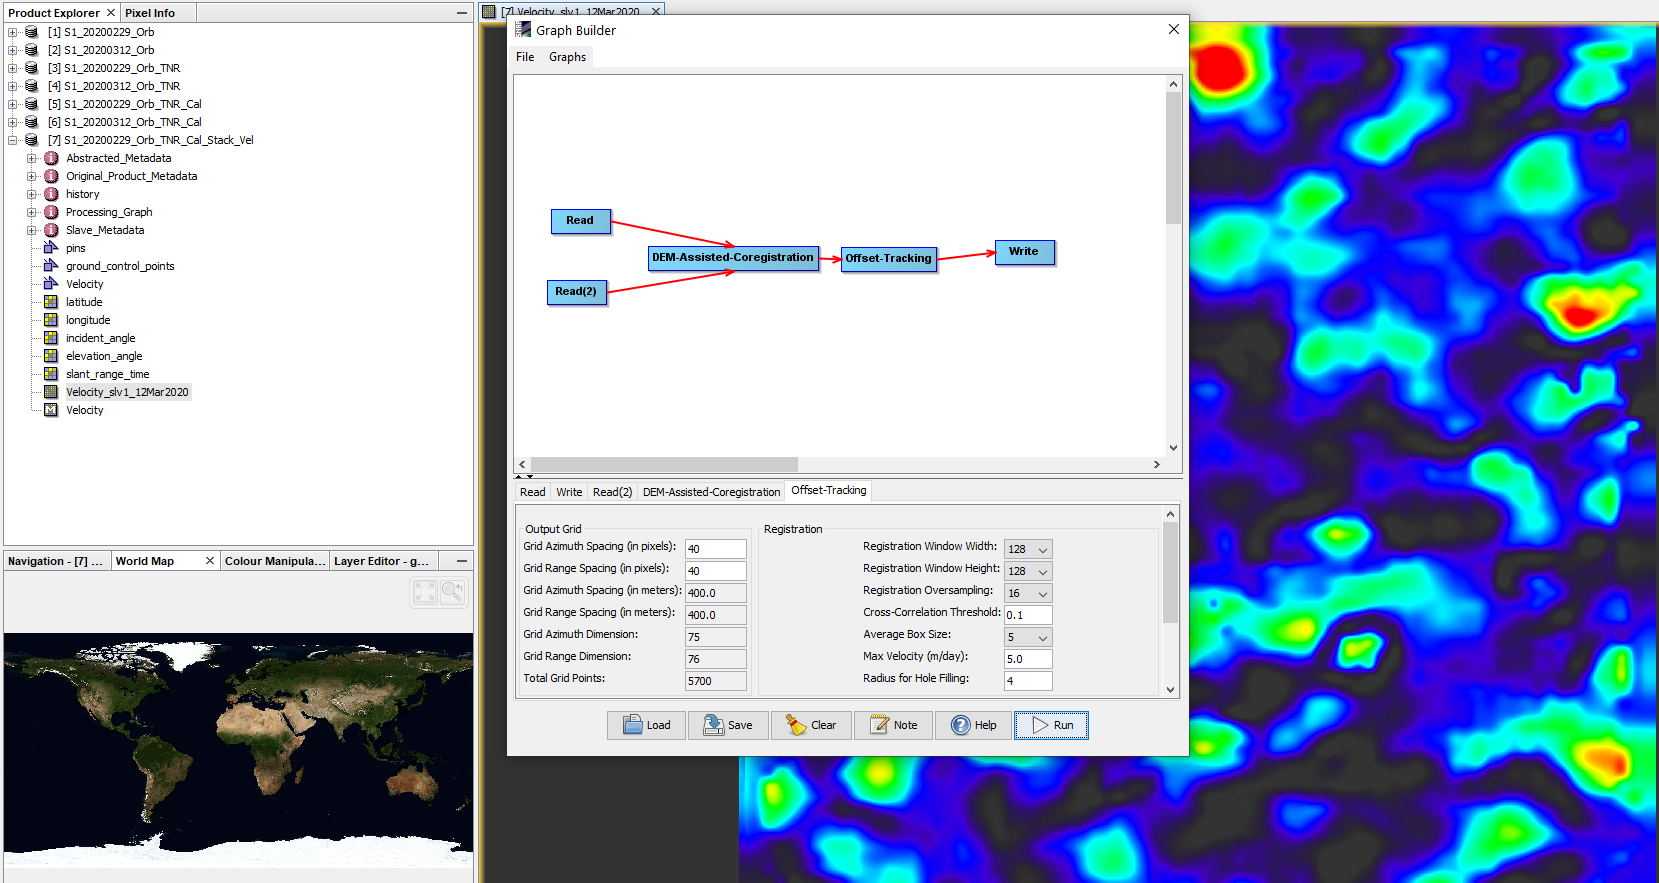
I tried. at first, the process took 2.5 hours, after which I received a file (or product [7]) that weighed extremely much and did not contain any data. For example, in the tutorial it was written (screenshot 1), but I didn’t have any data, there was nothing to move, everything was equal to zero. Although the vector grid was present, I still don’t understand why it doesn’t work with Range-Doppler Terrain Correction.
I got the following, I’m not sure if this is normal, but I don’t know how to fix it. anyway, it was with the past data. I was very confused when I downloaded exactly the same data as in the tutorial, published it and strictly completed all the tasks, and there WAS EXACTLY THE SAME ERROR.
sorry for the caps, I just don’t understand what the reason is…
looks alright, besides of the error tiles. Maby a lower azimuth/range spacing would improve the result.
Have you selected the Velocity band as input in the terrain correction?
It is very hard to me to understand the differences between the RUS tutorial and your personal workflow. Maybe there were minor differences but I cannot see them.
If you are working in a different area, the only thing that changes is the UTM zone.
Maybe you should not stick too much to the tutorial and simply follow the steps that make sense to you. Also, not as a graph, but process one product after the other.
I’m ashamed to say, but Yes. The tutorial that I found is the initial stage of my diploma, I am doing all this for the first time and for the first time I see all these operators and start these processes.