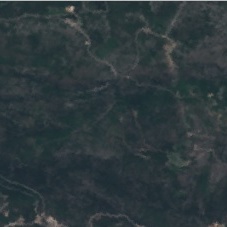
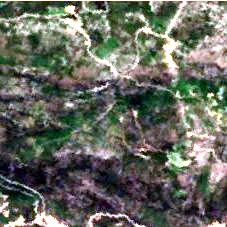
I have been cropping RBG images from sentinel 2 datasets using SNAP and QGIS in order to be tested by an algorithm that classifies the data into two categories, agricultural and non agricultural. The weird thing is that the same image gives different results if its cropped using SNAP and they are not correct. The differences of the images are visible yet i don’t understand how or why.
Also, below are the square sub-boxes of each. From 227x227 we keep their bottom right track. Specifically from 221 to 227 for columns and lines. If that is of any importance.
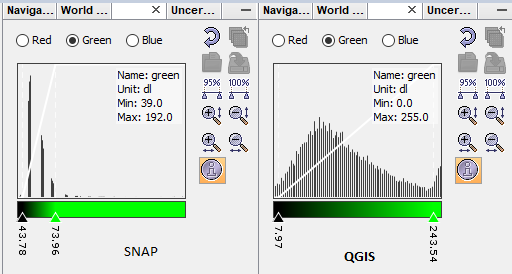
I don’t think a JPEG conserves the actual pixel values very well. As you see the data is scaled between 0 and 255 (8 bit).
Why don’t you simply use the BEAM DIMAP data directly? You find an img in the data folder which you can load in QGIS and go sure that both programs use the same information.
Actually the question was if the difference in the values of the resulting jpeg image made it harder for the algorithm to classify the images correctly.
The same product was used (from copernicus sentinel hub) to select and crop the patches. Yet the results were different.That is why i am buffled.
The use of jpeg is a requirement in the project i am working on that I cannot change.
depends on the algorithm, I’d say. A random forest, for example, works with thresholding. It doesn’t care if its scaled between 0 and 1 or between 1 and 1000. But others, especially clustering algorithms will maybe produce a different result.
Still I am worried about using JPGs for such fine-scaled objectives.
It’s difficult to answer your question without knowing how your algorithm works.
There are different approaches and formats you can use in QGIS to crop an image. It looks like you are just exporting a rendered image thus altering your original data.
If I had to do it in order to perform a later analysis I’d do it in a way that the original values were not altered so I would extract the raster without compressing or changing pixel depth. This way you would be sure that your cropping isn’t affecting the results, otherwise…you will have to check it yourself.
Raster > Extraction > Clip Raster by Mask Layer
Advanced parameters: Profile > No compression
Use input layer data type
You can test it with a .jpg but I don’t think is a good option since it is a compression format and your values might change, just manually check the pixels or perform a raster subtraction (Raster > Raster calculator) with your old and new raster and see if there are changes.
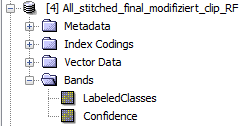
I have run the classification (Maximum Likelihood and Random Forest) in SNAP and now I want to see how good they are comparing it in QGIS. When trying to open the image it isn´t possible to extract. The screenshot shows what the program saved when saving as .dim. What should I open? I wanted to know also how you would do the postprocessing. I guess it is not possible with QGIS as I did the classification in SNAP. When doing it in QGIS with SCP-pulgin, it is possible directly with the plugin, but the SNAP classification runs better with a big sized image.
Before exporting to GeoTiff you can create a subset which only contains the band you are interested in.
And/or you can reproject the data. Then you also get rid of lat/lon bands which need to be stored in GeoTiff.
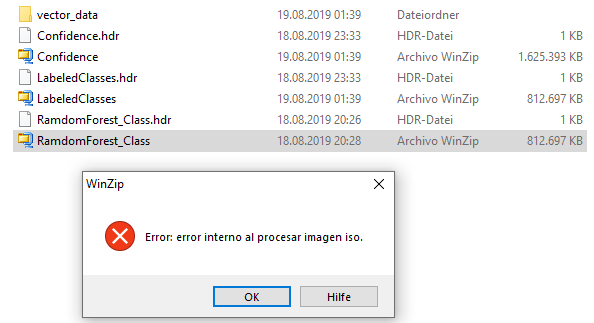
However, you can use the hdr files directly. Just drag the RamdomForest_Class.hdr (note that you have a typo) into QGIS. I guess dragging works or use the open dialog.
Double-click on the RamdomForest_Class.img is not working because it is associated with your WinZip installation.
Opening .hdr with open dialog seems to be a better solution than using GeoTiff export because QGIS is working faster. Thanks! Yet there seems to be a problem with the colour setting because I see the whole picture in red as is described here: Export from SNAP to QGIS . I can’t solve the problem as described in the response #4. I tried to import the colors (see screenshot) as I saved it in SNAP but QGIS can’t open the .cpd files.