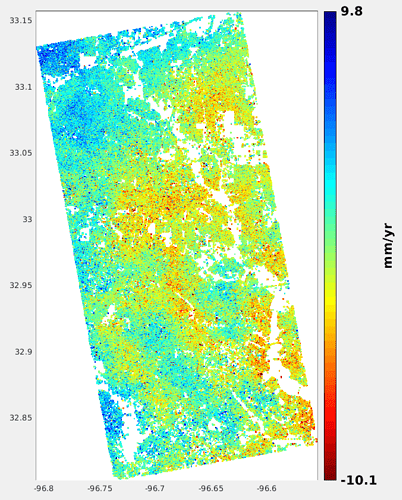
I’m pleased to report I’ve managed to obtain an end product from the finished StaMPS process (with a partial data set of 40 images; I’ll be re-attempting it now with a 120+ image set).
That is the output from running ps_plot(‘v-d’,1,0,0) after the last StaMPS step finishes, which if I’ve interpreted the manual correctly, displays mean displacement velocity at each point?
I used the latest SNAP 8 with Ubuntu 18.04 LTS (computer specs in OP) and a 32 GB ram. All processing (from start to end) was carried out on a WD easystore 8 tb external hard drive, following almost exclusively the workflow referenced here How to prepare Sentinel-1 images stack for PSI/SBAS in SNAP - #514 by thho (except I configured SNAP for python2.7 using the installer, not manually).
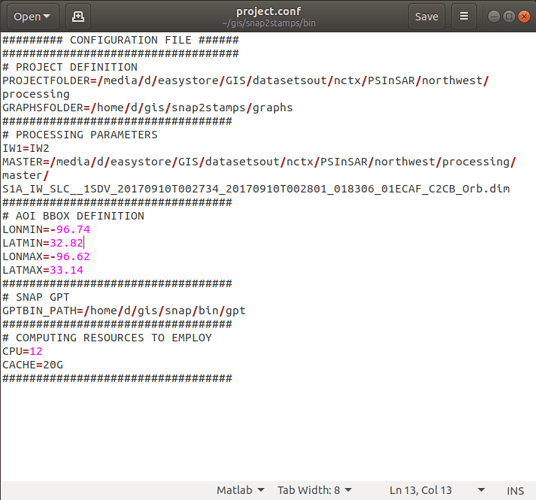
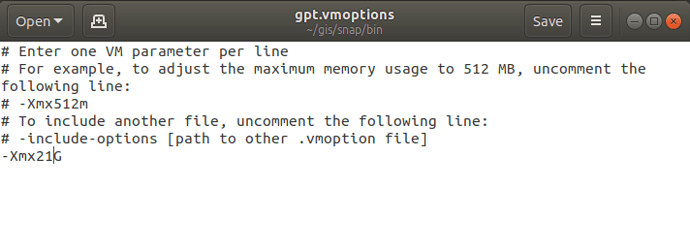
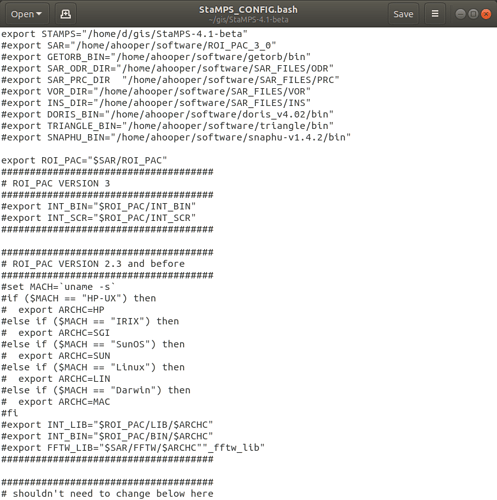
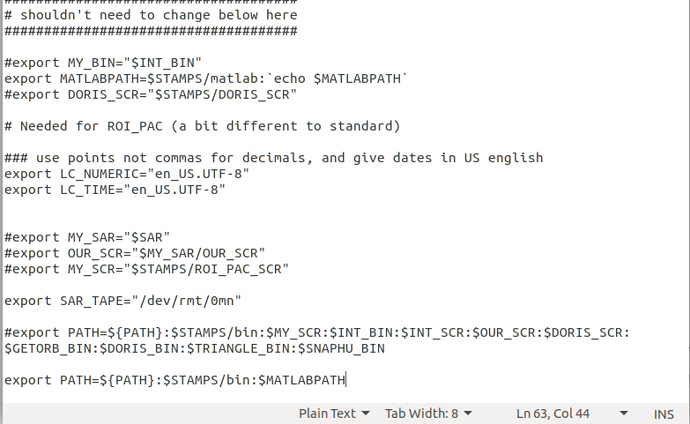
These are the project.conf, stamps_config.bash, and gpt.vmoptions files
All images were Sentinel-1a ascending; I used IW2 and three 3 bursts (still had to edit the coreg_ifg xml files, as described here How to prepare Sentinel-1 images stack for PSI/SBAS in SNAP - #514 by thho )
Thank you @mdelgado, @marpet , for providing these products which will be of great use! And thank you especially @ABraun for all the help!
Are there any further details I should look into at this point, to further validate quality?
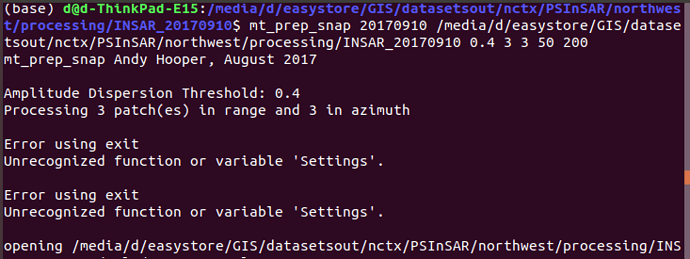
I just realized this message appeared when I ran mt_prep_snap. Any major issue?
