This depends on which approach you selected to achieve this. There is no standardized way for the extraction of soil moisture.
Please also have a look at this FAQ entry: I want to extract soil moisture from SAR data
This depends on which approach you selected to achieve this. There is no standardized way for the extraction of soil moisture.
Please also have a look at this FAQ entry: I want to extract soil moisture from SAR data
Sir I want to use method two to map soil moisture in the paper(Synergic us e of sentinel 1 and sentinel 2 soil moisture mapping at 100m resolution),…
kindly help me out, what is the next step to map soil moisture,
I don’t know this study, sorry. If you have identified the steps which are required to replicate it, we can try to help you performing them in SNAP, but you have to do the reading and the conceptualization.
So let us know at which point you struggle.
How to get Normalized Backscattered Coefficient at 30 degrees of sentinel 1 dataset.
Check the equation no. 1 and 2, how can I find the normalized backscattered at 30 degrees to calculate the SSM.
Radar > Radiometric > Calibration
produces Sigma0 which is independent from the global incidence angle.
also explained here:
Sir don’t get this point.
Kindly see the 3.1 ASAR preprocessing
The incidence angle normalization is expressed in
σ0(30) = σ0(θ )−β(θ −30◦) where
σ0(θ ) is the backscatter coefficient [dB] at incidence angle θ [◦]
σ0(30) the backscatter coefficient normalized to an incidence angle of 30◦
The angular correction coefficient β [dB/◦] is found through linear regression between θand σ0(θ ) for all the observations over an image pixel.
How can I do this on SNAP with sentinel 1 data
The above equation refers to SAR indidence angle normalization. As the incidence angle gets wider, the intensity of the backscatter drops (mainly in flat areas). So, the incidecne angle is normalized based on a single value (e.g 35 deg) which means that, it is as if the SAR image was captured under an incidence angle of 30 deg.
You need to extract the values along the sar image (from near to far range) and plot them against the intenisty values and produce a graph to derive teh coefficients
Sir, Can you please elaborate on this question? I didn’t get this point.
I want to get all the parameters of the equation through SNAP using Sentinel 1 data
Hi,
You should do the following:
The term β in the equation is the coefficient derived from the regression analysis. The term θ is the incidence angle band
Hi,
1- you mean I have to draw a line using a drawing tool in SNAP. which is starting from near range (left side of image) to far range (at the right side of the image).?
Please guide me on how to extract pixels value along with the backscatter along the line?
these things are explained in this tutorial: Synergetic use of S1 (SAR) and S2 (optical) data and use of analysis tools
We have extracted pixel values and save it in EXCEL file , now how i can make regression line and find value of coefficient
please have a look at these instructions: Add a linear regression trendline to an Excel scatter plot
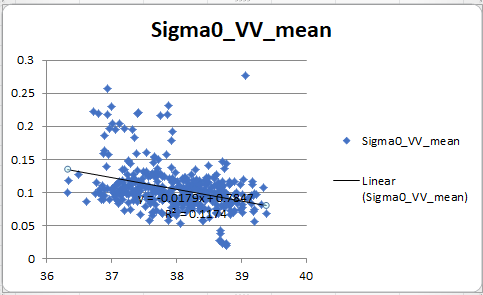
by placing incident angle value on x-axis , i got this result . how can i found coefficient value from this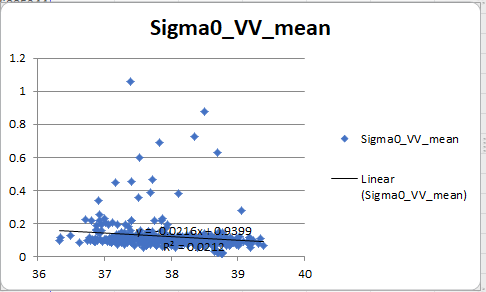
maybe you can exclude all pixels with backscatter > 0.3
This will hopefully give a larger R²
You can do this in Excel by filtering the table: https://www.businessnewsdaily.com/10057-excel-table-formatting-and-filtering.html
I still see little correlation. Did the study you refer to maybe work with db scaled data?
@johngan shouldn’t do calibration to Sigma0 reduce the impacts caused by incidence angle variations?
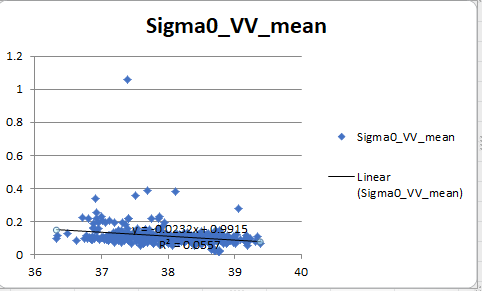
here is quite more correlation , so how can i calculate coefficient from this and calibration is already applied on sigma0 value