Thanks you Sir
What difference of Mean and Sigma
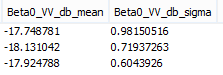
Which of the scattering is used for the correlative plot?
Regards
Thanks you Sir
What difference of Mean and Sigma
Which of the scattering is used for the correlative plot?
Regards
you take the mean for the scatter plot. The sigma stands for the standard variation (how much the data varies within each polygon).
Thank you Sir.
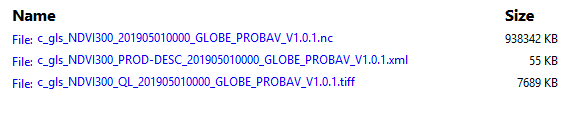
I found NDVI ( https://land.copernicus.eu/global/themes/Vegetation) in my study area
How do I overlay these backscatter image with a Surface cover image Sir?
Visually in the layer manager.
For quantitative analyses in a stack using the pin manager.
Which type of data format can I use to layer manager Sir?
Regards
probably only the nc file contains data, the xml is just meta-information and the tiff file looks like a qualit flag. Please have a look in the documentation of the dataset. It is mostly well described what is contained in the data and how to use it.
Thank you Sir,
How can i convert result of Soil Moisture Mapping to geojson format? I want to make this map to database and show in web server
Regard
geojson is a vector format. I don’t know your data but soil moisture sounds like continuous raster data. A simple conversion to polygons will probably produce an unnecessarily large polygon file. Maybe your web server also supports raster display?
Yes Sir, Soil Moisture is continuous raster data. But my web server only support vector format. So I want to convert from raster to vector (geojson / json). What can i do Sir?
Regards
you could aggregate your moisture data into evenly distributed classes. This would make it possible to convert them into polygons. Otherwise it makes no sense to me.
Something like this
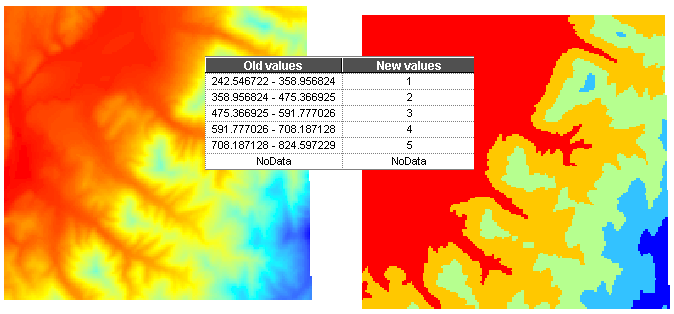
source: http://geology.wlu.edu/harbor/geol260/lecture_notes/notes_spatial2b.html
Depending on the size of your area, you could also consider converting the pixels to points, and then the points to geojson. But this can also lead to excessive file sizes very quick.
This process using SNAP or another software Sir?
re-classification in SNAP is complicated, but can be done in the band maths. Something like this.
IF soil_moisture < 10 THEN 1 ELSE
IF soil_moisture >= 10 AND soil_moisture < 20 THEN 2 ELSE
IF soil_moisture >= 20 AND soil_moisture < 30 THEN 3 ELSE
IF soil_moisture >= 30 AND soil_moisture < 40 THEN 4 ELSE
IF soil_moisture >= 40 AND soil_moisture < THEN 5
I recommen doing it in a GIS software for faster processing, e.g. QGIS: https://geogeek.xyz/reclassification-of-a-raster-in-qgis-3.html
Hello Sir,
I export product from SNAP after terrain correction with Coordinate Reference System (CRS): EPSG 3857 to geotiff format. But when i import to QGIS with CRS EPSG 3857, it’s different coordinate.
What can i do to make same coordinate?
How do you import it into QGIS?
export into geotiff format in SNAP, and than load raster in QGIS sir
Then have a look at the layer properties in QGIS and make sure that CRS EPSG 3857 is assigned to the data
I’ve done it, but the coordinates still differ
Hi Andiray, it seems to me that you have advanced a lot, with the learning curve you have taken you can make a step-by-step tutorial of what you have learned with the advice received here from people and share that tutorial? Thank you
Hi @EddisonJose, I’m sorry for the long reply. I still need to learn more in this. But I will try to help if I know.
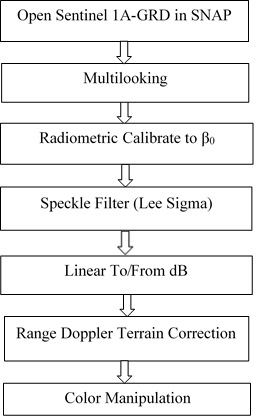
@EddisonJose, My research is only for soil moisture mapping and using Sentinel-1A. The steps to get backscattering coefficient are:
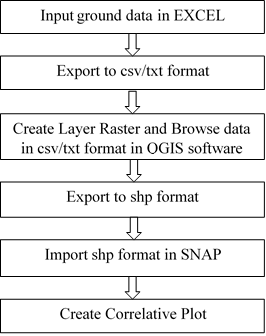
And the steps to validating with ground data are:
Regard