Hello @thho , thank you for sharing the StaMPS-Visualizer with us. It is very useful!
I had a question regarding the csv file. I understand that [2:nrow, 4:ncol] are the displacement values of the measurement points. Are the values showing change in displacement with reference to the master image or are they showing the change in displacement corresponding to the first date in the series?
I believe they show the change in reference to the master image but I wanted to confirm it.
Thank you for your reply, @thho . It was a lot to scroll to that point so I missed it initially. @ABraun was right. There is so much info in this thread itself that sometimes gems like this get lost. Great tool by the way!
@Rejoicet, true, this thread became far to long over time and when you do not know that something has already been discussed here, your chance finding it is pretty low even when searching for key words.
Nice to hear that you enjoy the Visualizer, its fun to get back to it from time to time to think about its features and adapt the initial design to learn more dashboard stuff … and the its limitations … well and css
hello @ABraun@thho , is there any way to obtain a map of coherence values for each pixel along the field of study throug the years?
This could give an idea of which points with the displacement information are more reliable over others and then be able to filter them in a post process.
I have a question I hope you may be able to assist with.
The export of time series provides mean velocity (mm/yr) for each PS. Is this velocity derived from linear regression of the time series?
Then let us assume a PS has perfectly linear change in position through time (e.g. controlled experiment with corner reflector). In theory, the line of best fit should pass directly through each point in the series, and the standard deviation will be zero. In practice, what is the expected standard deviation for this time series (i.e. how much scatter will be in the time series from measurement error alone)? Perhaps 2 mm/year?
I ask because I have some noisy time series with large standard deviations (up to 5 - 10 mm/year). I think this noise may be real ground motion (i.e. high frequency up/down motion of an unstable surface), NOT error of the measurement/method.
tbh I have never worked with corner reflectors in a controlled environment, thus I do not know a “normal” amplitude of the standard deviation.
For me, velocity is a good proxy to find points with a stable trend but for points that follow a cyclic trend, velocity can be 0 even when there is movement (I think this is more or less what you said). The precise calculation of velocity is not entirely clear to me. One way to do it is simply calculating the absolute difference between the first and last point of your time series and the duration of your time series to derive the velocity…however, as discussed before, this approach obscures everything else what is happening in your interval…
In your case, it would be interesting to know how stable a point can be, maybe you have another stable point in your scene to compare with? If not and you have the hypothesis that the changes come from real displacement, you most probably have to look for data that helps to argue for your hypothesis or debunk it. For example, if the area is over a ground water reservoir maybe you can find data of its fill level etc.
Sorry that I can not contribute to the question about the assumable standard deviation. However if you have a good source that investigates the time series of stable corner reflectors, I am interested in hearing about it
Thanks Thorsten. I found a stable area as you suggested, with many PS having almost perfect linear fit (r2 value close to 1). This tells me StaMPS is very precise method, and the noisy time series in other locations is due to real noisy ground motion. Interesting.
I confirmed this by checking a continuous GNSS monitoring in the area, which also showed a noisy signal. The noise is real!
This has implications for conventional levelling surveys in this area, which report mean annual motions (mm/yr), based on only two measurements at a benchmark; StaMPS will be far superior indication of mean annual motion because the time series have many points (> 20 per time series).
@thho, Hello, I have a question to ask you. I hope I can export the PS points to the pixel coordinates of the interferogram, instead of the longitude and latitude. Is there any way?
I think that should be possible, but you have to explore the matrices in Matlab. With the provided script it is not directly possible, but I think the script is a good starting point to look for the right objects which are generated by StaMPS in Matlab.
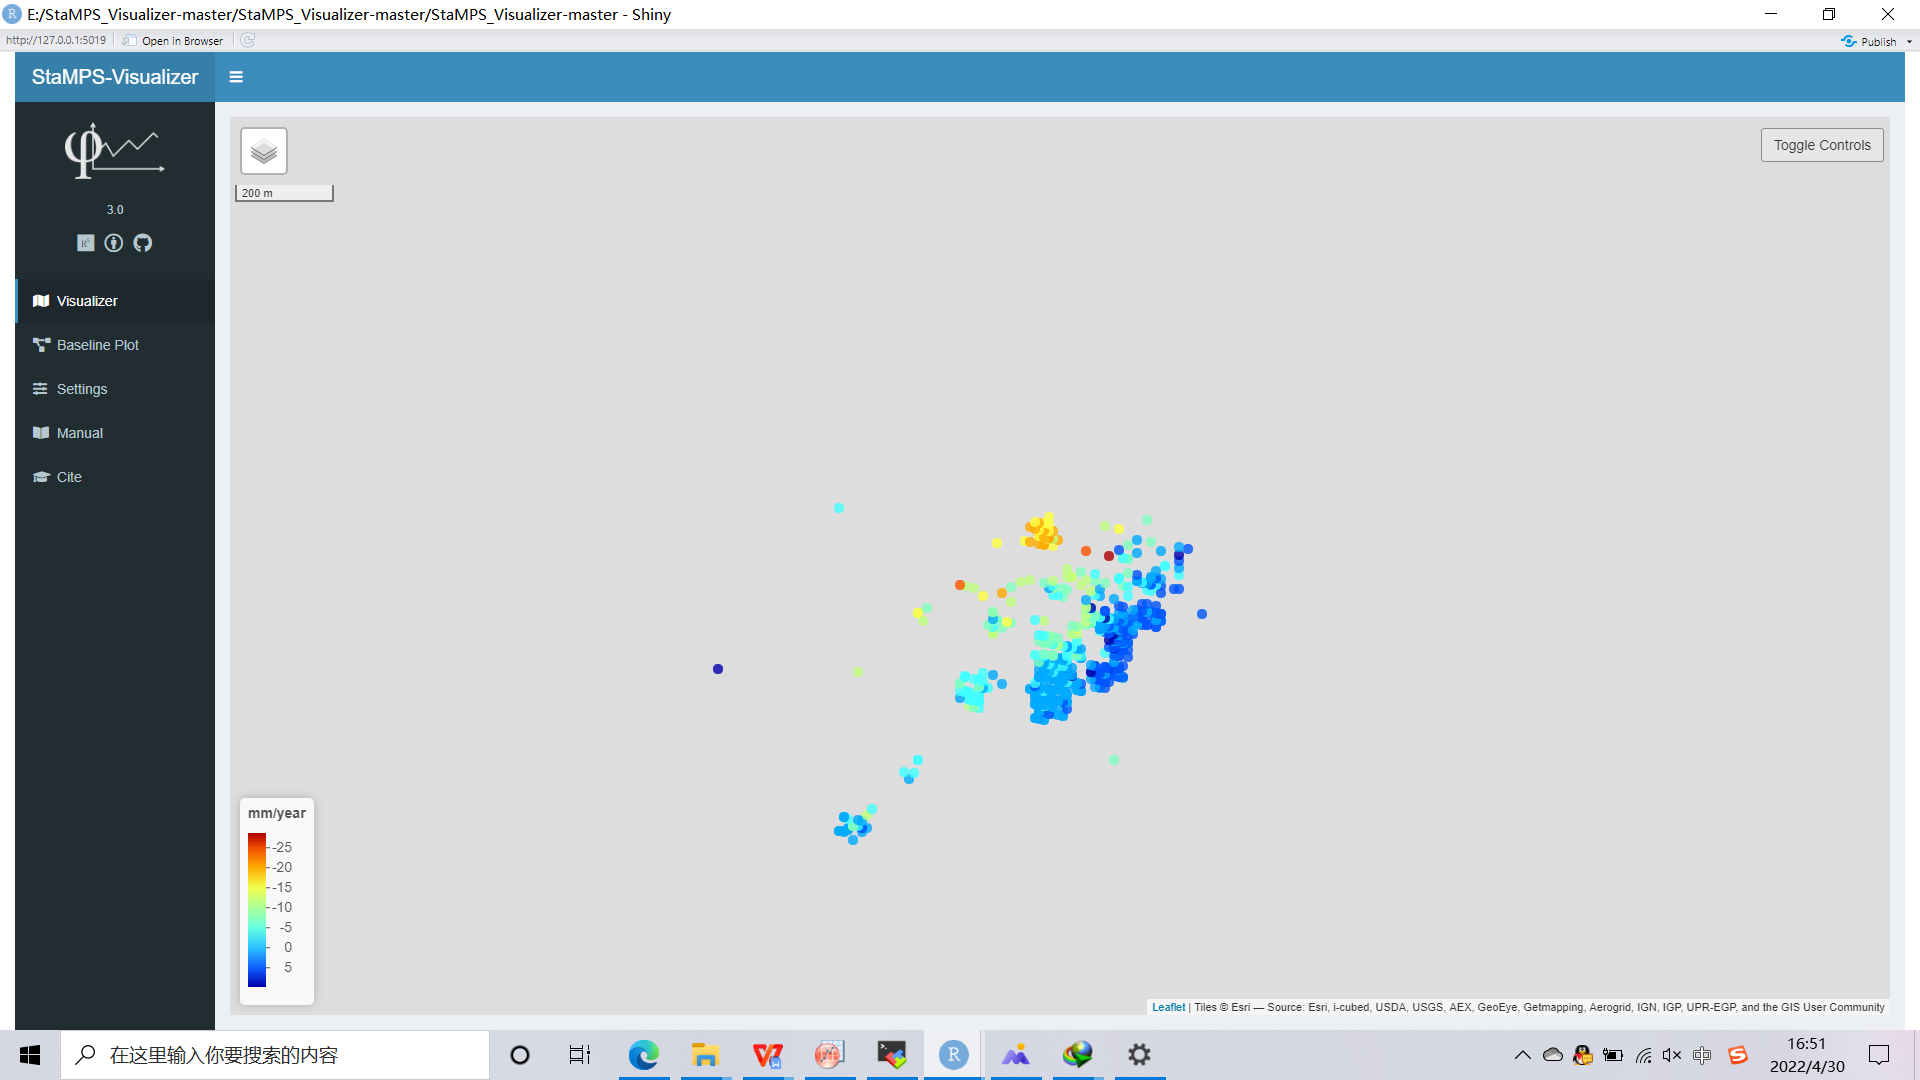
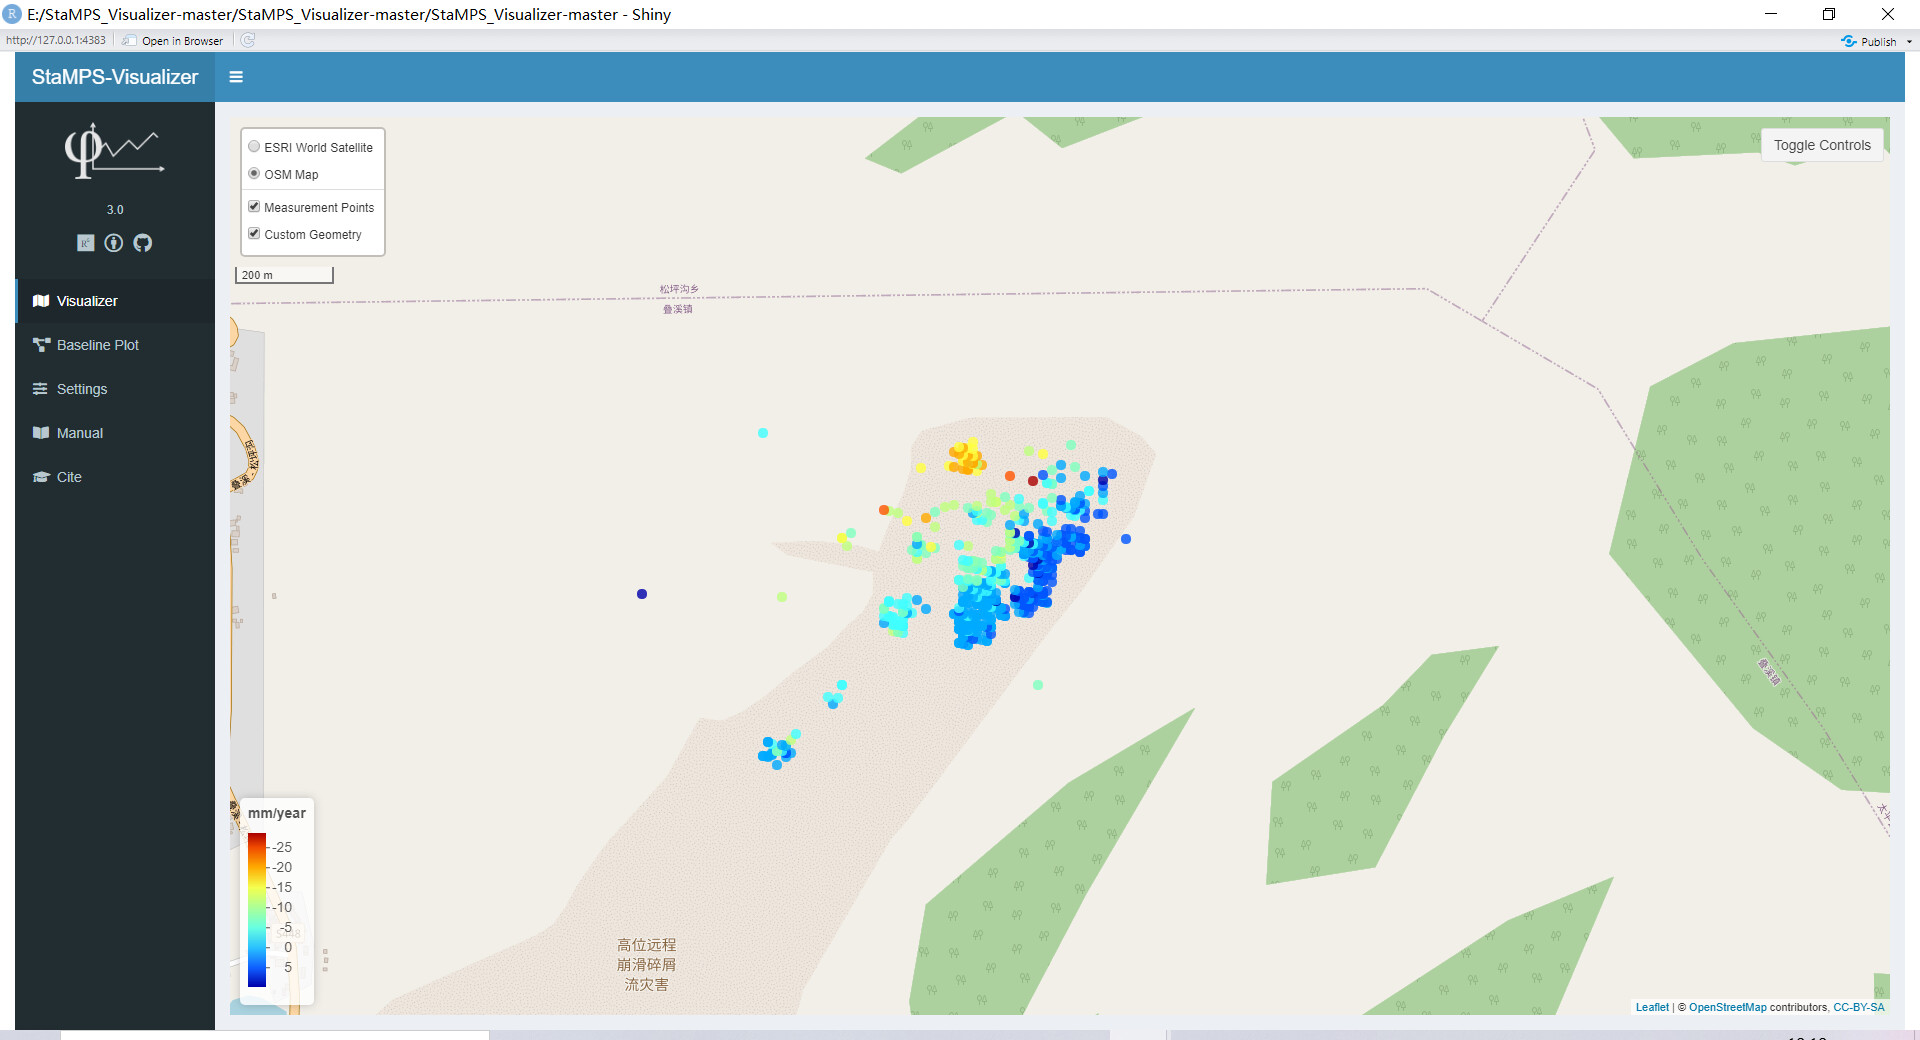
switch to the OSM base map (upper left corner open the layer menu) tell me if this works, then we know that it is not your network or something but related to the ESRI WMS
Are you in a network which IP might be problematic? From other users reports, ESRI WMS is blocking IPs from Iran, and sometimes the ESRI WMS is out of service for some IPs from institutions when the terms of use are violated (like using the WMS for scraping high res data). If possible, try to use a VPN, that helped every single time this problem came up
hi@thho
Thank you for your reply.
I have been using StaMPS-Visualizer for about a week and he is fine. One day I opened it and I couldn’t see the satellite image,but I can use OSM map.I tried using a VPN but nothing changed.
Hi @yan, thanks for providing more information. However, I am not able to reproduce the error, neither on a recently set up test instance, neither on my day-to-day system, the ESRI WMS works fine for me.
There must be something on your side what is blocking access to the ESRI WMS, what happens when you visit this link:
Another thing you can try is to click the Open in Browser button in the upper left corner of the RStudio window, maybe something isn’t working here but since OSM is rendered, I doubt that.
If nothings is working out for you check these lines in the code of the visualizer, they provide some information how to include other WMS which show high res satellite imagery:
hi@thho
Thank you very much for your help.When I changed a VPN tool, it worked.It’s true that my vpn is faulty.StaMPS-Visualizer is a very handy tool with perfect functionality.
 have a look at this post, it explains also the subtract offset button in more detail: