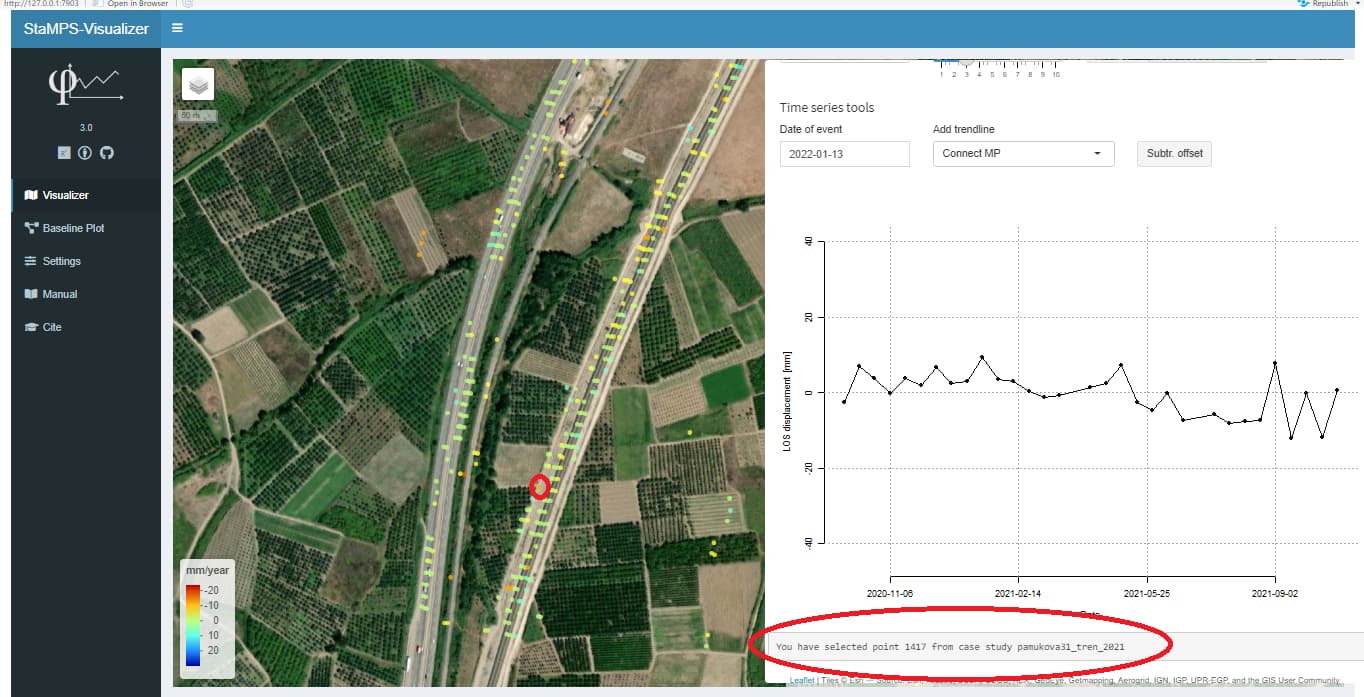
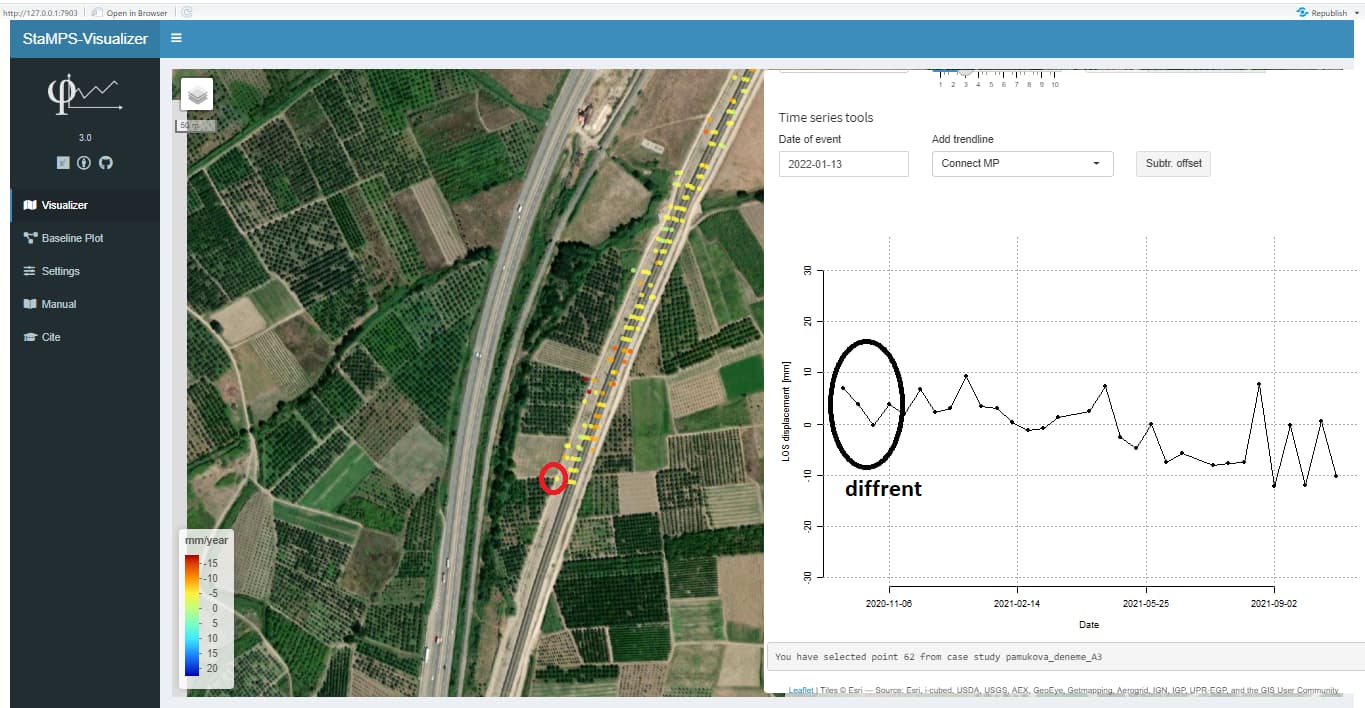
İ have a case study about railway subsidance. I created a dataset for my area. But i want to use PSI points for specific area. So that i clean my master .csv file with global mapper and export it again. When i opende it with visualizar i saw some intersting things. My master.csv file and seperase.csv file have the same value but visualizar dosent show the same value with the same points. Do you have any idea about this problem?
No thho they are the same points. I make this compartion many points and i tool same results. Do you have time to look csv files in visualizer? I think you can understand me better.
both have the same coordinate, but different displacement time series and also velocities…the visualizer presents booth tables correctly…if the one is really a subset of the other, than something went wrong during subsetting. The visualizer does not perform any data wrangling, it builds the spatial object by indexing entire rows, since a missmatch of location and time series can not happen.
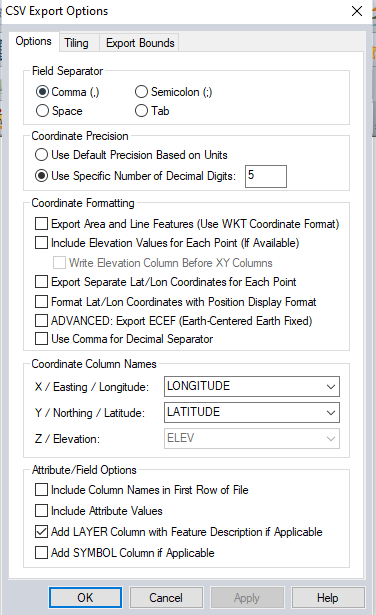
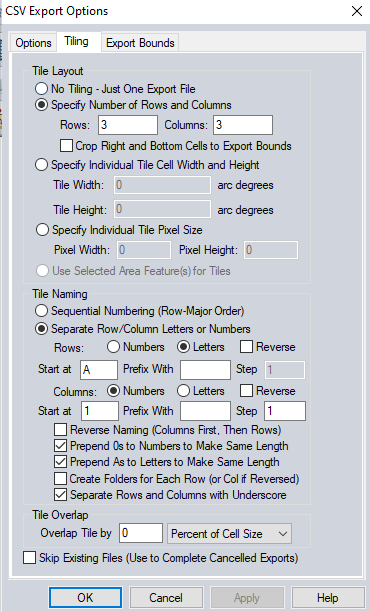
Can you provide more insights in what the global mapper does during the subset, I am not familiar with the software
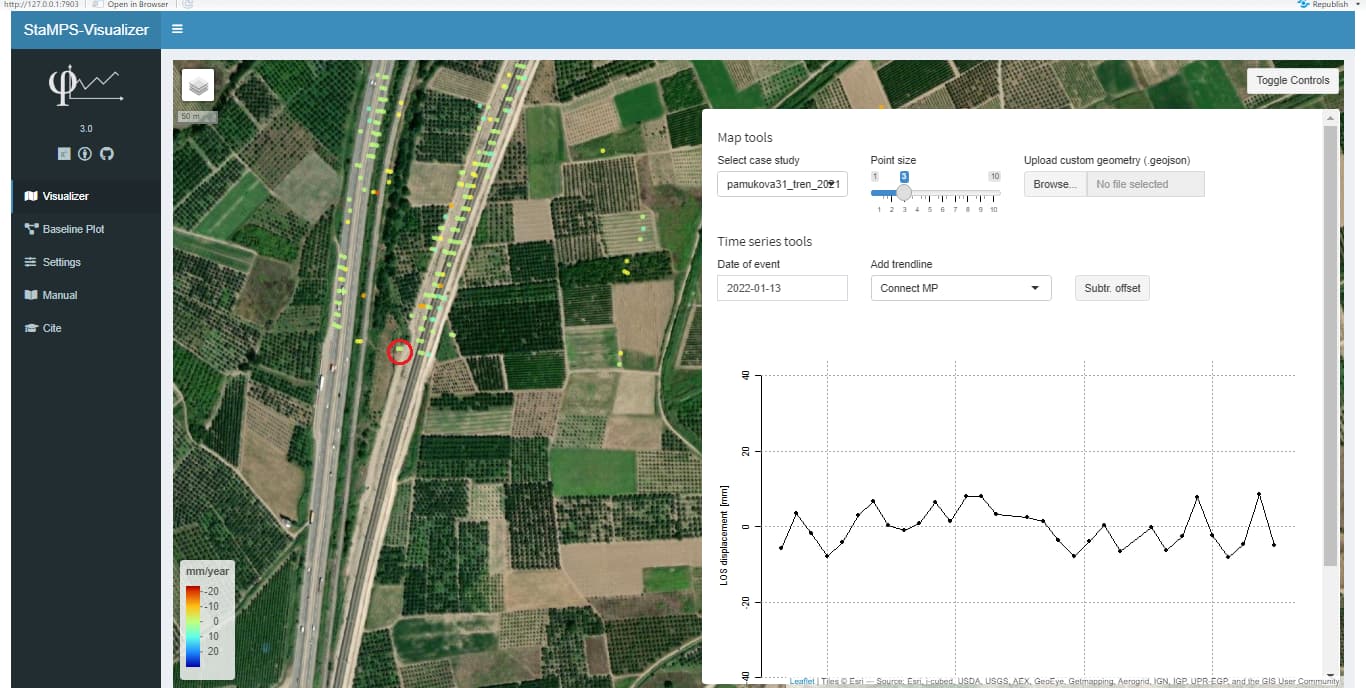
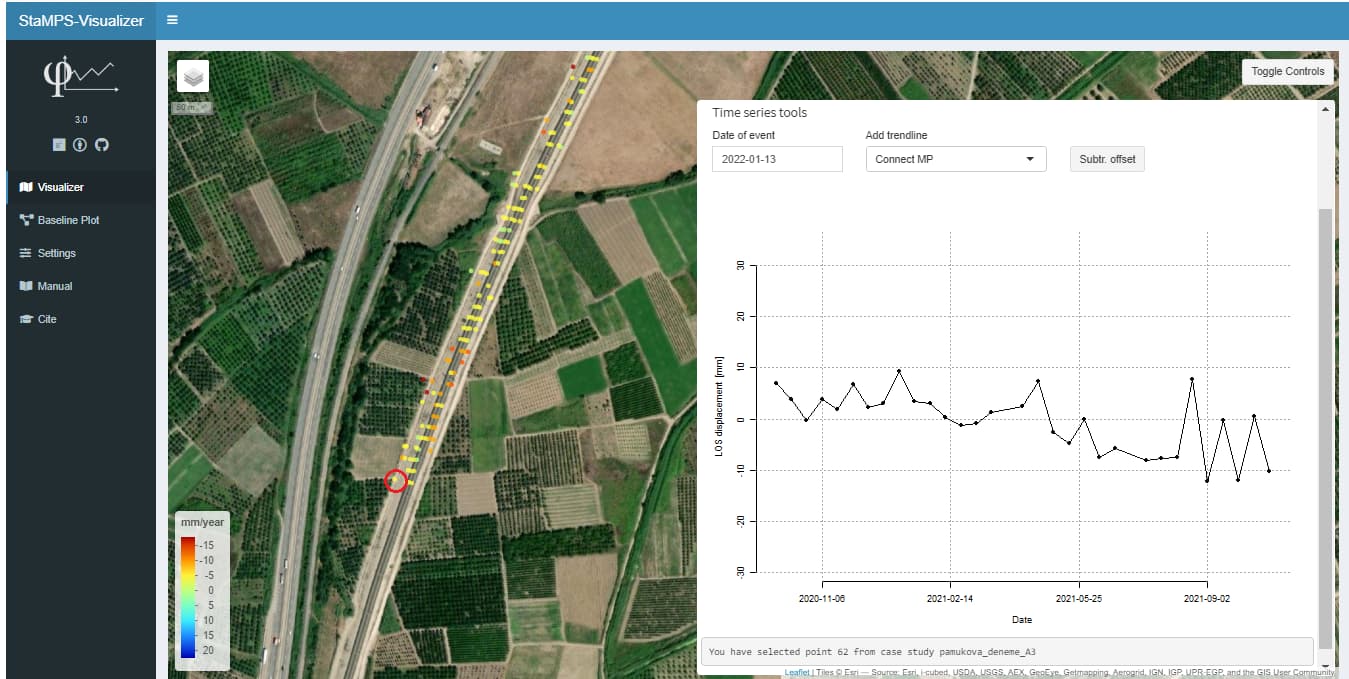
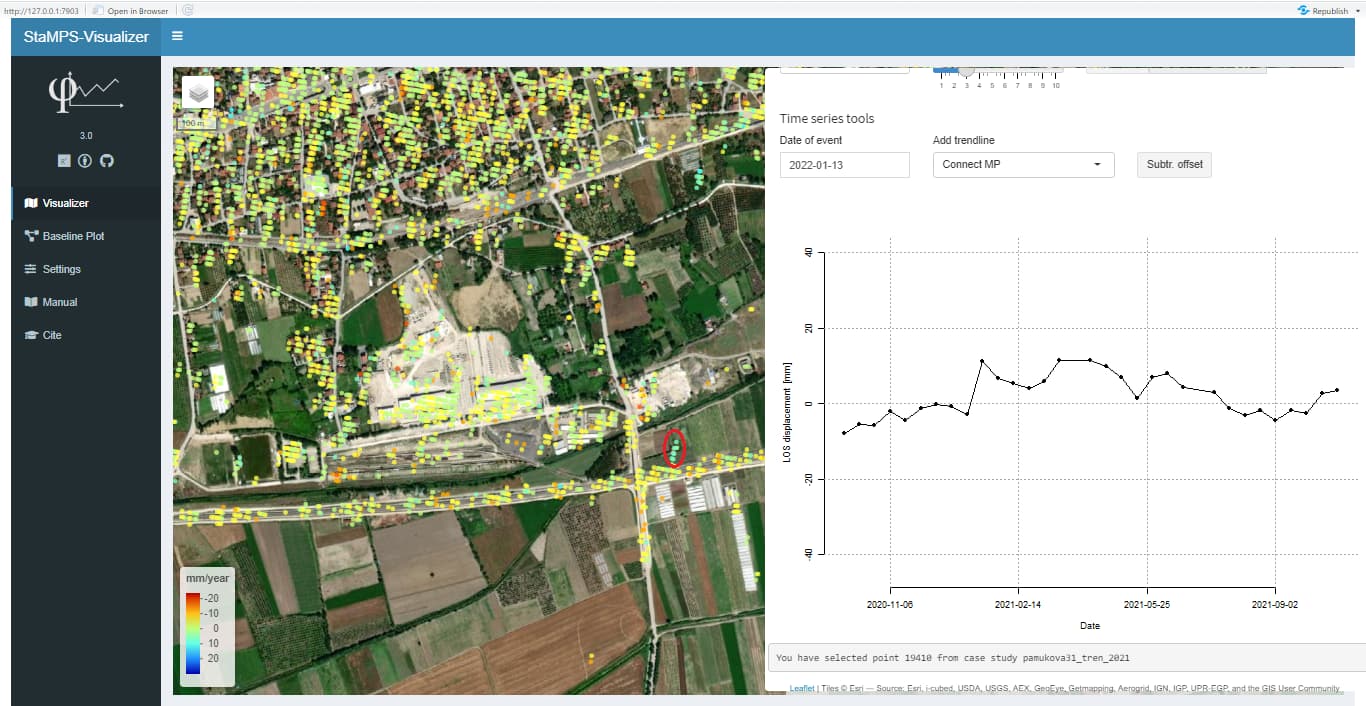
@suat, my last reply remains valid also for your corrected example. The tables are correctly visualized, but within the tables the time series differ. You can check this yourself, after you have selected a point, under the time series plot the info of the point index is given. This number + 2 corresponse with the row in the csv table. so for your updated example these are:
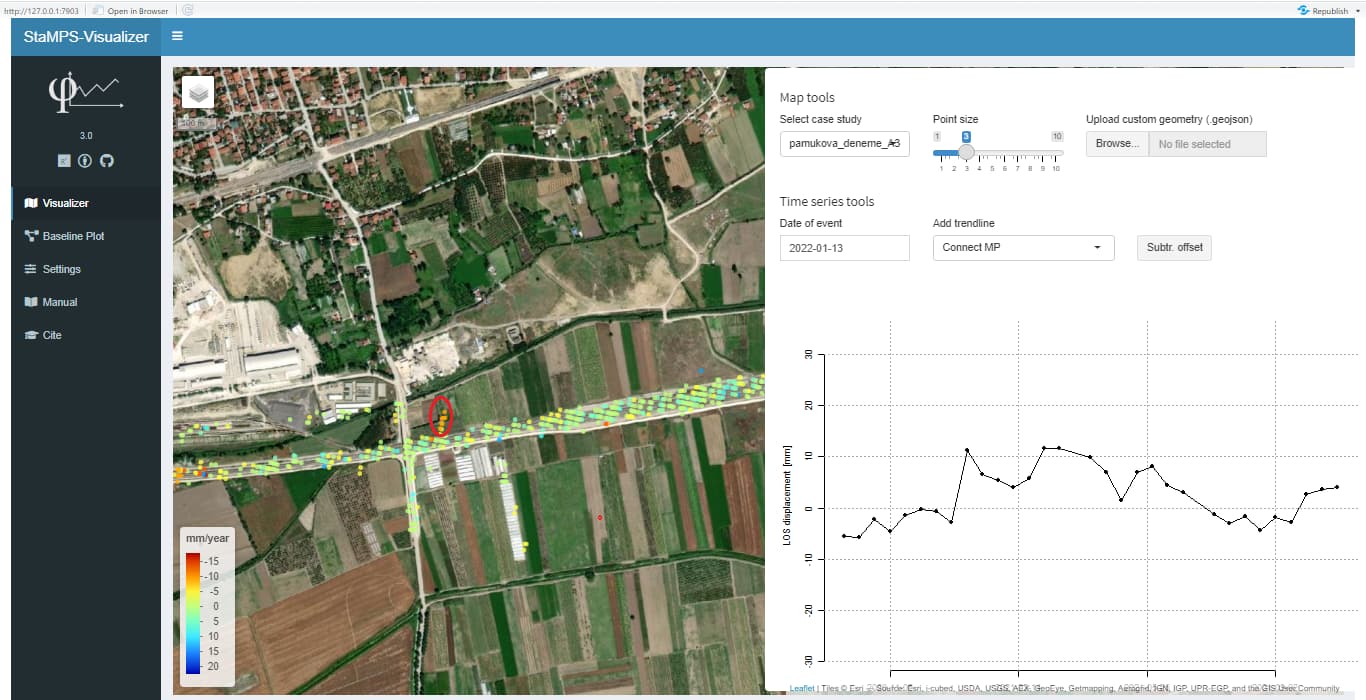
look, the subset takes the velocity (column three in master) and puts it at the end…thus the visualizer gets a wrong table…the table should have the velocity in column 3 but in your subset it is the last column, that way everything is different when you visualize it.
haha that was tricky, but it shouldn’t be so hard to fix it
Hello @thho , thank you for sharing the StaMPS-Visualizer with us. It is very useful!
I had a question regarding the csv file. I understand that [2:nrow, 4:ncol] are the displacement values of the measurement points. Are the values showing change in displacement with reference to the master image or are they showing the change in displacement corresponding to the first date in the series?
I believe they show the change in reference to the master image but I wanted to confirm it.
Thank you for your reply, @thho . It was a lot to scroll to that point so I missed it initially. @ABraun was right. There is so much info in this thread itself that sometimes gems like this get lost. Great tool by the way!
@Rejoicet, true, this thread became far to long over time and when you do not know that something has already been discussed here, your chance finding it is pretty low even when searching for key words.
Nice to hear that you enjoy the Visualizer, its fun to get back to it from time to time to think about its features and adapt the initial design to learn more dashboard stuff … and the its limitations … well and css
hello @ABraun@thho , is there any way to obtain a map of coherence values for each pixel along the field of study throug the years?
This could give an idea of which points with the displacement information are more reliable over others and then be able to filter them in a post process.
I have a question I hope you may be able to assist with.
The export of time series provides mean velocity (mm/yr) for each PS. Is this velocity derived from linear regression of the time series?
Then let us assume a PS has perfectly linear change in position through time (e.g. controlled experiment with corner reflector). In theory, the line of best fit should pass directly through each point in the series, and the standard deviation will be zero. In practice, what is the expected standard deviation for this time series (i.e. how much scatter will be in the time series from measurement error alone)? Perhaps 2 mm/year?
I ask because I have some noisy time series with large standard deviations (up to 5 - 10 mm/year). I think this noise may be real ground motion (i.e. high frequency up/down motion of an unstable surface), NOT error of the measurement/method.
tbh I have never worked with corner reflectors in a controlled environment, thus I do not know a “normal” amplitude of the standard deviation.
For me, velocity is a good proxy to find points with a stable trend but for points that follow a cyclic trend, velocity can be 0 even when there is movement (I think this is more or less what you said). The precise calculation of velocity is not entirely clear to me. One way to do it is simply calculating the absolute difference between the first and last point of your time series and the duration of your time series to derive the velocity…however, as discussed before, this approach obscures everything else what is happening in your interval…
In your case, it would be interesting to know how stable a point can be, maybe you have another stable point in your scene to compare with? If not and you have the hypothesis that the changes come from real displacement, you most probably have to look for data that helps to argue for your hypothesis or debunk it. For example, if the area is over a ground water reservoir maybe you can find data of its fill level etc.
Sorry that I can not contribute to the question about the assumable standard deviation. However if you have a good source that investigates the time series of stable corner reflectors, I am interested in hearing about it


 … and the its limitations … well and css