StaMPS-Visualizer, SNAP-StaMPS Workflow

@mdelgado @ABraun @thho and @volkan Thanks a lot, I overcame the technical issues (NOT ALL) AT LEAST TO run SNAP-StaMPS, reaching the final step without changing any parameters are highly recommended and then we could create other start focusing on the nature of study,

1 Like

Hi @abraun,

I downloaded the file (Quetta_45000m_134_CSV.csv) and made it shp, but It is not working too. I tried many times many alternatives but did not succeed. What is the version number of QGIS and PS Time Series you are using?

currently QGIS 3.6 but it also worked with 3.2 and 3.4. Time-series plugin 0.3.1

Hi Andy,
Would you please to explain more, what kind of

I took a look at your .csv file, but I stacked at this point, Since I have large file 771 MB, I copied a small cells, as below,

Line 2 is your date, it just needs to be formatted as such and D needs to be placed before it. You can set this in the user defined date format in MS Excel.
I created a new line with the formatted date and skipped the first two lines upon import in QGIS

I uploaded an example: Quetta_45000m_134_XLSX.xlsx (1.6 MB)

2 Likes

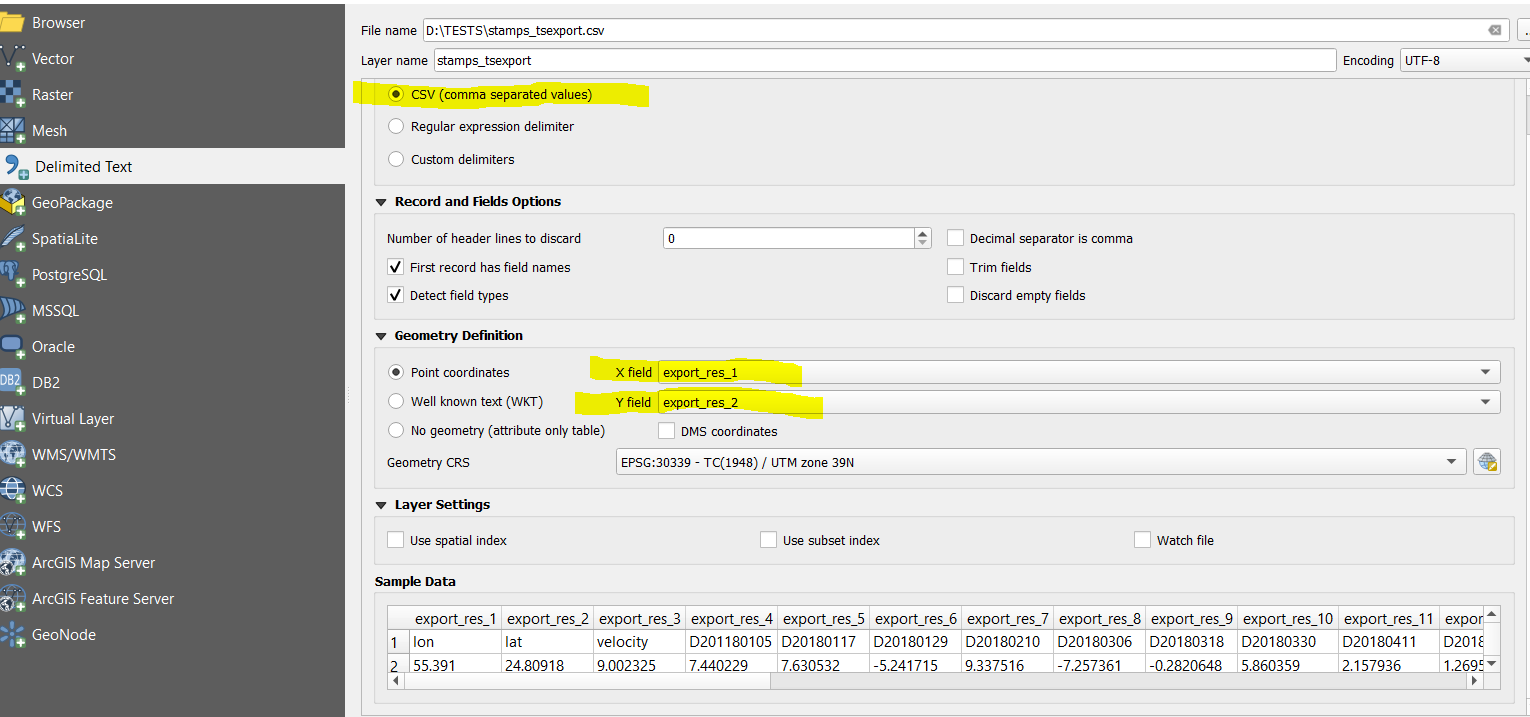
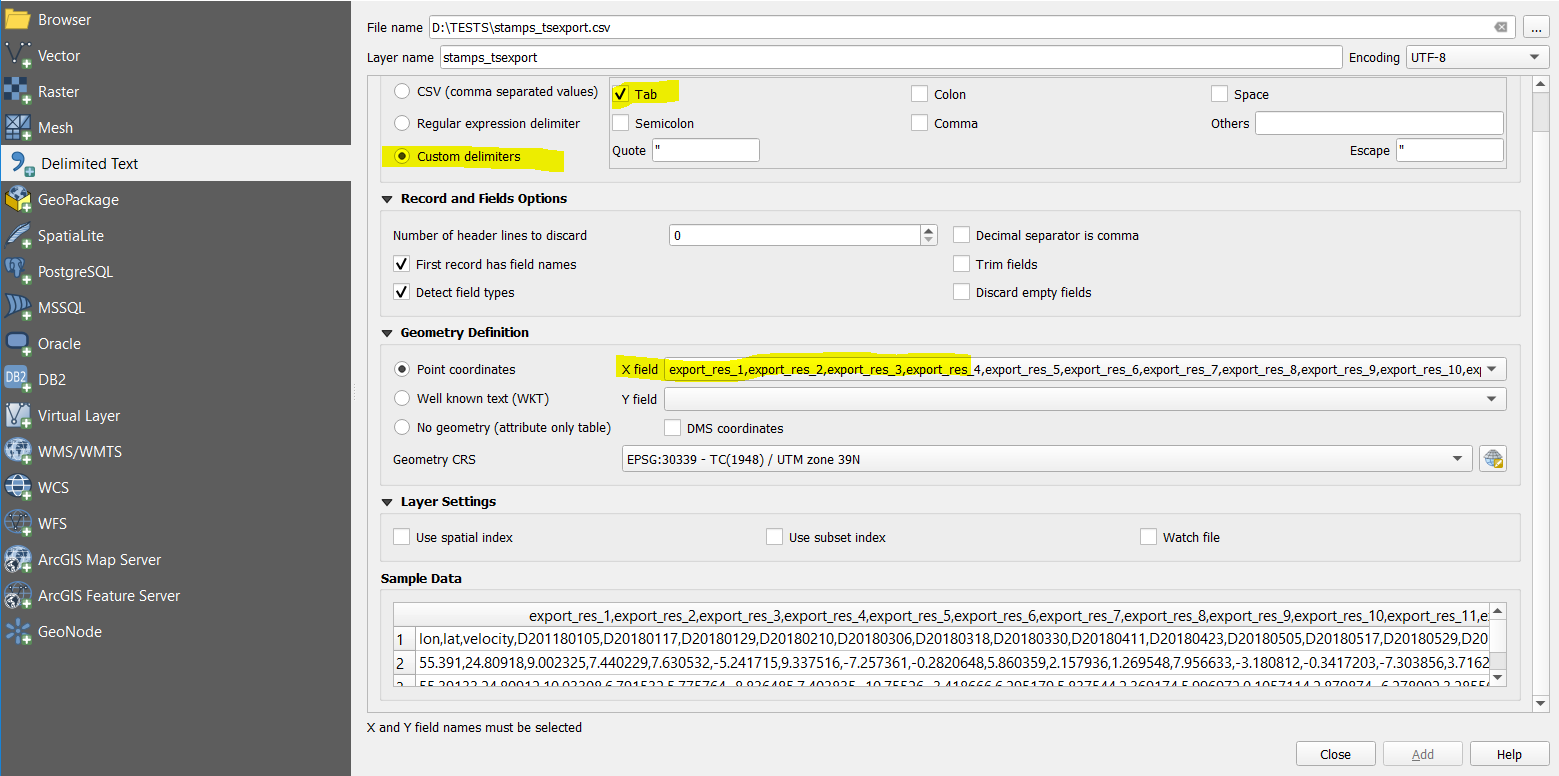
Which one to choose in order to import in QGIS, and identify the lon and lat, because in both cases I couldn’t add the x,y field, because it reads the first line only,

Also when add up them by removing the first line the time series plugin says that there is no ts to read,

increase the “number of header lines to discard” so lat/lon become column names.
CSV is the correct import type.

1 Like

This is wonderful! Thank you! Also, in your Cite Section it’s “absolutely no warranty” not warrenty :wink:

1 Like

ha, nice :slight_smile: new git push in a few minutes

Hi @ABraun,

I can’t solve the shapefile issue. I tried a lot of time during the passed time with different pc and different versions of programs (from exported csv to working shapefile in qgis). I know that the request is very big and very exhausting but can you share step by step screenshots or a video? Thank you.

I am sorry to hear that. To be honest, I tried your CSV file and couldn’t get it to work either. Something in there is different from the ones that worked for me but I did not find it yet.

Using the time series viewer gives me this message, anything wrong with my shp,

image

The other problem is, the layer before and after export it as shp. doesn’t lay over google satellite base map in QGIS,

This is an example of the CSV file,

Example.csv (91.0 KB)

please have a look at my example and compare where it could be different.

Are the points correct when imported as a CSV?

What do you mean? I didn’t get your point,

you say the points are dislocated after exporting them as a shapefile. So were they at the correct location initially (after you loaded them as delimited text layer)?

No, they weren’t, I guess, you want to say, that the problem is occurred while exporting the points to .CSV using StaMps visualizer, Or not?

I don’t know where the problem occured.
`Do you want to share your CSV?

Yes sure, but it is 318 MB, after creating zip file, how it is possible to share it?

that is strange, it should be way smaller actually.