Hello @ttho,
we choose a pixel and set a radius after the ps_plot('v-doa', 'ts') command. I wonder if there is a way to choose a pixel and radius by a command?
Hello @ttho,
we choose a pixel and set a radius after the ps_plot('v-doa', 'ts') command. I wonder if there is a way to choose a pixel and radius by a command?
Hi @volkan, pretty sure that it is possible to directly pass those information to the ts plot function, I will have a look at it during my next time working on the app, apparently that could take some time, so if you find the part in the Matlab script, let me know 
I tried to format the CSV file but did not success. Do you have a sample CSV file not translated to shapefile?
Sample shapefile’s attribute table has not coordinate information. This is another confusing point.
this worked for me:
Quetta_45000m_134_CSV.csv (1.5 MB)
I simply skipped the first two rows in QGIS. lat/lon coordinates were exported by the script given by thho
Kitap1.csv (17.1 KB)
Is there any problem my CSV file? I import as point and then convert to shapefile. It is not working.
Hi @thho,
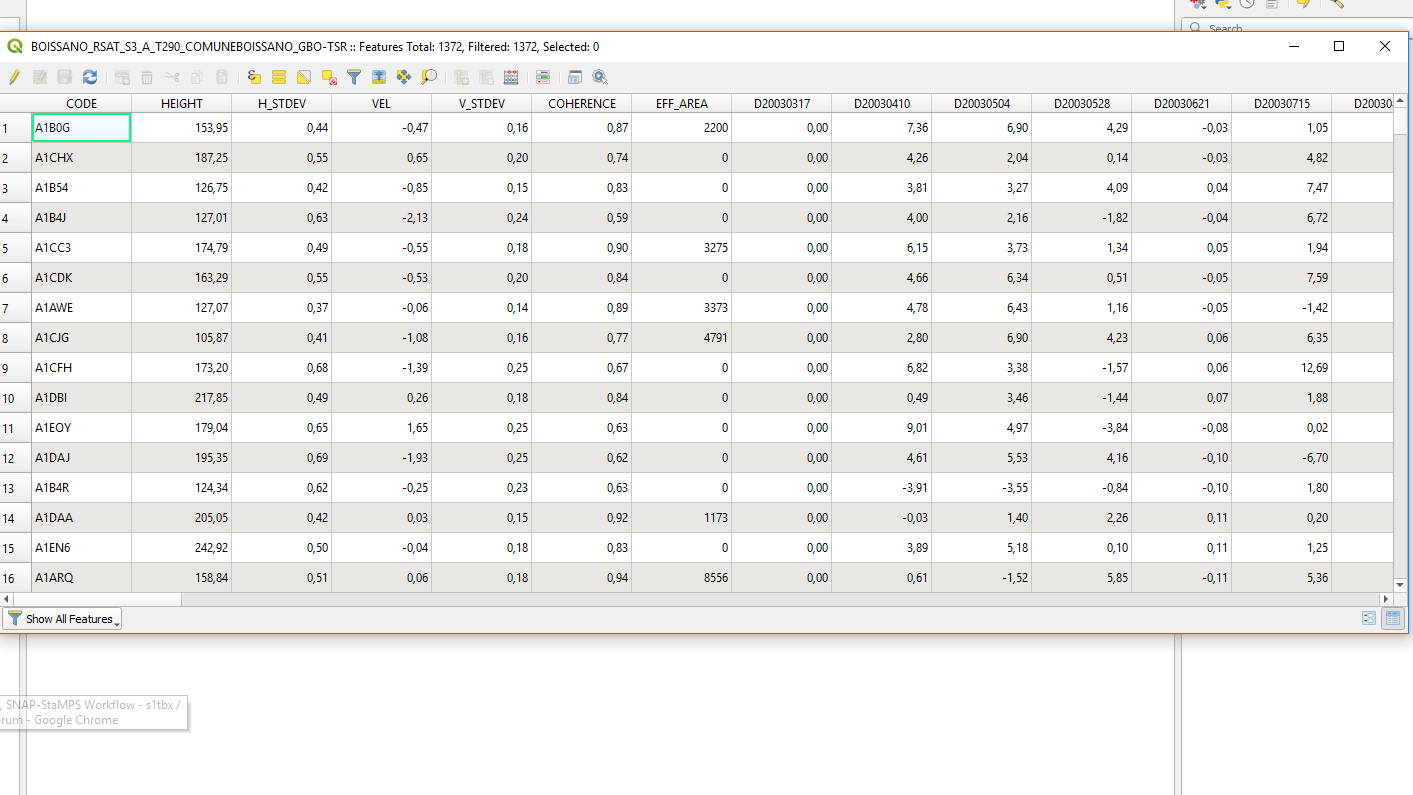
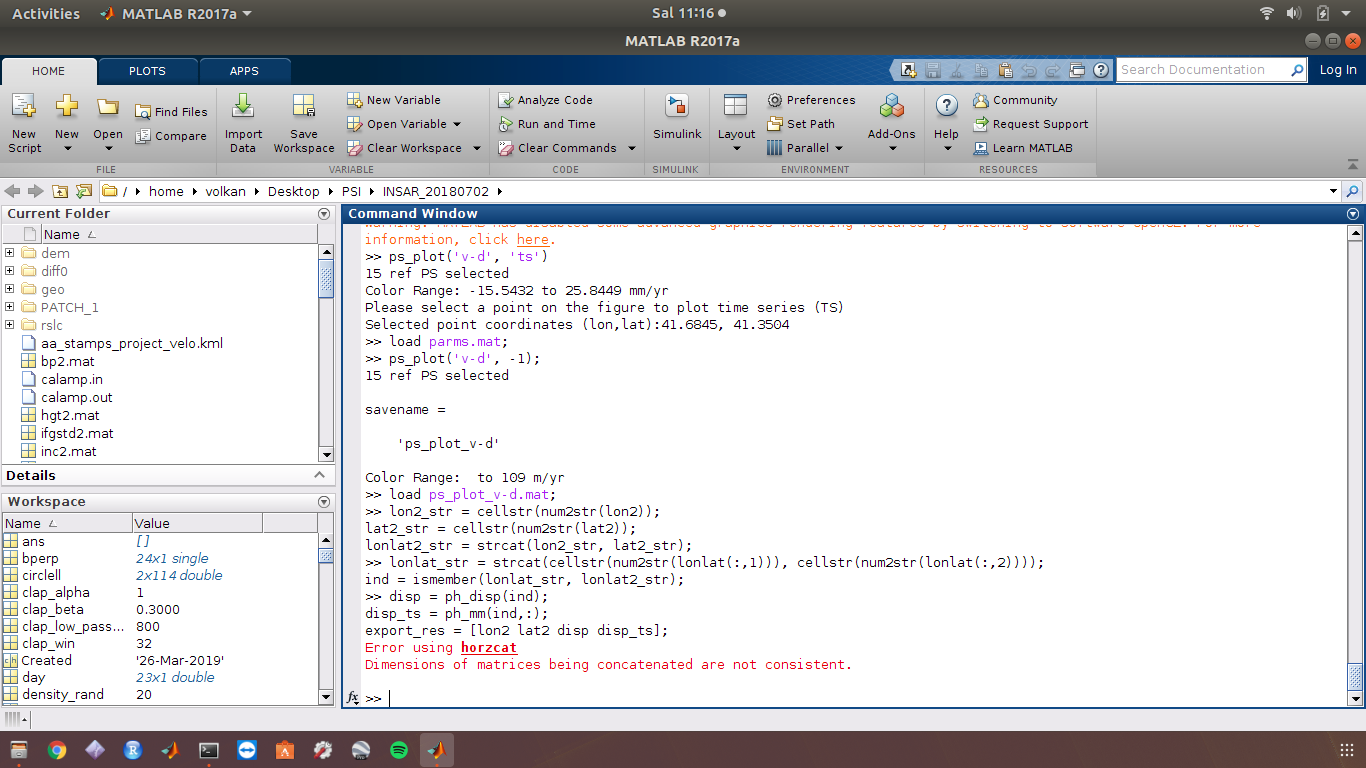
disp = ph_disp(ind);
disp_ts = ph_mm(ind,:);
export_res = [lon2 lat2 disp disp_ts];
after these command, I get an error.
I think It is about the radius we set after the ps_plot('v-doa', 'ts'); command.
In the manual’s Troubleshooting section, there is a solution way given below.
If there is a high density of MP (measurement points) sometimes an error occurs like horzcat matrix is not consist with each other . To avoid this error, make a new ts plot and select a very large search radius which includes all MP, export this csv table and use the following R script and a .kml polygon which is describes your region of interest to subset the table afterwards.
At this point, after I make a new TS Plot and select a large radius, how can I export the CSV table? Thank you.
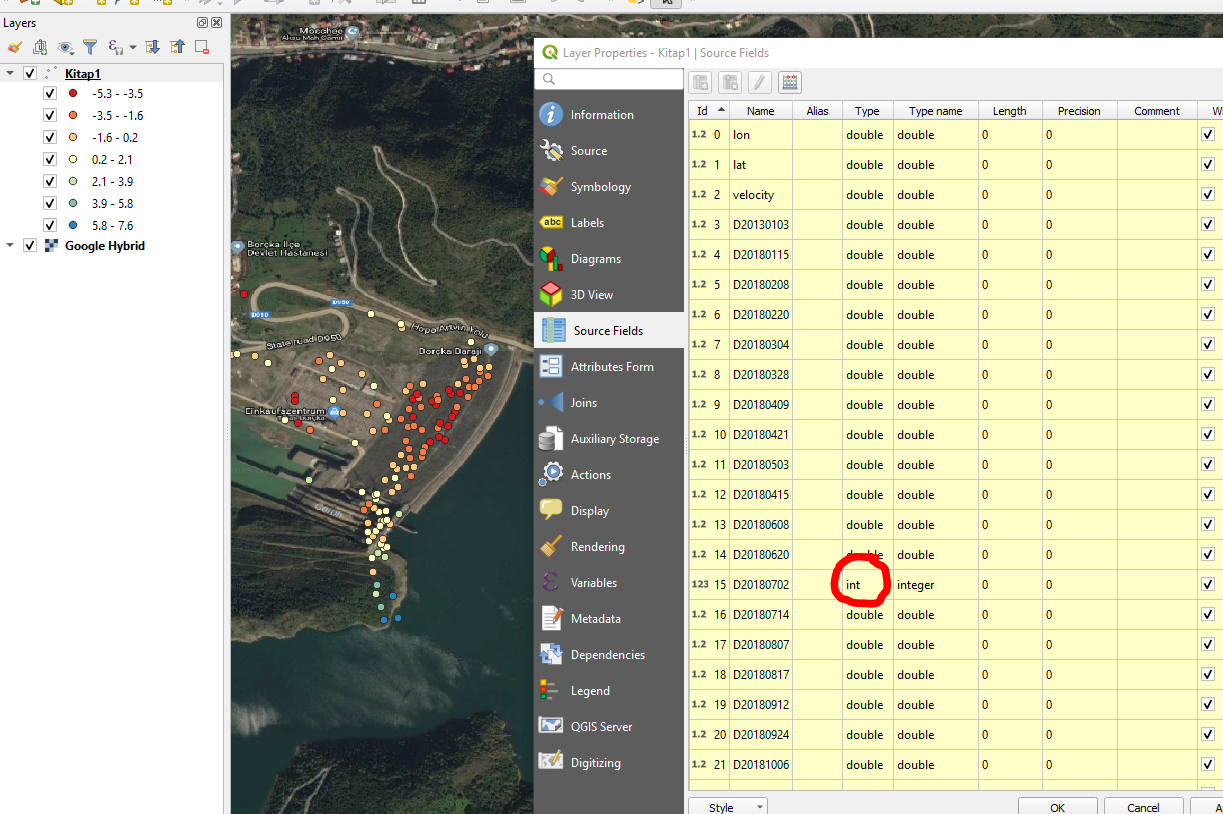
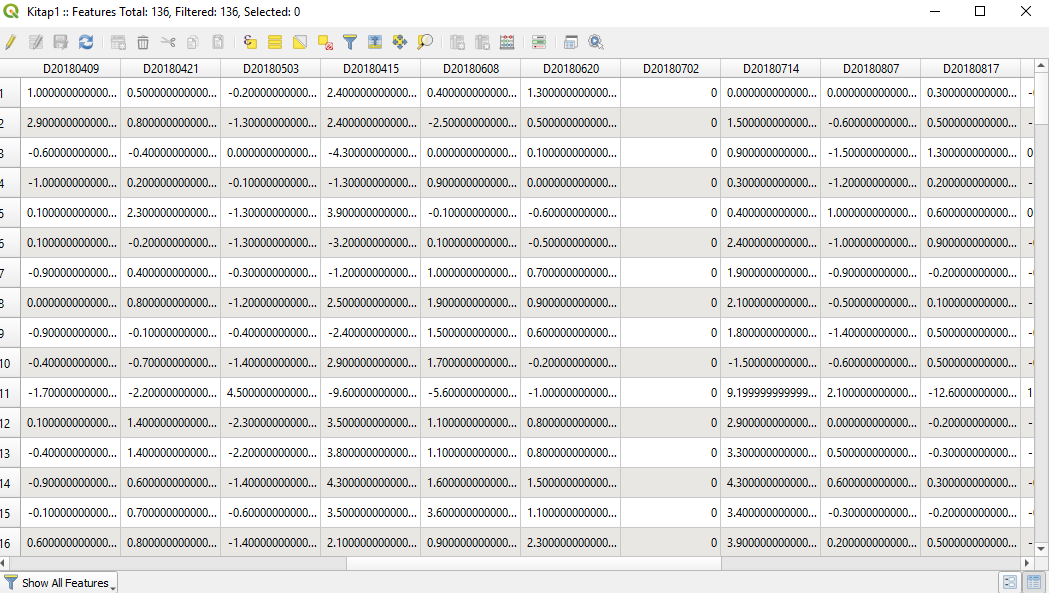
after importing it into QGIS, I noticed that one column is interpreted as integer.
Furthermore, your first date starts with 2013.
In the attribute table, it consists of 0s (your master image?)
I removed it and made 2018 out of 2013, but this didn’t solve the problem. I cannot find any difference between both datasets…
Yes @ABraun, it is the master image. I organise the table in microsoft excel and save as CSV file. What is the program you are using when editing a CSV file?
I also used MS Excel
Hi Throsten,
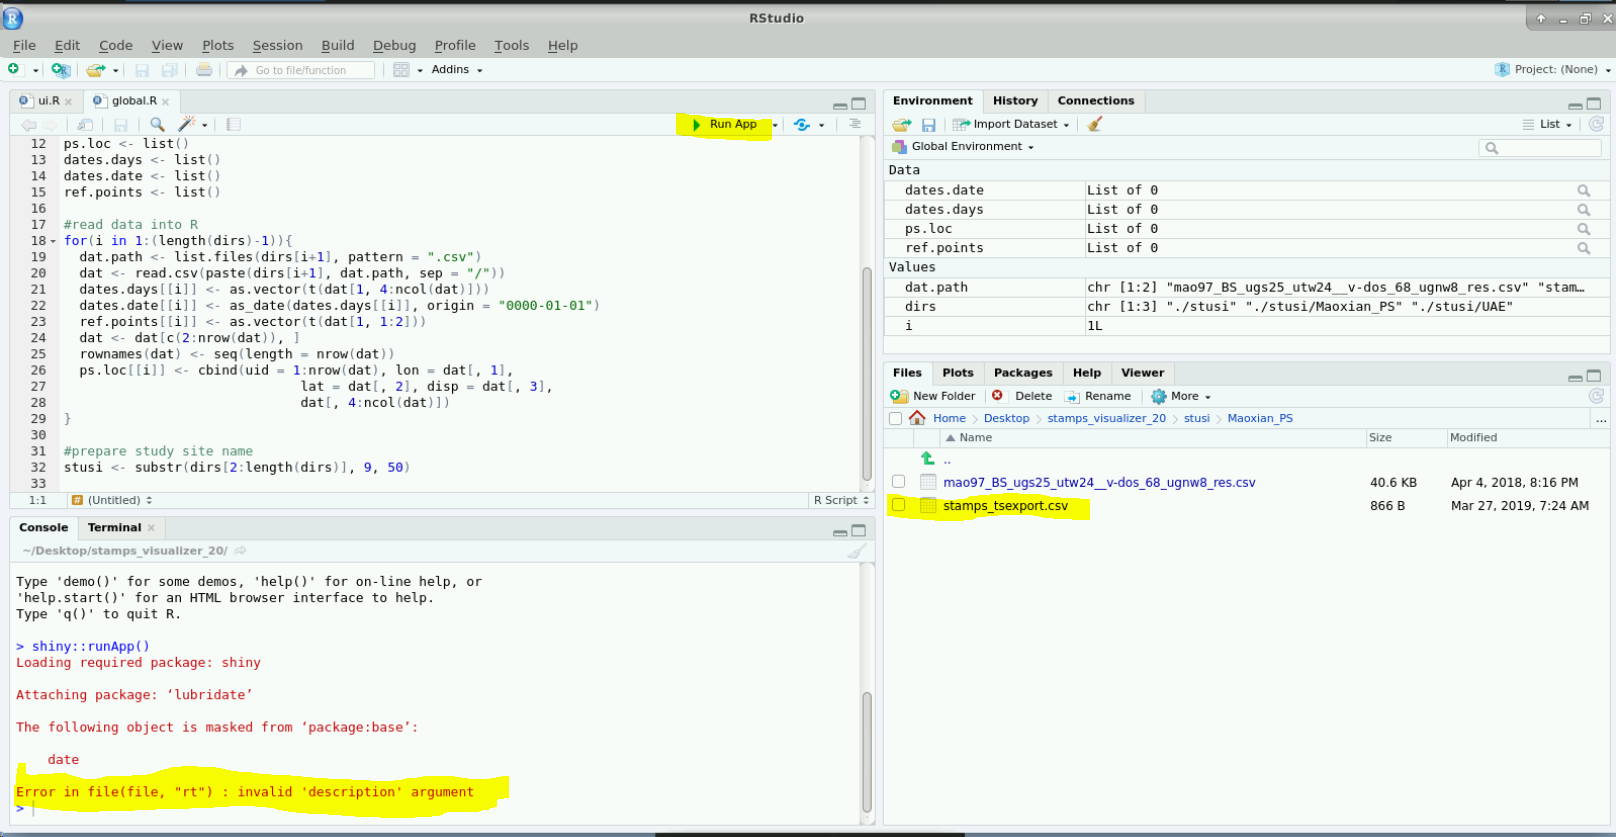
Finally I succeeded to export the CSV file by decreasing the radius, and thanks to @volkan but now I have this error, it is occurred while trying up to run the app.
It runs now, BUT apparently it is not possible to save CSV file within the folder 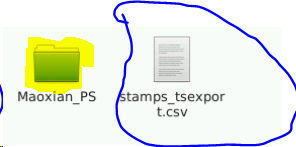
I removed it out, But now it runs, how to reach my file?
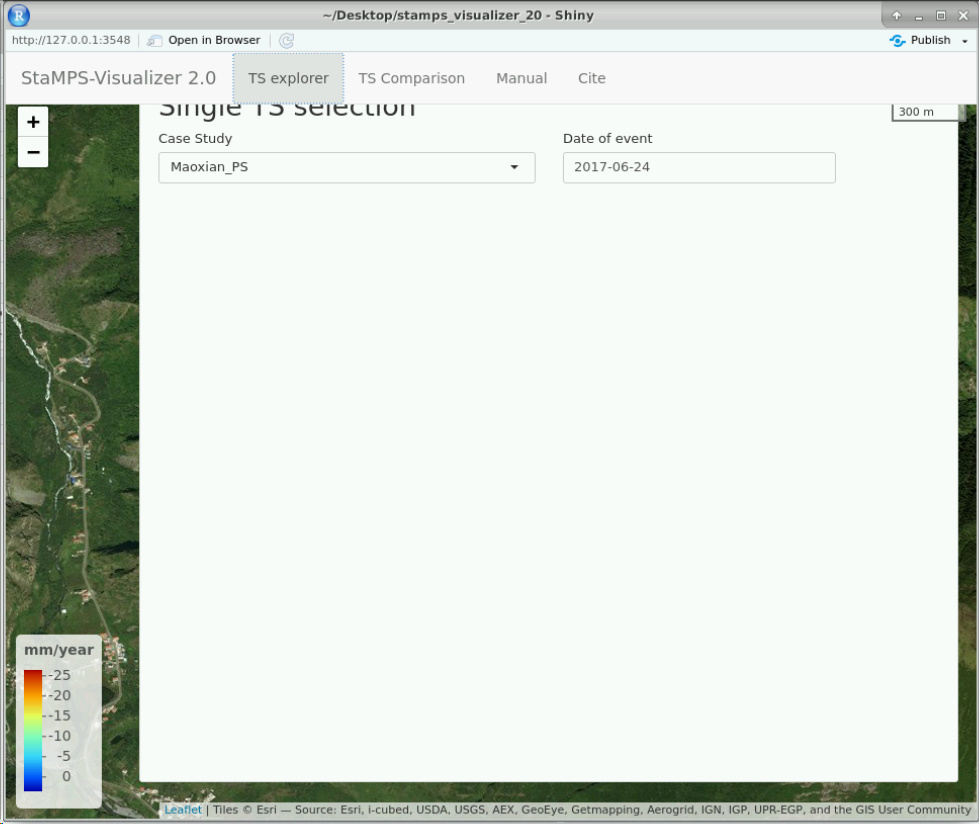
you have to create a separate folder containint the new CSV, similar to the structure of “Maoxian_PS”
Open a new folder like Maoxian_PS or Maoxian_SBAS. For example Falah_PS, and put the stamps_tsexport.csv file into the Falah_PS folder.
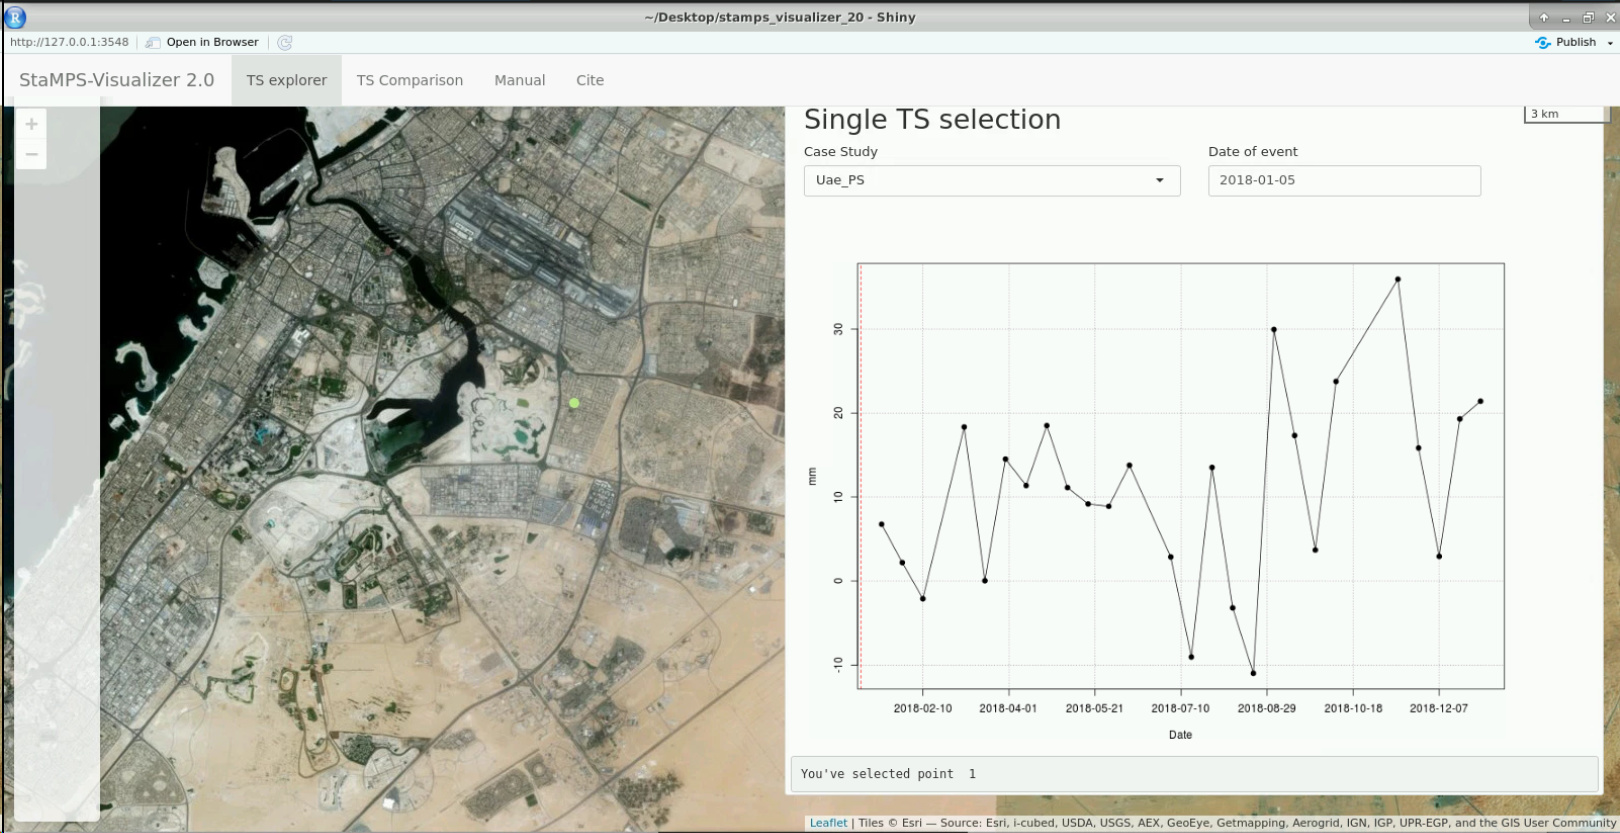
After open R, run the ui.R. Within the opened window select Falah_PS for case study.
@mdelgado @ABraun @thho and @volkan Thanks a lot, I overcame the technical issues (NOT ALL) AT LEAST TO run SNAP-StaMPS, reaching the final step without changing any parameters are highly recommended and then we could create other start focusing on the nature of study,
Hi @abraun,
I downloaded the file (Quetta_45000m_134_CSV.csv) and made it shp, but It is not working too. I tried many times many alternatives but did not succeed. What is the version number of QGIS and PS Time Series you are using?
currently QGIS 3.6 but it also worked with 3.2 and 3.4. Time-series plugin 0.3.1
Hi Andy,
Would you please to explain more, what kind of
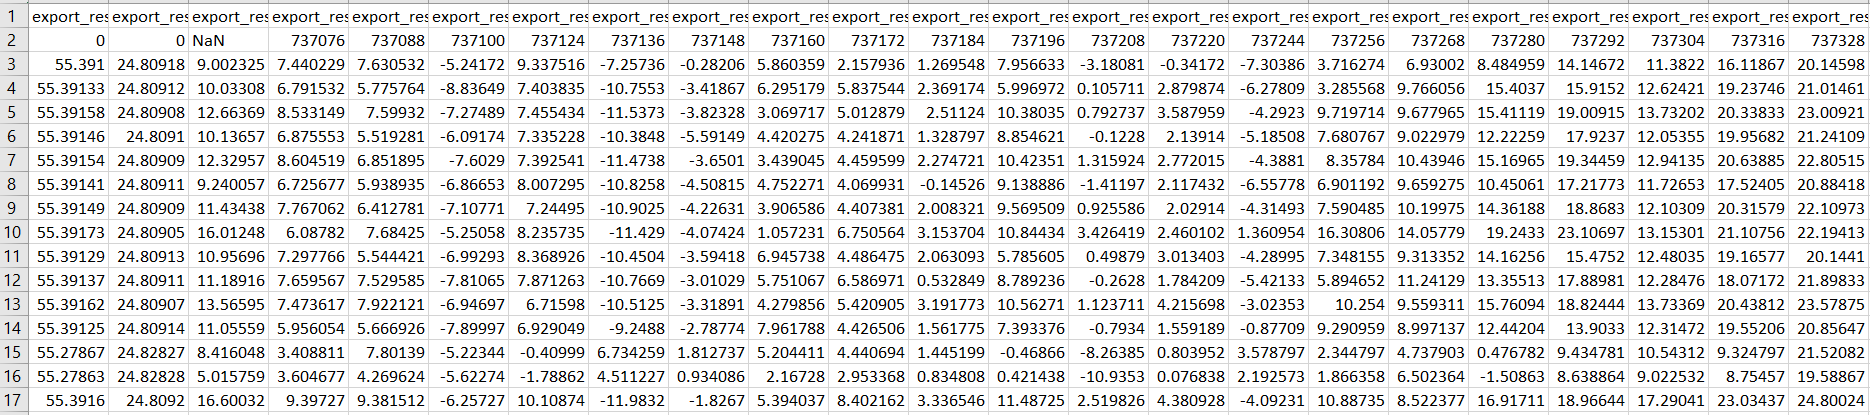
I took a look at your .csv file, but I stacked at this point, Since I have large file 771 MB, I copied a small cells, as below,
Line 2 is your date, it just needs to be formatted as such and D needs to be placed before it. You can set this in the user defined date format in MS Excel.
I created a new line with the formatted date and skipped the first two lines upon import in QGIS
I uploaded an example: Quetta_45000m_134_XLSX.xlsx (1.6 MB)
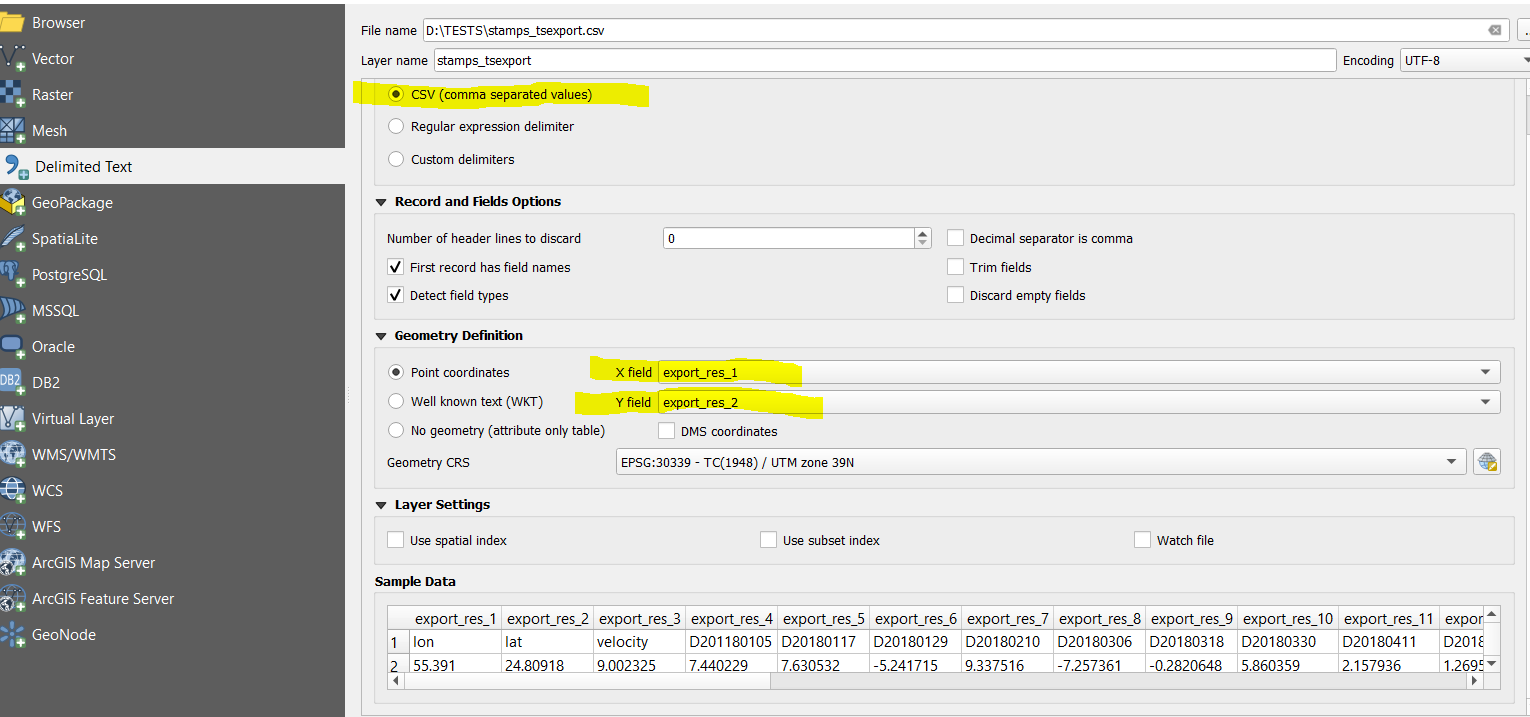
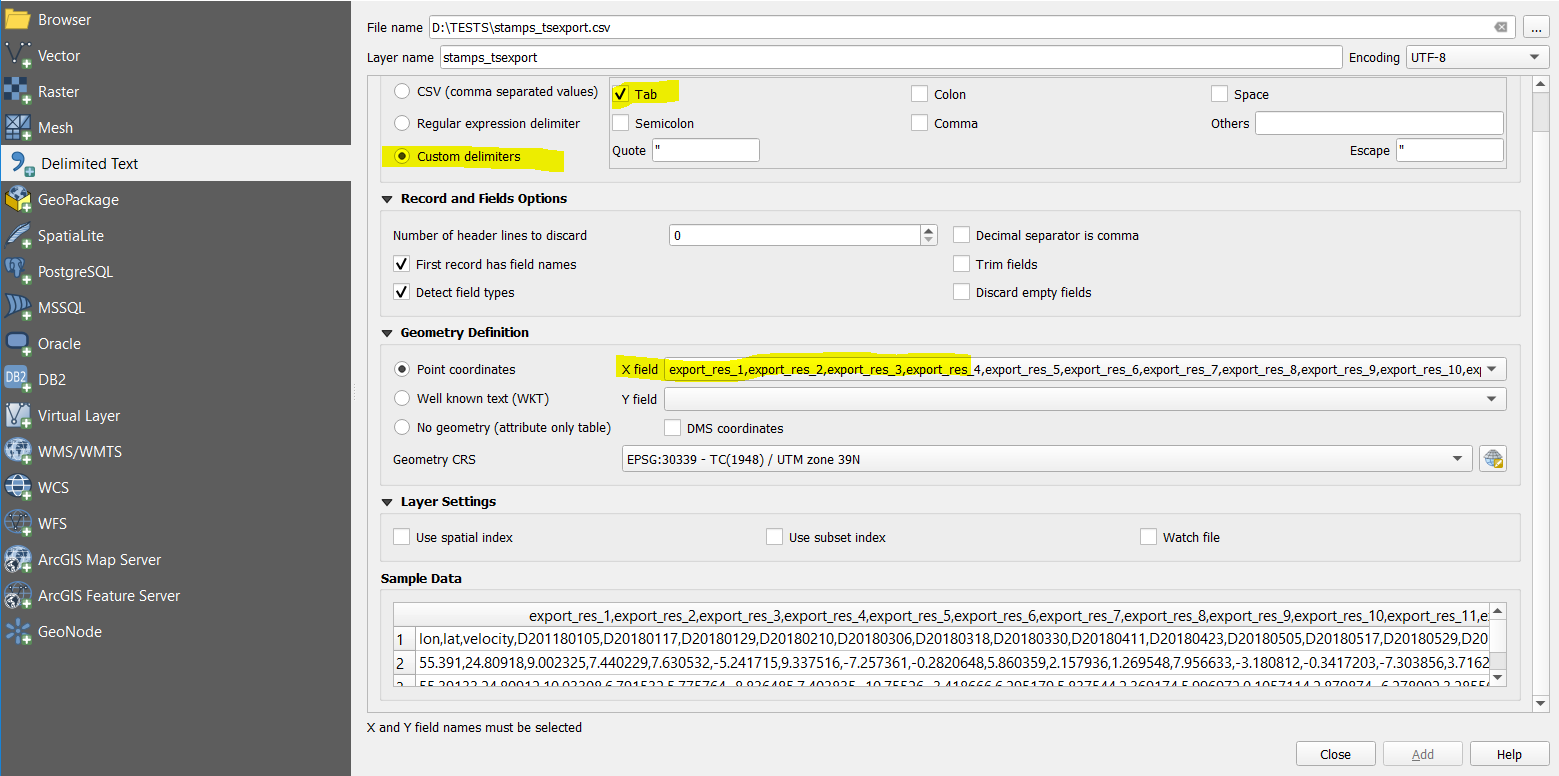
Which one to choose in order to import in QGIS, and identify the lon and lat, because in both cases I couldn’t add the x,y field, because it reads the first line only,
Also when add up them by removing the first line the time series plugin says that there is no ts to read,
increase the “number of header lines to discard” so lat/lon become column names.
CSV is the correct import type.
This is wonderful! Thank you! Also, in your Cite Section it’s “absolutely no warranty” not warrenty