ha, nice  new git push in a few minutes
Hi @ABraun,
I can’t solve the shapefile issue. I tried a lot of time during the passed time with different pc and different versions of programs (from exported csv to working shapefile in qgis). I know that the request is very big and very exhausting but can you share step by step screenshots or a video? Thank you.
I am sorry to hear that. To be honest, I tried your CSV file and couldn’t get it to work either. Something in there is different from the ones that worked for me but I did not find it yet.
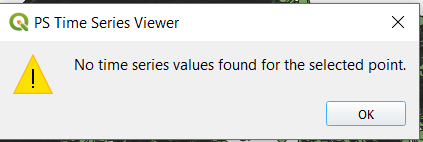
Using the time series viewer gives me this message, anything wrong with my shp,
The other problem is, the layer before and after export it as shp. doesn’t lay over google satellite base map in QGIS,
This is an example of the CSV file,
Example.csv (91.0 KB)
please have a look at my example and compare where it could be different.
Are the points correct when imported as a CSV?
What do you mean? I didn’t get your point,
you say the points are dislocated after exporting them as a shapefile. So were they at the correct location initially (after you loaded them as delimited text layer)?
No, they weren’t, I guess, you want to say, that the problem is occurred while exporting the points to .CSV using StaMps visualizer, Or not?
I don’t know where the problem occured.
`Do you want to share your CSV?
Yes sure, but it is 318 MB, after creating zip file, how it is possible to share it?
that is strange, it should be way smaller actually.
Might be, because three bursts of uae, plenty of points or, Doesn’t it matter?
even if the area is large, it seems a bit much to me for just tabluar data.
Did you check the CSV file I uploaded above and compare if it is somehow different to yours? Are you able to load this one?
is it uploaded yet? The link is empty.
Yes, it is already uploaded, would you please to check up once more,
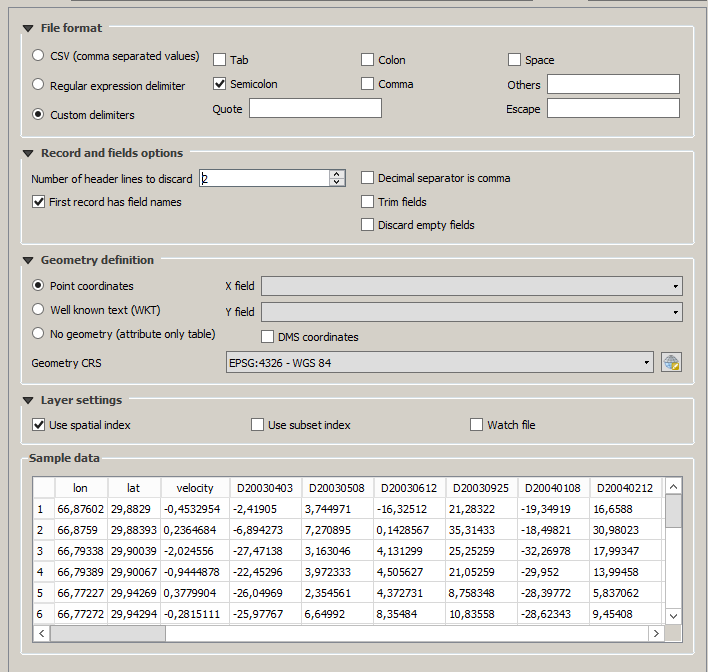
your column names are not formatted as requested:
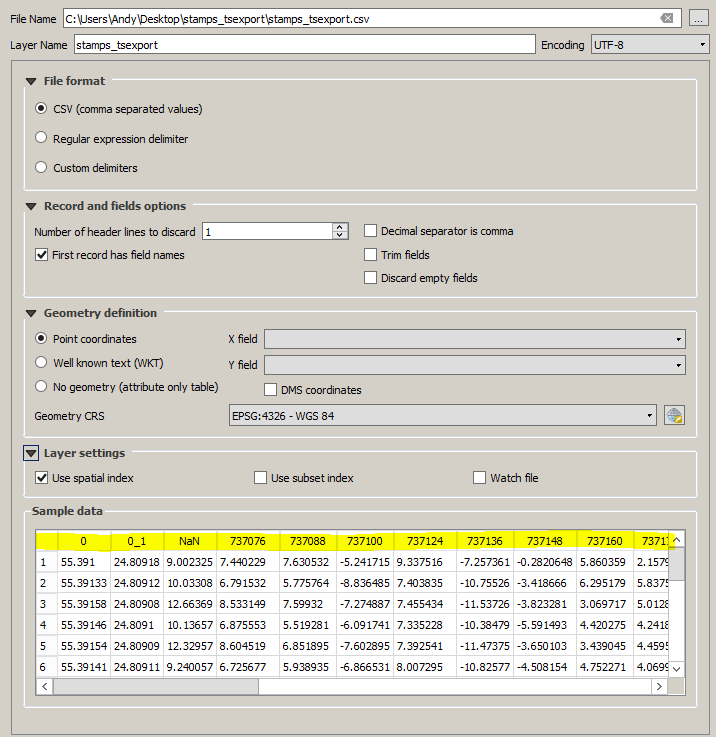
The tool only recognizes data which is exactly named like this:
lat, lon, velocity, Dyyyymmdd, Dyyyymmdd, Dyyyymmdd,…
I tried to explain it here.
1 Like
I uploaded to you the original one, Yes I formatted the file, as it is uploaded in the example file, but I was thinking that you want to take a look at the original one,
I think, you have the same problem with me. I could not plotting the time series too.
Don’t give up, we are trying and trying 