I tried Visualizer for my study area and I think I have some problems with creating .csv file. PS pixels are not shown on the map. Could you examine .csv file below to help me to find the problem? Thank you.
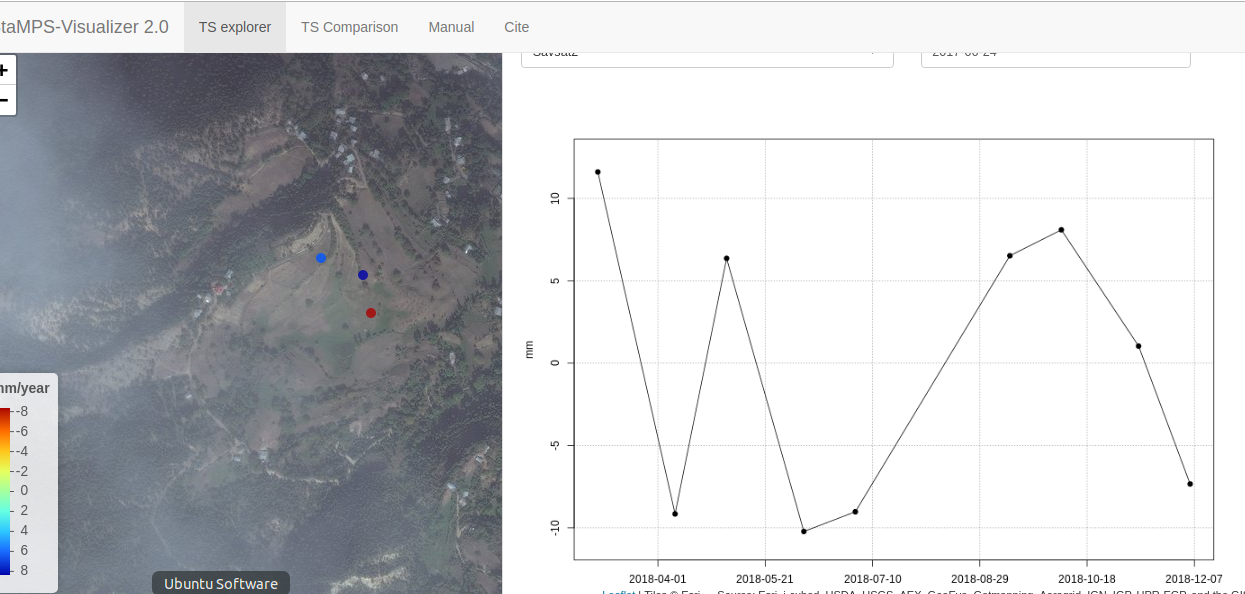
As you can see, I have used your csv.file and I can see both points you have processed. The file seems ok to me.
I would recommend to use the latest version of StamPS-Visualizer from github
You should also work with StamPS 4.x and use the Matlab export code given in the Manual tab within StamPS-Visualizer to export your csv table from StamPS 4.x.
Some comments to your processing, from the csv table I can relate that you did not choose a reference point, which is highly recommended. It is possible that using a ref point will highly influence your time series and will help during interpretation.
It might also help to set StamPS parameters in a way to find more PS if possible, or if you already have more PS processed export a larger area. This is just a personal taste, I find it easier to interpret larger point clouds with more difference and maybe trend in it as just a few points.
Let me know if there are any further questions or problems!
Cheers
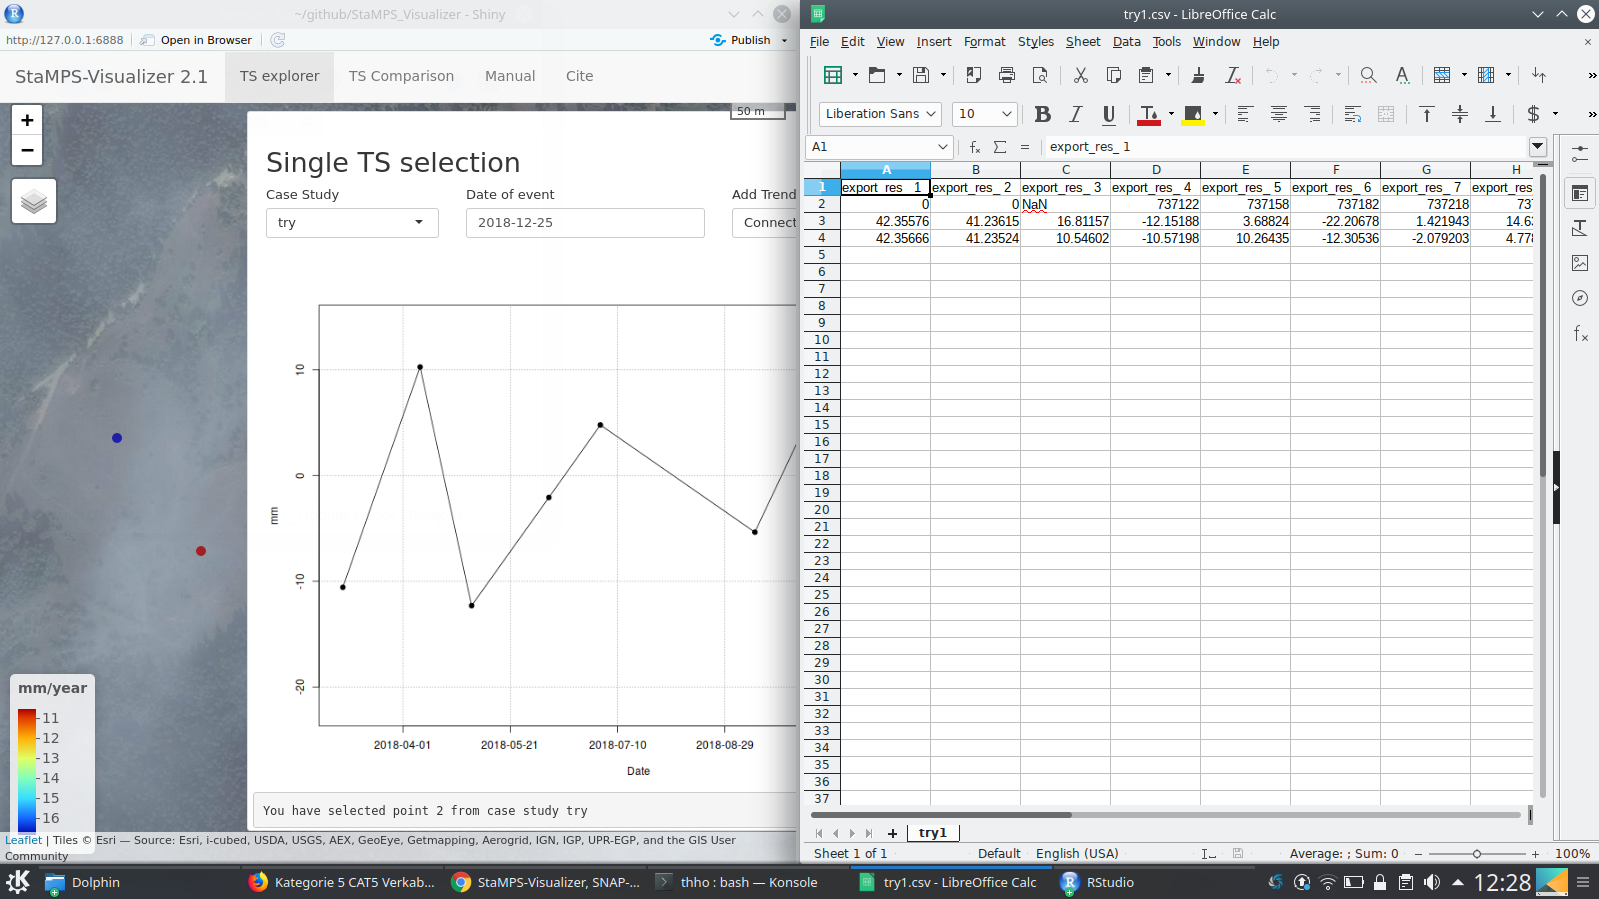
thank you for the reply. I have also reached this chart. Because of my chart is not detailed as yours, I thought that there is a problem. I am confused about the meanings of every line and every column in csv file. Can you explain, please? And, in your sample data, you have more lines and columns. What is the reason?
I do not remember selecting a reference point. In which step, it is selected? Could you suggest any reference for more reading?
the csv chart is structured like this:
row 1 header
row 2 col 1 and 2 lon lat of your ref point
row 2 col 3 NaN to fill this cell
row 2 col 4:ncol the dates in days from 0 of the measurement, will be converted in stamps visualizer in yyyy-mm-dd
row 3 col 1 an 2 lon lat of measurement point (MP)
row 3 col 3 mean velocity of MP
row 3 col 4:ncol displacement value of MP
Therefore, the number of MP defines the numbers of rows and the number of images or interferograms to be more precise defines the number of columns. Your have selected two MP and less interferograms, therefore your table looks smaller than mine.
The number of MPs is defined by your ts-plot in matlab. The location where you put your point of interest and the size of the search radius define your number of MPs. Hence this is individual to each data set, I can not give you any further advice. To get more MPs processed in StaMPS, check out the StaMPS parameters by reading the manual provided on the StaMPS web page.
Setting a ref point is a global operation, the ref point information is used in several operations. I recommend putting this parameter before starting processing at all. To select a ref point it is highly recommended to use a location where you are sure or assume no or just minor movement/displacement. For further details, you will find help in the manual.
Beside the manual, I found a lot of help studying this paper: Hooper, A., P. Segall, and H. Zebker, Persistent scatterer InSAR for crustal deformation analysis, with application to Volcan Alcedo, Gal ´ apagos, ´ J. Geophys. Res., 112(B07407), doi:10.1029/2006JB004763, 2007.
I tried with reference point and considered your suggestions. Altough there are many PS point in my exported kml file, I see 3 PS within StaMPS-Visualizer’s TS Explorer window. Is there something still I am missing?
one thing we should check is which StaMPS version you are using. I think you use 4.x if so, please check the Manual tab in StaMPS-Visualizer and use the right export code for the csv file. It has changed from 3.x to 4.x due to some changes of the objects which are created during tsplot! The export code you posted earlier is for StaMPS 3.x which might be the problem.
I used StaMPS 3.x version and StaMPS-Visualizer 2.0 version to create that .csv file. Because of eliminate the version problems, I have installed StaMPS 4.x version and StaMPS-Visualizer 2.x version from Github.
I get some error while the running the code below;
>> load ps_plot_v-d.mat;
>> lon2_str = cellstr(num2str(lon2));
Undefined function or variable 'lon2'.
Codes from manual page:
Use this Matlab Code for exporting a csv table from StamPS 4.1 for older versions see below
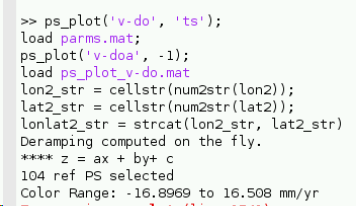
ps_plot('v-do', 'ts');
load parms.mat;
ps_plot('v-do', -1);
load ps_plot_v-do.mat;
lon2_str = cellstr(num2str(lon2));
lat2_str = cellstr(num2str(lat2));
lonlat2_str = strcat(lon2_str, lat2_str);
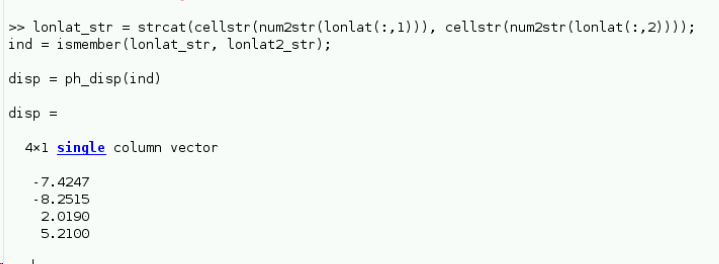
lonlat_str = strcat(cellstr(num2str(lonlat(:,1))), cellstr(num2str(lonlat(:,2))));
ind = ismember(lonlat_str, lonlat2_str);
disp = ph_disp(ind);
disp_ts = ph_mm(ind,:);
export_res = [lon2 lat2 disp disp_ts];
metarow = [ref_centre_lonlat NaN transpose(day)-1];
k = 0;
export_res = [export_res(1:k,:); metarow; export_res(k+1:end,:)];
export_res = table(export_res);
writetable(export_res,'stamps_tsexport.csv')
After the first line, a new window opens which allows you to define the area and a radius. It is advised to do this separately from the rest of the code.
@ABraun is right about that, it is necessary after you have run ps_plot(’v-whatever’, ’ts’) to set a search radius and click on the ts plot window which has popped before continuing with the rest of the csv export code. This click action triggers the creation of the object which are needed for the export, in fact it is similar to the kml export. When I wrote the export csv lines I orientated on the kml export which follows a similar procedure.
@volkan I hope that made some things more clear, let us know if it works for you. If there are still errors occurring, please report it with the error message, mostly I can then relate what might be wrong. Cheers!
I have a question about making a subset in SNAP. I make a subset normally and in the view window only the area of interest that I have cut is observed, but in the world view, the full limits of the IW2 are observed, and the processing in StaMPS gives me PS points of the complete IW2.
One explanation could be that your data is still in slant range geometry. What seems like a square in your SLC product actually covers a long stripe due to different pixel resolutions in azimuth and range direction.
this is a known error which occurs when there is a high density or amount of PS. Please have a look into the manual page of the Visualizer, there you can find a documented workaround to avoid the error.
You also have to be sure, that you user the right export script for your stamps version, since there have been changes in stamps v4.x… All this is also documented in the manual page within the application.
I hope that helps you.
Cheer
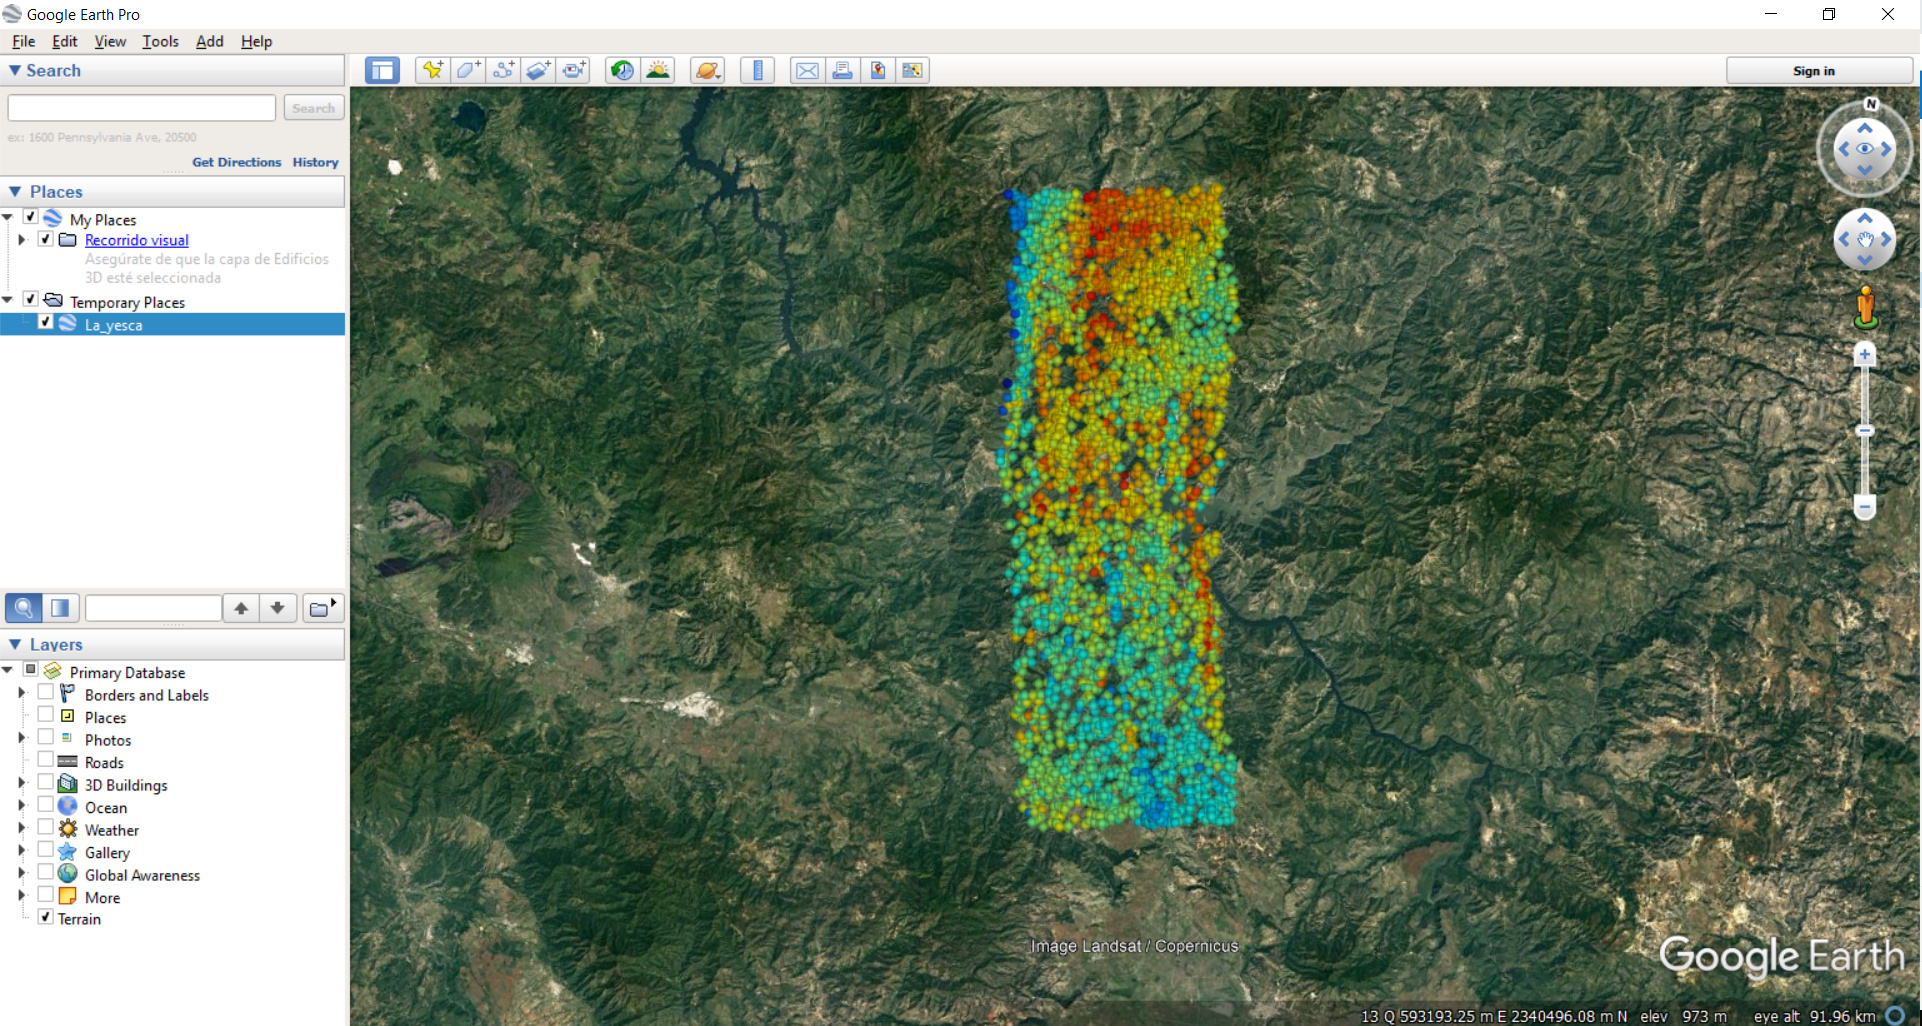
Yep I meant that, first you have to select a very very huge area for the tsplot area in matlab and export this very huge CSV table the usual way, then you change to R using the script you found in the documentation to subset the information in an other way than in Matlab, somehow this makes a difference, until now I an still not able to tell why Matlab does not work in this case…
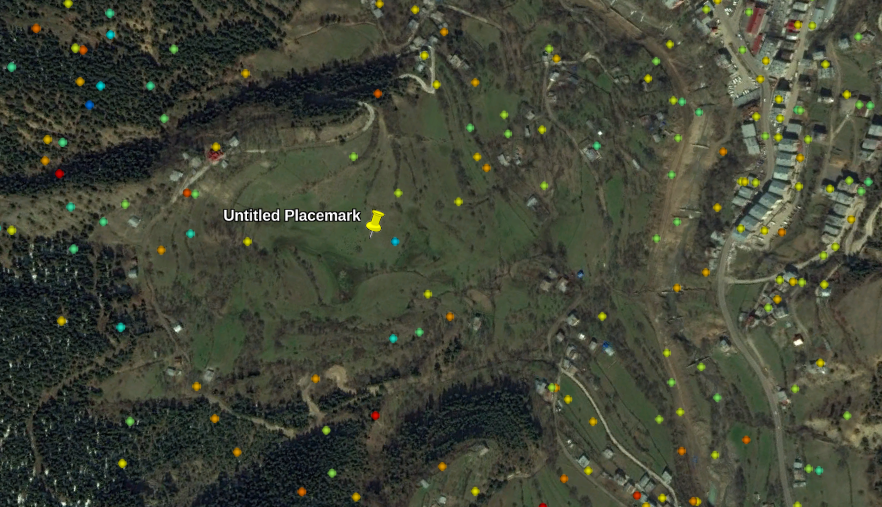
Make sure to adapt the path information to your machine and you need to have a roi to subset your ps of interest, I normally use Google earth to create them… Mostly a but sloppy but it works
I exported the data as a CSV with the tool that was provided by ttho. After that, a few adjustments have to be made to the table (formatting of the date and naming of the colums). An example on how the table must look like is given in the documentation of the QGIS plugin.
You then import the CSV as points and convert them into a shapefile. After that, you can click on the tool icon and select any point you want to have displayed.