StaMPS-Visualizer, SNAP-StaMPS Workflow

Dear All. As an alternative to the StaMPS Visualizer the StaMPS built in ps_output function gives the error “Unable to read file ‘mean-v’. No such file or directory.”. I am curious if there is an alternate way to export all PS time series from Matlab as a csv?

Hello there,
I failed to use StaMPS Visualizer. The problem is the csv. file I created was empty. I have used the command ps_plot(‘v-dao’, ‘a_linear’,‘ts’) to select a PS point to export. And I put down the radius 200m here. The steps I followed in the process are shown below. Does anyone know the reason behind this empty csv. file?

Check it once,
StaMPS-Visualizer 3.0 (shinyapps.io)

I’m using ps_plot(‘v-do’,‘ts’), instead of ps_plot(‘v-dao’,‘ts’) . It’s working good.

1 Like

Your solution works. Thanks mate.

You can do it directly in ASF vertex website.

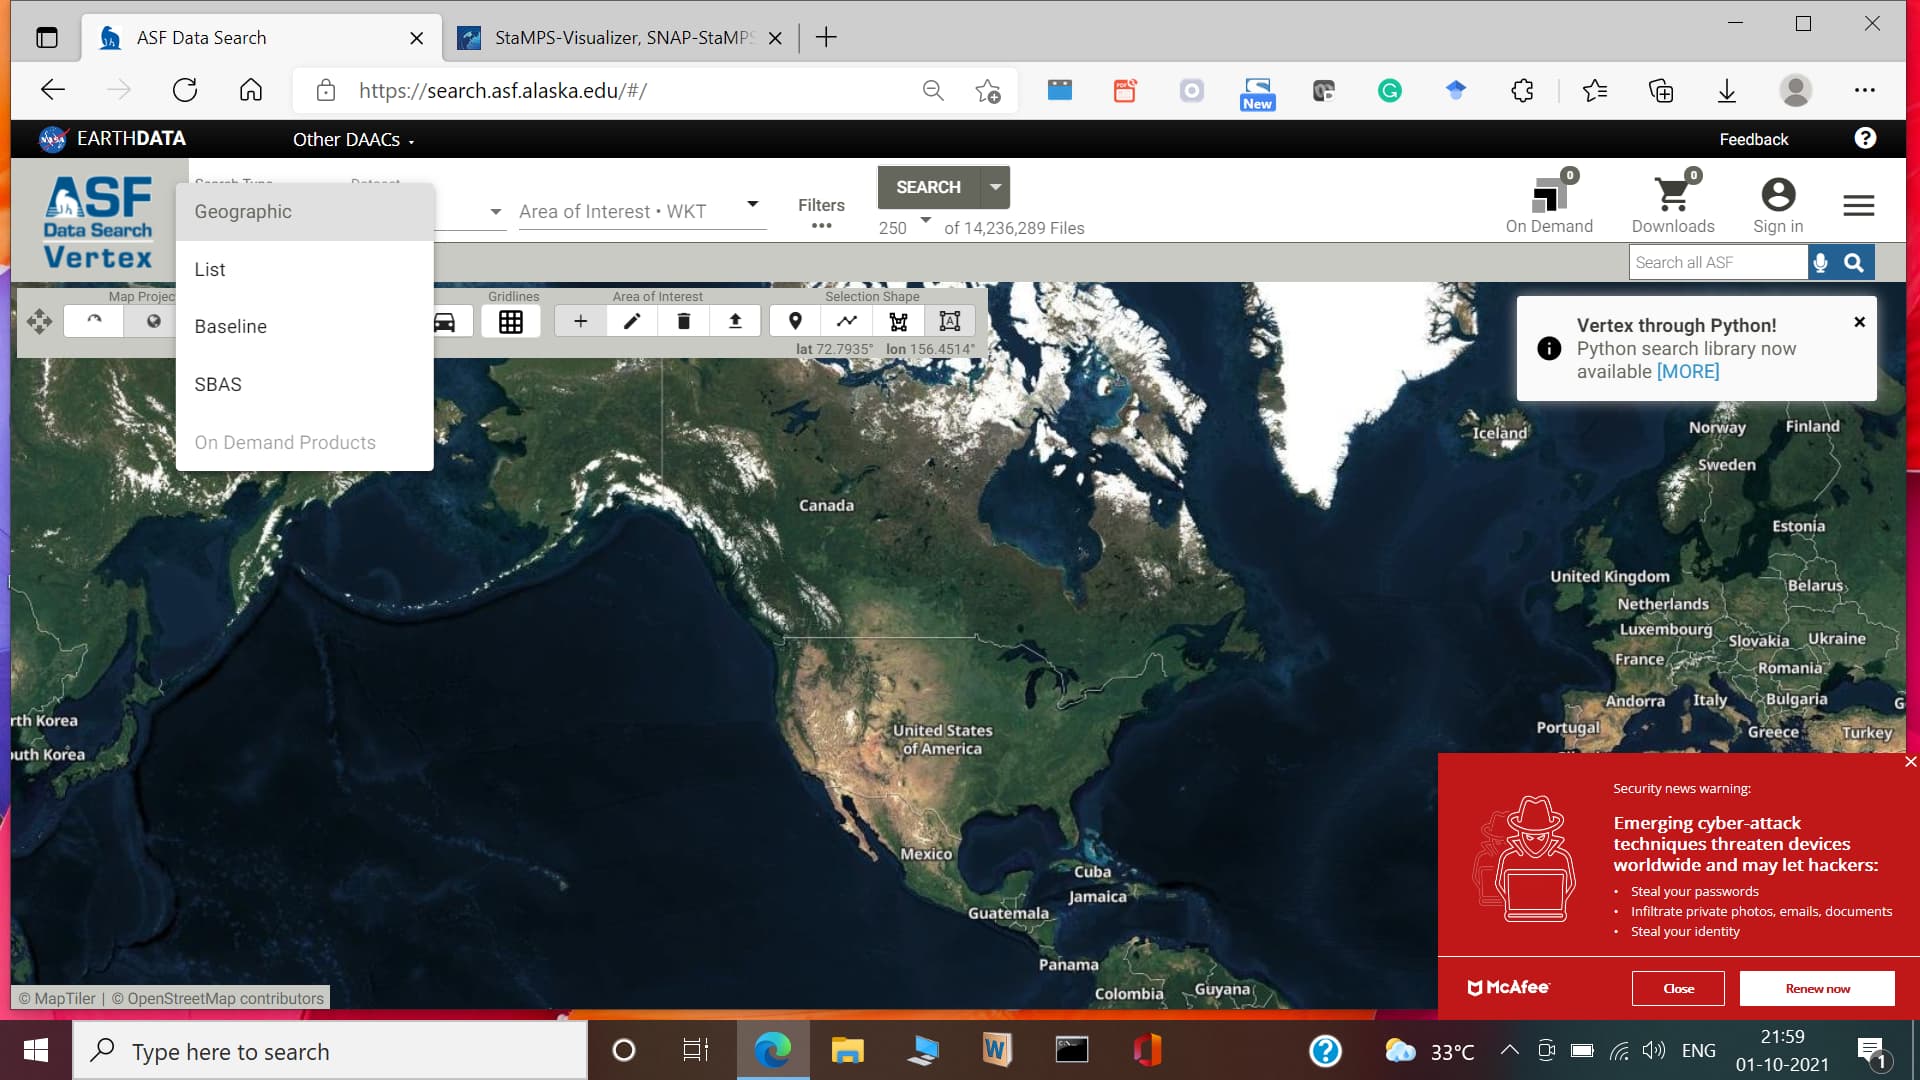
Select your area SAR images, then select the Baseline plot as shown below figure. You have to select a master image, based on that Baseline plot will generate.

3 Likes

hi @Ramos ,

please go to this repository and follow the installation instructions step by step, especially the package installation with renv, this will solve your problem:

1 Like

Hello

What is the formula to obtain the mean displacement from the values ​​for each date?

I can’t understand how the final velocity value: mm / year is obtained

All the best

We once discussed this somewhere in this forum, someone provided a good explanation, but I can’t find it anymore.

Check this:

and the next posts especially the last from @weiweian

2 Likes

This is also one of the best post from Thho. Please check it once

1 Like

thank you @thho - this were the posts I had in mind. :+1:

2 Likes

hi @thho @ABraun , Can I install Stamps-Visualizer on version 7 of Windows?

hi @despina98
Not sure but if the installation of R v3.6 is successful, there is a good chance that everything works out fine.

@thho the installation of R v3.6 is successful,but But when I call the Run App. The software opens but closes immediately and this warning appears:

R version 4.1.1 (2021-08-10) – “Kick Things”
Copyright (C) 2021 The R Foundation for Statistical Computing
Platform: x86_64-w64-mingw32/x64 (64-bit)

R is free software and comes with ABSOLUTELY NO WARRANTY.
You are welcome to redistribute it under certain conditions.
Type ‘license()’ or ‘licence()’ for distribution details.

R is a collaborative project with many contributors.
Type ‘contributors()’ for more information and
‘citation()’ on how to cite R or R packages in publications.

Type ‘demo()’ for some demos, ‘help()’ for on-line help, or
‘help.start()’ for an HTML browser interface to help.
Type ‘q()’ to quit R.

shiny::runApp(‘D:/stamps_visualizer_01beta/stamps_visualizer_01beta’)
Loading required package: shiny

Attaching package: ‘lubridate’

The following objects are masked from ‘package:base’:

date, intersect, setdiff, union

Listening on http://127.0.0.1:4006
Warning: Error in library: there is no package called ‘colorRamps’
52:
Error in library(colorRamps) : there is no package called ‘colorRamps’

Have you tried installing the colorRamps package in R (use the menu in Rgui or on the command line: install.packages("colorRamps"))?

@gnwiii @thho I tried both methods. :cry:How can I open the csv file of my case study area?

I want to install StaMPS_Visualizer on Windows 7 and open the CSV file in it. I have also installed R and RStudio software. Can anyone please send me StaMPS_Visualizer Package?

Hi @despina98, from your screenshots, I can see that you use the first version of the visualizer which is outdated. Please go to this repo, clone or download the content and follow the installation instruction given also for Windows closely. I recommend installing all necessary packages with the renv method which is descried in the aforementioned installation guide:

Also, you will find instructions in the manual of the visualizer how to properly import your own data.

Dear @thho , Thanks for your good response, I followed all your instructions,Now how do I add my area to Visualizer? Why is it not seen here even though I copied it??