Dear Thho,
How can I generate CSV file for a particular small area using latitude and longitude in StaMPS-Visualizer.
Hi @suribabu,
if I get it right, you want to export a csv from Matlab-StaMPS with a small radius around a lon-lat coordinate? If so do:
- export a very very large region that includes all points from Matlab
- create a shapefile (like point at the coordinate of interest and then geometry tool to buffer this point to a radius that suits you) and spatially subset the large export
- here is an example script that you can use for the subset process StaMPS-Visualizer, SNAP-StaMPS Workflow - #417 by thho
1 Like
Dear Thho,
In exported CSV file we are getting longitude, latitude, mean velocity, and cumulative displacements of all the InSAR images. While plotting these in StaMPS-Visualizer we are getting mean velocity with respect to lat long.
If i select a single PS point in figure it is giving time vs LOS displacement (mm). But in CSV file contains cumulative displacement right. So cumulative displacement and LOS displacement are same? or if any difference is there please explain?
Thank you thho.
Hi @suribabu,
it is a bit different, the csv has LOS displacement relative to the prime image, besides mean velocity and lat lon of course. When you select a single point, this time series of LOS displacement relative to the prime is visualized. However, when you click the subtract offset button in the upper right, then, the y axis changes to cumulative displacement relative to the first image in the stack. Here is the explanation in more depth:
1 Like
Hello, Everyone!
is there anyone who ever get this problem?
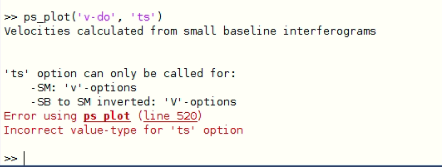
I was trying to plot the time series result, and I got this:
Thank you
if you prepared SBAS, please write ps_plot('V', 'ts')
Thank you for the answer…
sorry, BTW I am quite confused with ‘v’ and ‘V’ (e.g. ‘v-d’ and ‘V-D’). which one will show the SB result?
capital letters are for SBAS, an explanation of all variables is given here: https://raw.githubusercontent.com/dbekaert/StaMPS/master/matlab/ps_plot.m
1 Like
I guess it needed to be
if PS : ps_plot(‘v-d’,1,‘ts’)
if SBAS : ps_plot(‘V-D’,1,‘ts’)
2 Likes
I’m using your python code for StaMPS, Is it possible to plot Baseline map?
stamps has it within matlab.
Please tell me the command (in matlab) to prepare baseline plot after processing snap2stamps
I think ps_baselines
it should be run after stamps(1,1)
please check, as I do not use it since time ago
1 Like

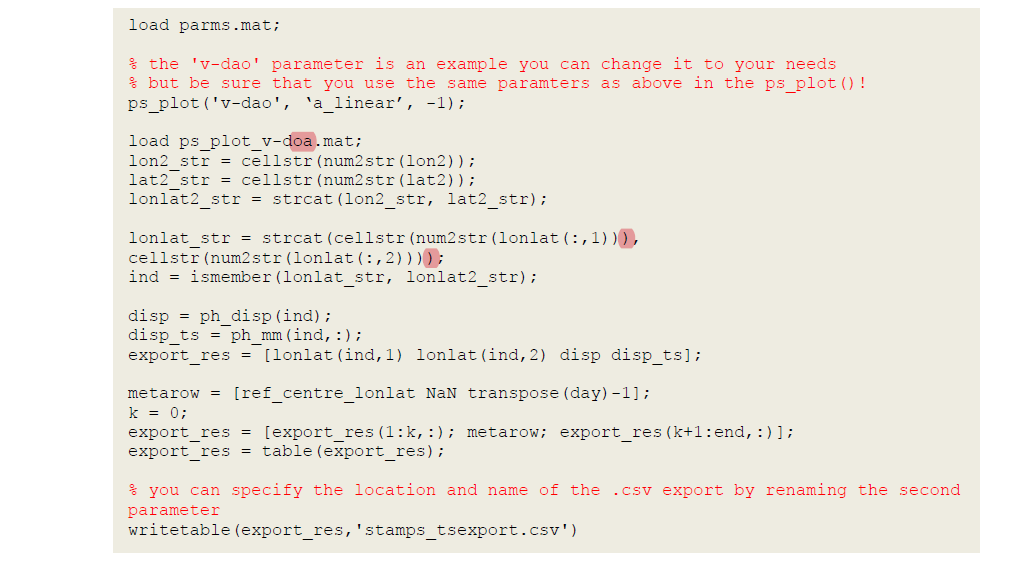
Dear All. As an alternative to the StaMPS Visualizer the StaMPS built in ps_output function gives the error “Unable to read file ‘mean-v’. No such file or directory.”. I am curious if there is an alternate way to export all PS time series from Matlab as a csv?
Hello there,
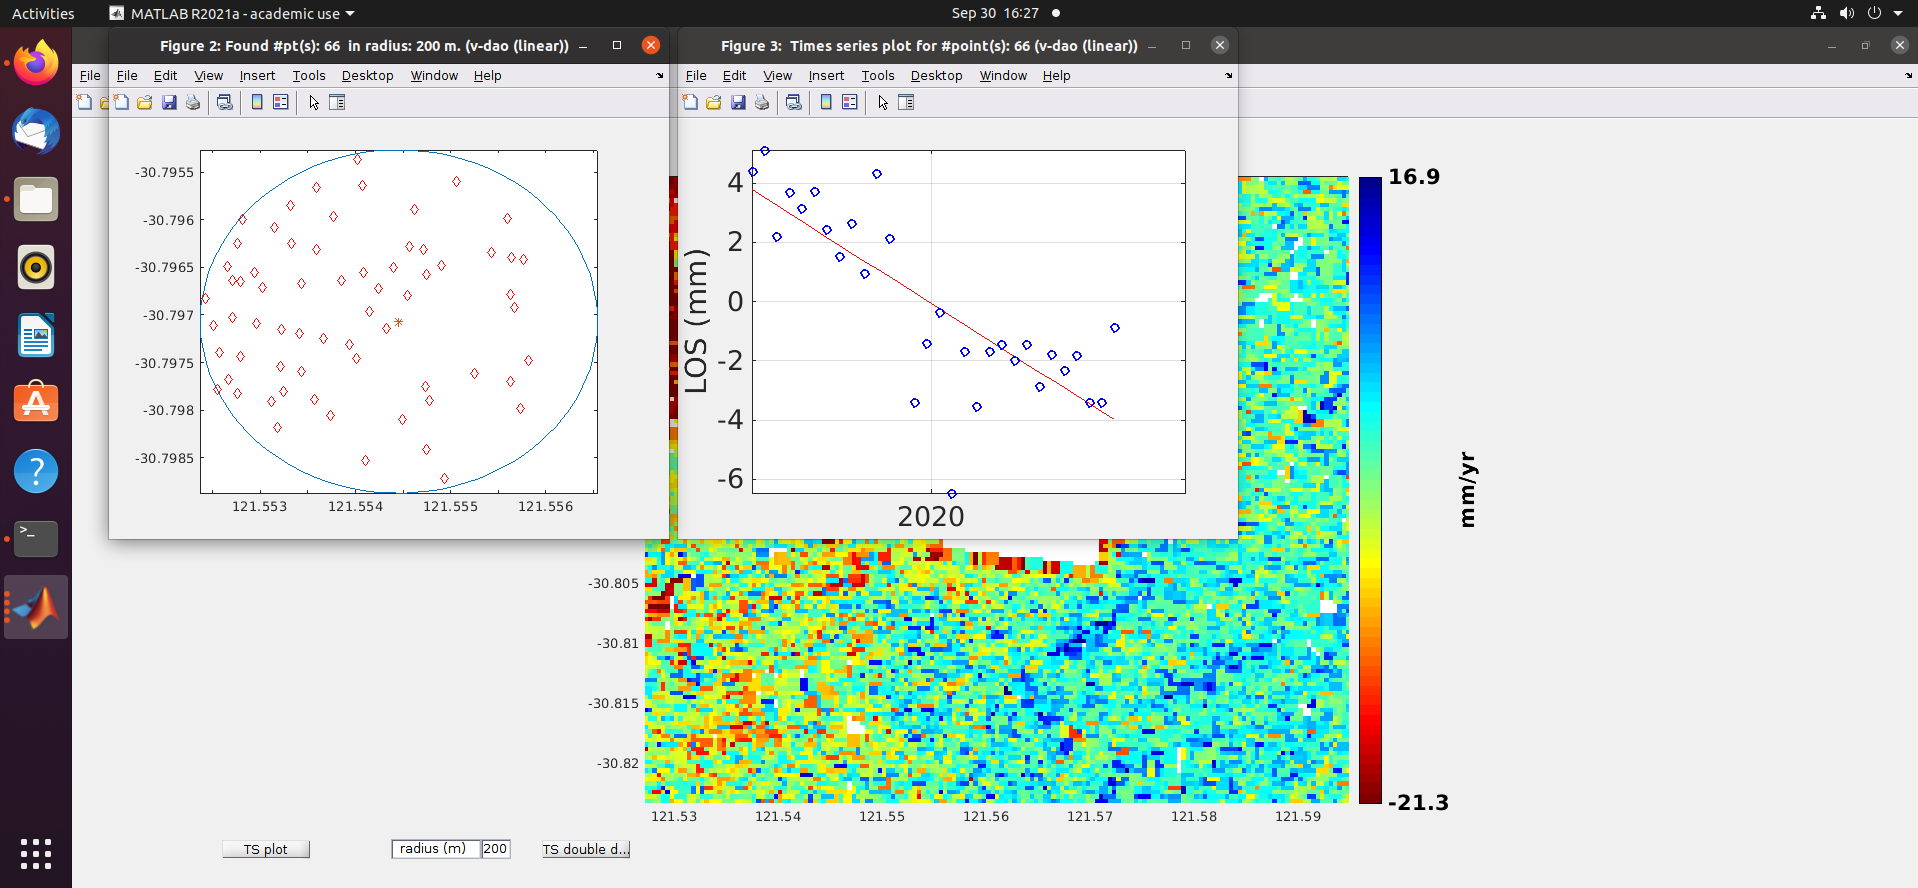
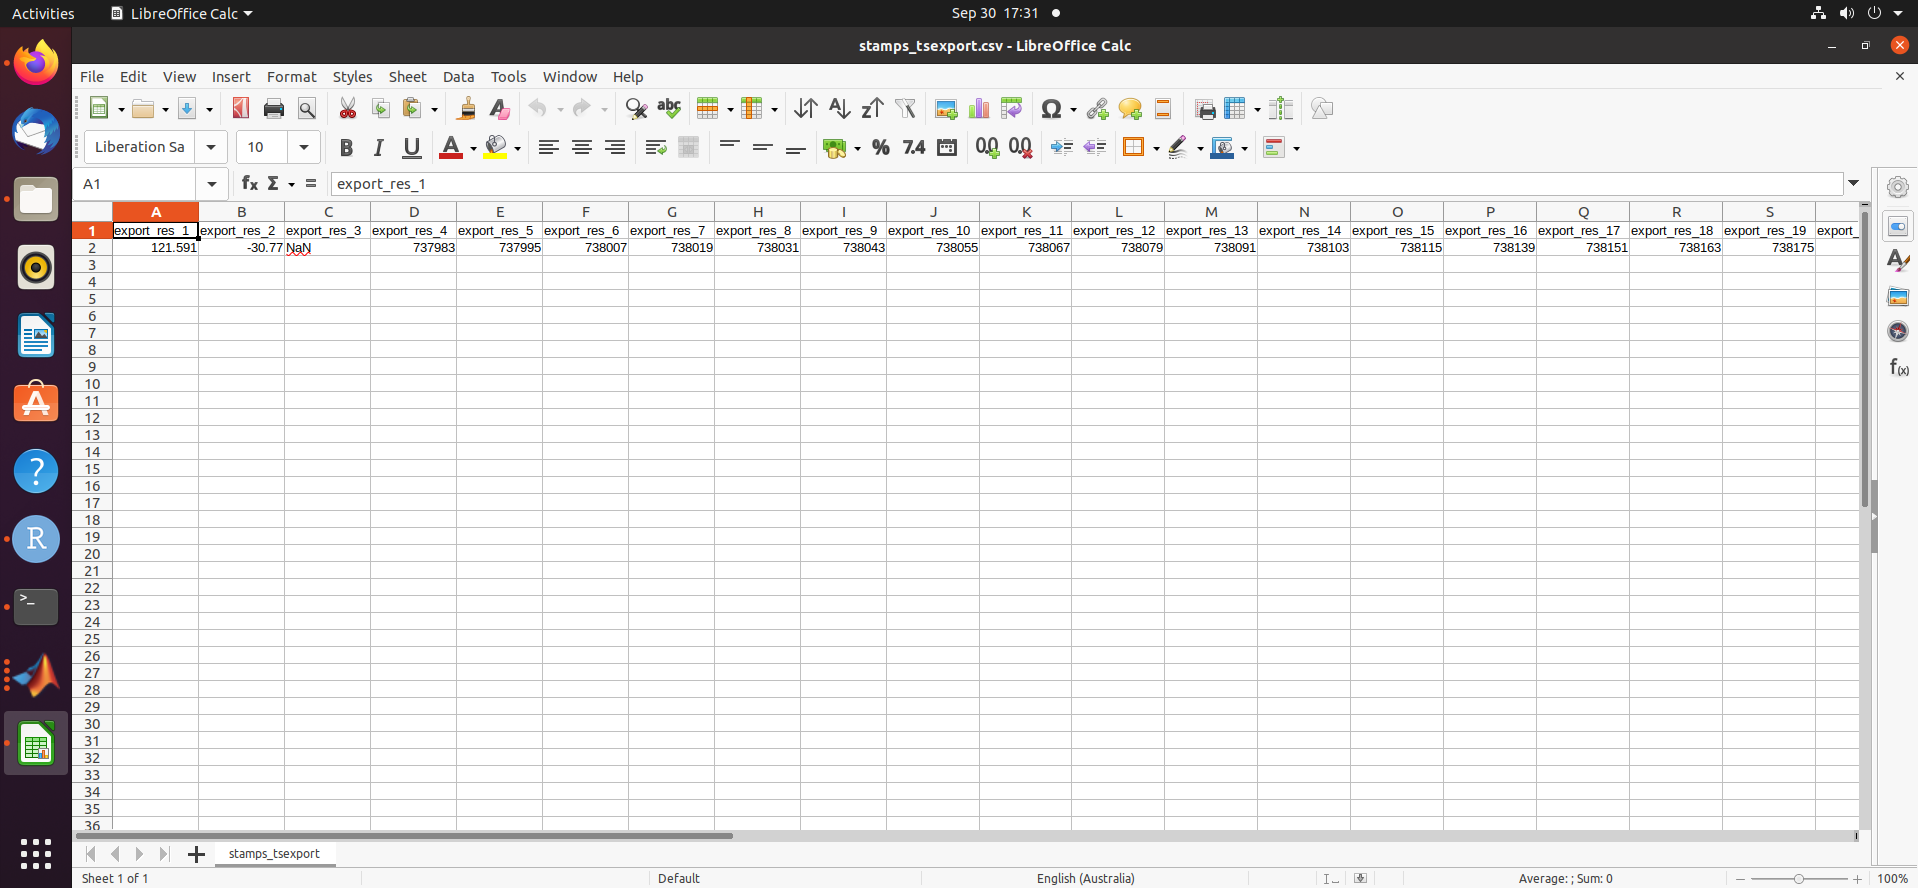
I failed to use StaMPS Visualizer. The problem is the csv. file I created was empty. I have used the command ps_plot(‘v-dao’, ‘a_linear’,‘ts’) to select a PS point to export. And I put down the radius 200m here. The steps I followed in the process are shown below. Does anyone know the reason behind this empty csv. file?
Check it once,
StaMPS-Visualizer 3.0 (shinyapps.io)
I’m using ps_plot(‘v-do’,‘ts’), instead of ps_plot(‘v-dao’,‘ts’) . It’s working good.
1 Like
Your solution works. Thanks mate.
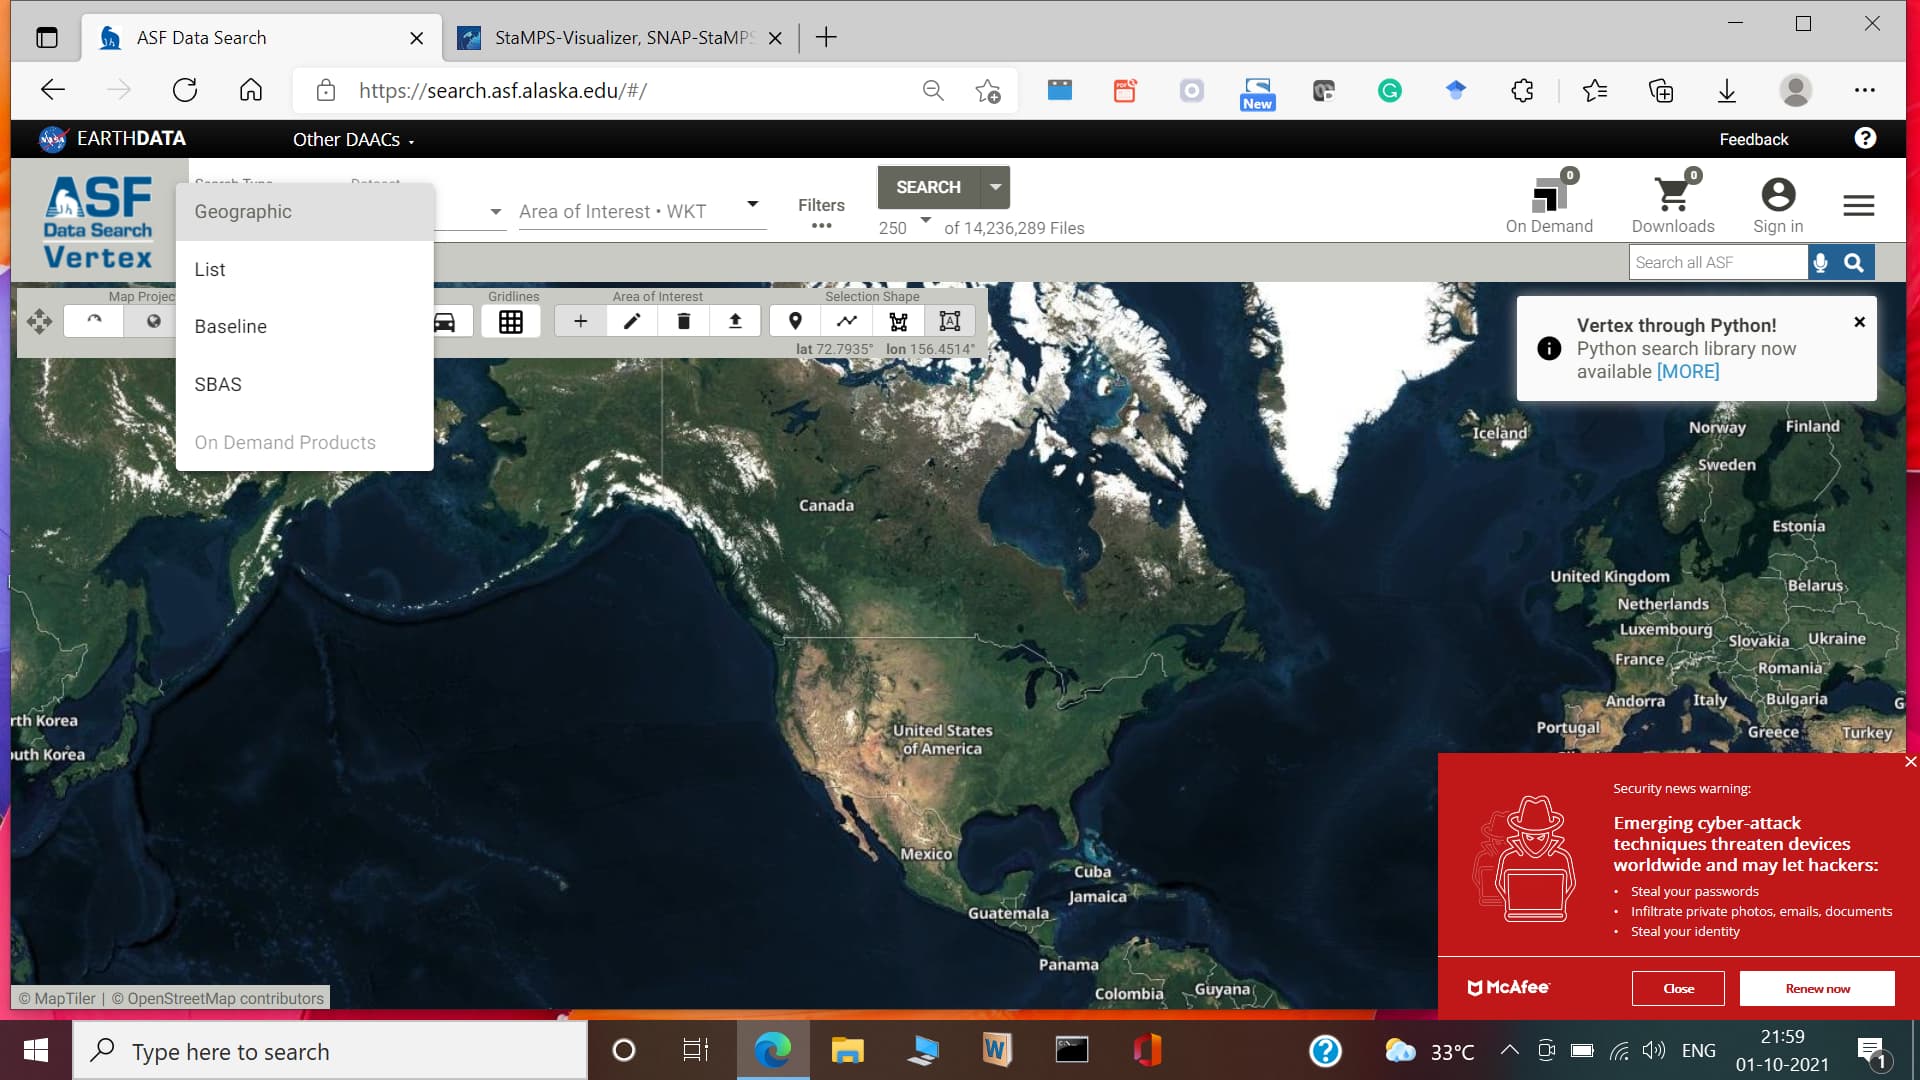
You can do it directly in ASF vertex website.
Select your area SAR images, then select the Baseline plot as shown below figure. You have to select a master image, based on that Baseline plot will generate.
3 Likes