hi @Ramos ,
please go to this repository and follow the installation instructions step by step, especially the package installation with renv, this will solve your problem:
hi @Ramos ,
please go to this repository and follow the installation instructions step by step, especially the package installation with renv, this will solve your problem:
Hello
What is the formula to obtain the mean displacement from the values for each date?
I can’t understand how the final velocity value: mm / year is obtained
All the best
We once discussed this somewhere in this forum, someone provided a good explanation, but I can’t find it anymore.
Check this:
and the next posts especially the last from @weiweian
This is also one of the best post from Thho. Please check it once
thank you @thho - this were the posts I had in mind. 
hi @despina98
Not sure but if the installation of R v3.6 is successful, there is a good chance that everything works out fine.
@thho the installation of R v3.6 is successful,but But when I call the Run App. The software opens but closes immediately and this warning appears:
R version 4.1.1 (2021-08-10) – “Kick Things”
Copyright (C) 2021 The R Foundation for Statistical Computing
Platform: x86_64-w64-mingw32/x64 (64-bit)
R is free software and comes with ABSOLUTELY NO WARRANTY.
You are welcome to redistribute it under certain conditions.
Type ‘license()’ or ‘licence()’ for distribution details.
R is a collaborative project with many contributors.
Type ‘contributors()’ for more information and
‘citation()’ on how to cite R or R packages in publications.
Type ‘demo()’ for some demos, ‘help()’ for on-line help, or
‘help.start()’ for an HTML browser interface to help.
Type ‘q()’ to quit R.
shiny::runApp(‘D:/stamps_visualizer_01beta/stamps_visualizer_01beta’)
Loading required package: shiny
Attaching package: ‘lubridate’
The following objects are masked from ‘package:base’:
date, intersect, setdiff, union
Listening on http://127.0.0.1:4006
Warning: Error in library: there is no package called ‘colorRamps’
52:
Error in library(colorRamps) : there is no package called ‘colorRamps’
Have you tried installing the colorRamps package in R (use the menu in Rgui or on the command line: install.packages("colorRamps"))?
I want to install StaMPS_Visualizer on Windows 7 and open the CSV file in it. I have also installed R and RStudio software. Can anyone please send me StaMPS_Visualizer Package?
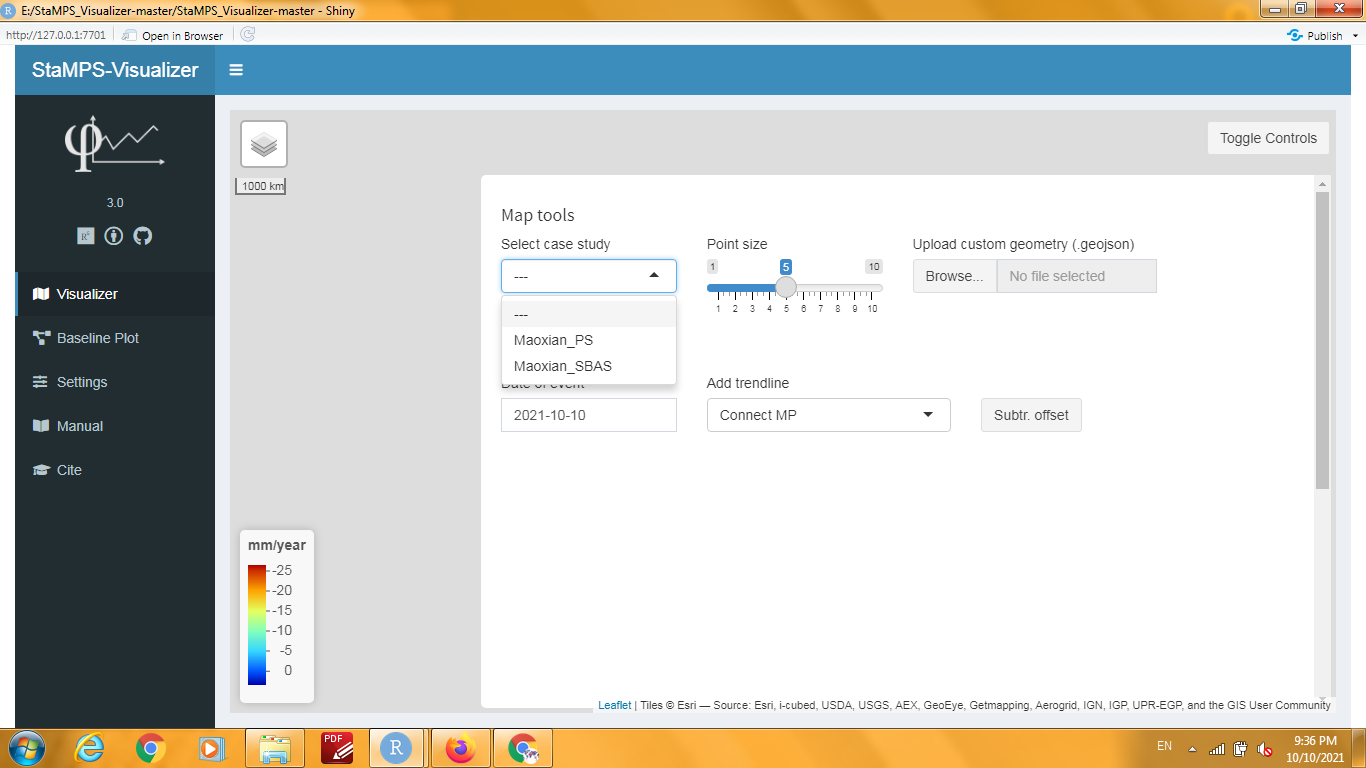
Hi @despina98, from your screenshots, I can see that you use the first version of the visualizer which is outdated. Please go to this repo, clone or download the content and follow the installation instruction given also for Windows closely. I recommend installing all necessary packages with the renv method which is descried in the aforementioned installation guide:
Also, you will find instructions in the manual of the visualizer how to properly import your own data.
Dear @thho , Thanks for your good response, I followed all your instructions,Now how do I add my area to Visualizer? Why is it not seen here even though I copied it??
hi @despina98, please provide:
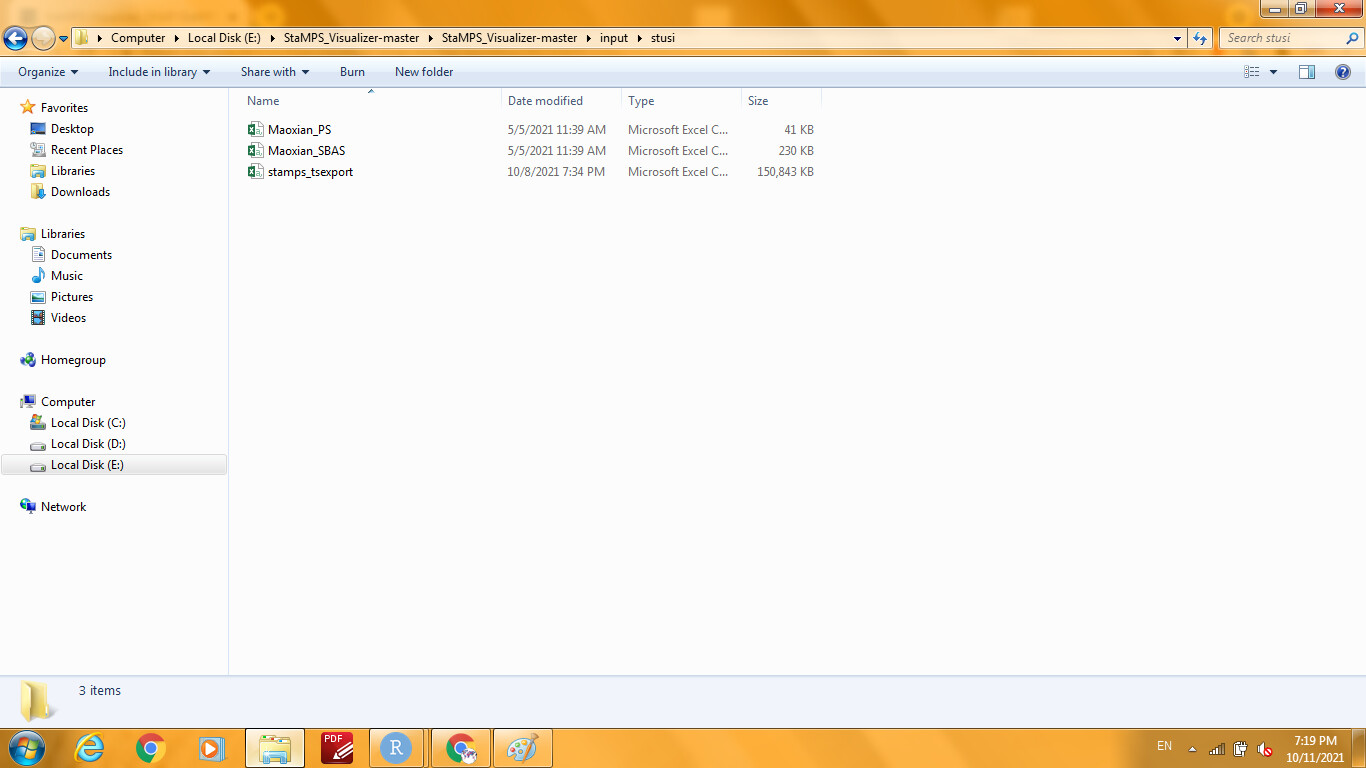
input/stusi/ folder where you have copied your .csv fileAlso be sure to restart the app after you have moved the .csv file to the stusi folder. At statup , the app checks this folder and adds new examples
hi @thho , I put the folder related to my .csv file below:
I fixed this problem but the file does not open؛
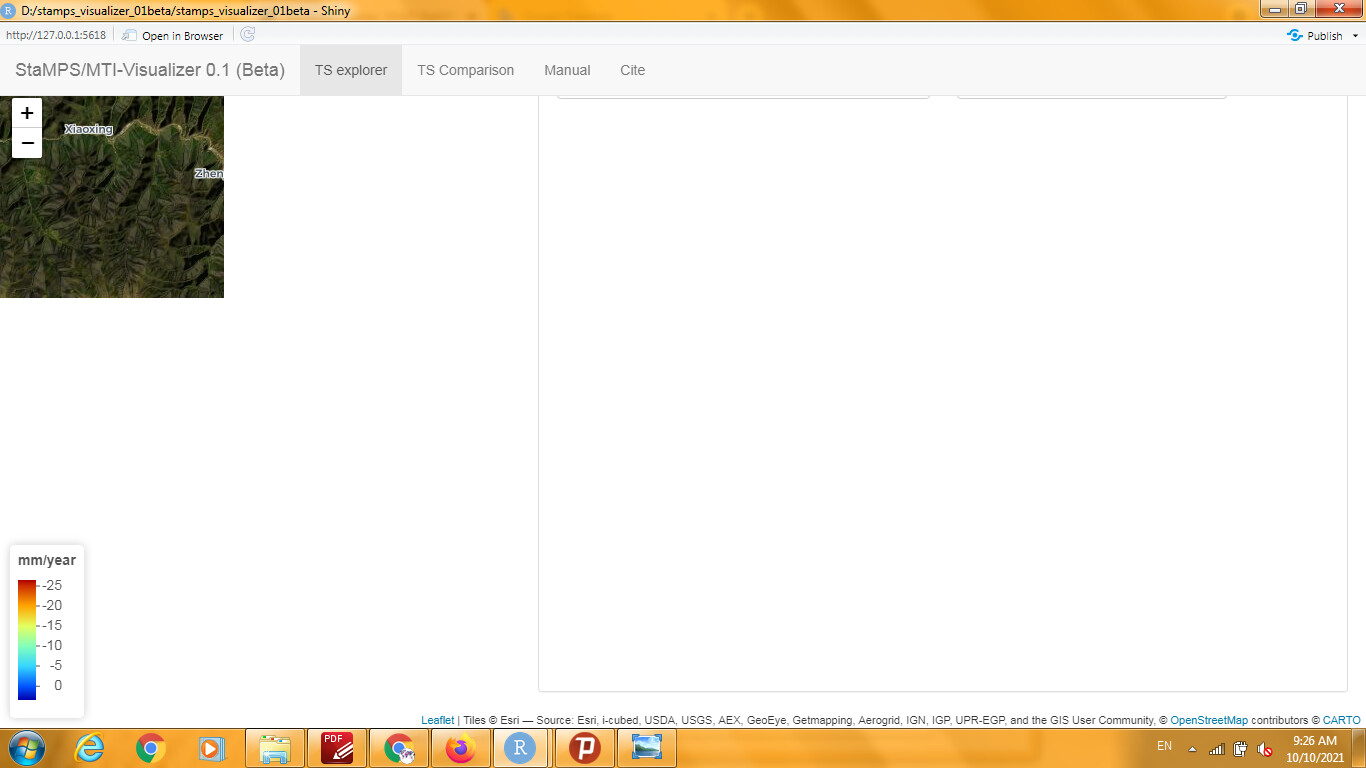
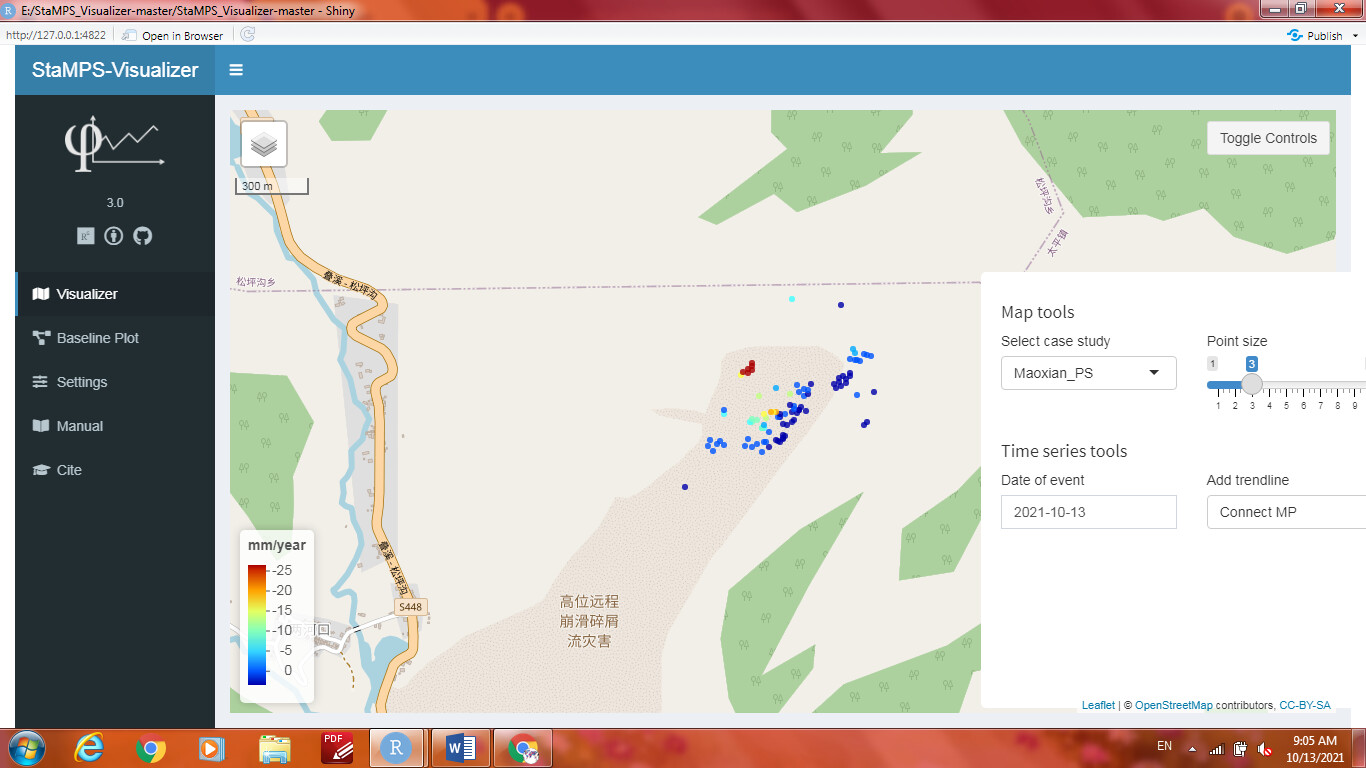
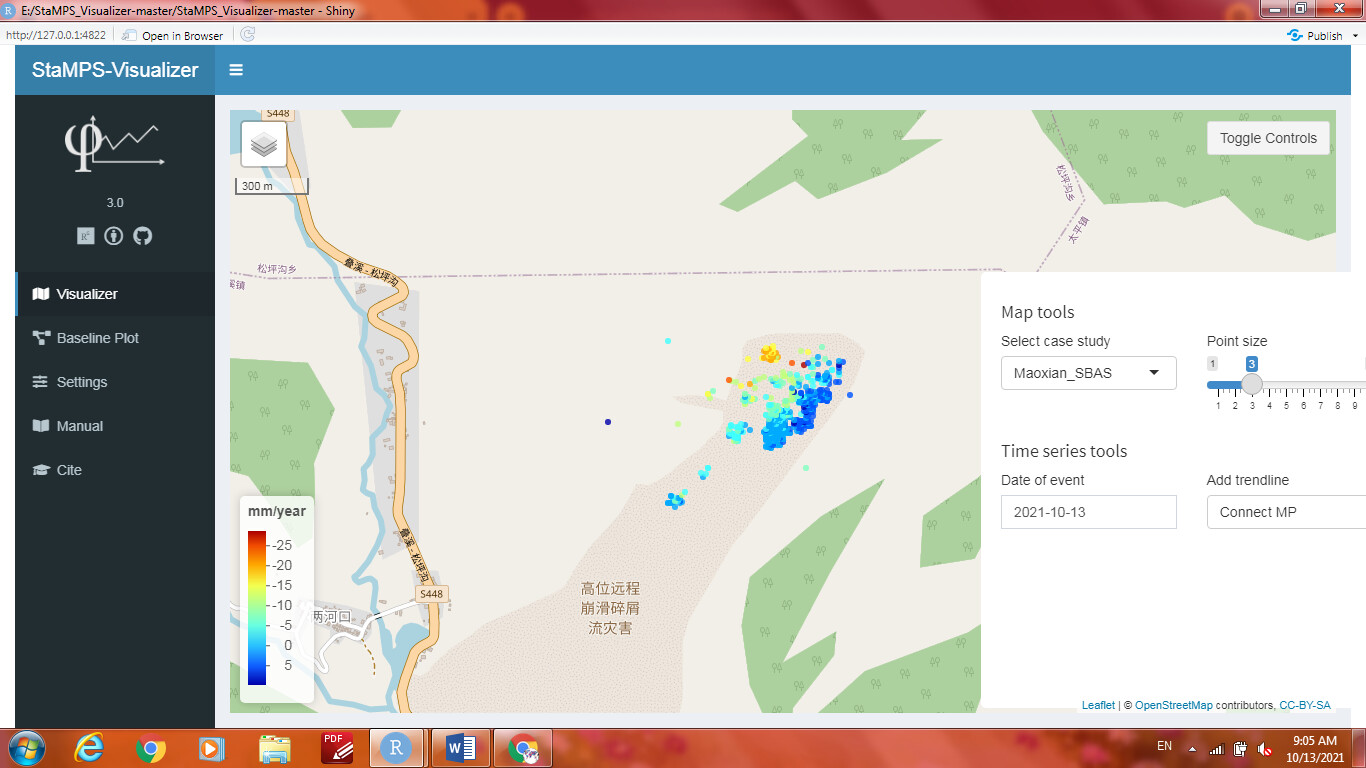
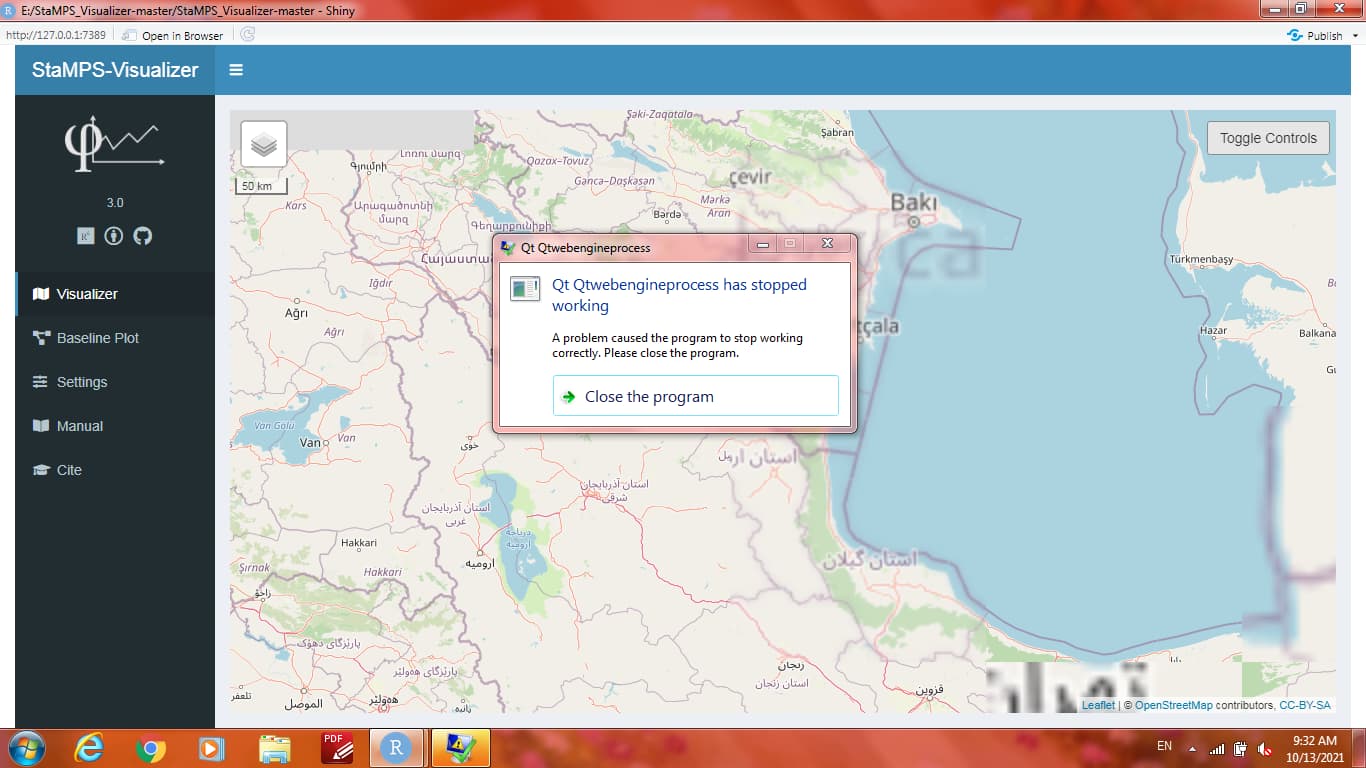
Hi @despina98 , since nothing is shown in your map canvas, neither your points nor base map, the problem may be related to your windows 7 installation. Does the problem also appear when you select the demo data of the Maoxian case study?
Ah one second! You do not have any internet connection right? That is necessary for the WMS tiles to be loaded. Please connect to the Internet and try again. It can also Be that your points appear beneath the control panel, just pan on the map canvas or disable the control panel by hitting the “toggle controls” in the upper right corner
hi @thho , No, this problem only appears when I open my case study file. There is no problem with the demo file.
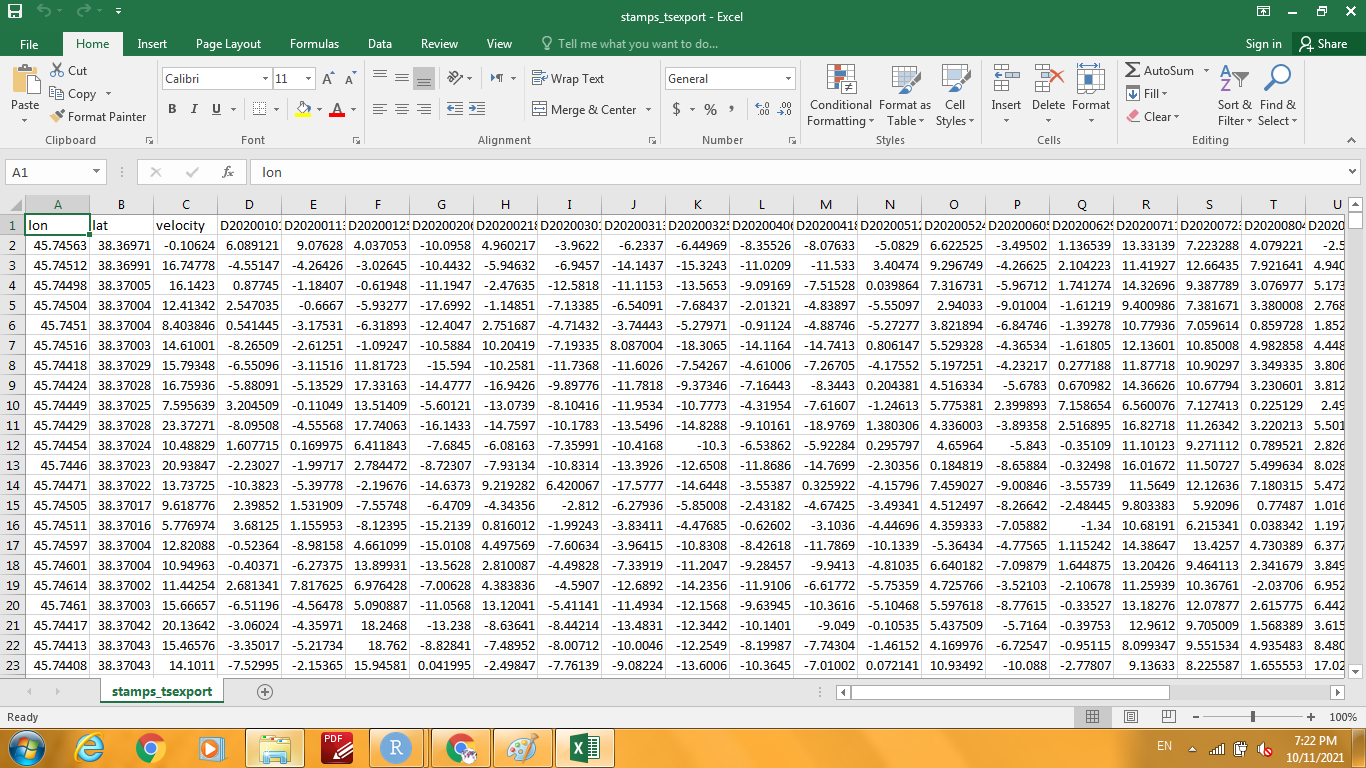
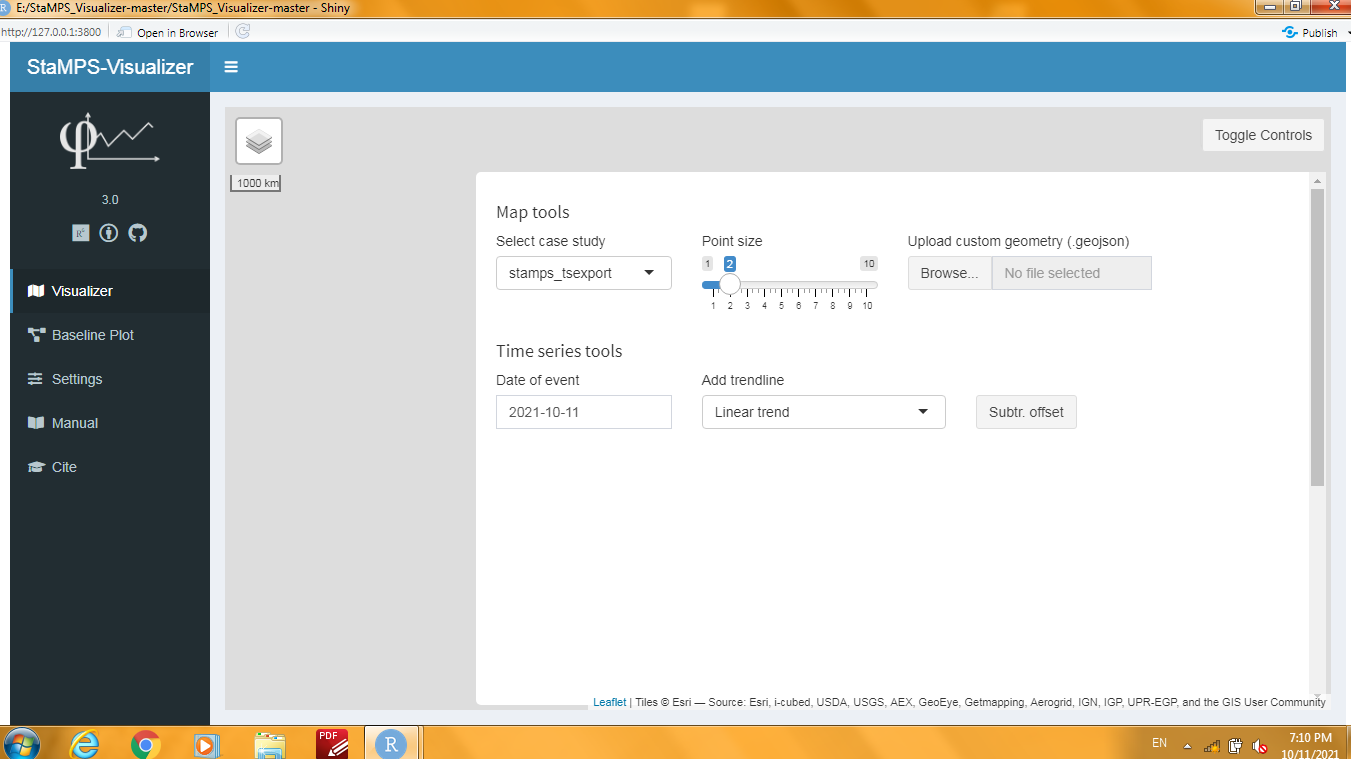
 How can I open the csv file of my case study area?