I think your CSV file size is large, just try with a small area. For that select radius less than 10km or less than that in ps_plot(‘v-do’,‘ts’) command
1 Like
Hello suribabu,
Please give some hints about where I could get the baseline plot. I can’t find the baseline_plot button as shown in your picture.

Please have a look at my answer here: Geotiff format - #26 by ABraun
1 Like
Search Type (Top left) It will contain Geographic, List, Baseline, SBAS. Before selecting Baseline just select your area of interest SAR images, then select a master image, Now you just go to search type select Baseline it will plot with respect to the master. ( Note: refresh the page whenever you selected the master)
1 Like
I got it. Thank you so much for your help.
Got it. Thank you so much for your help.
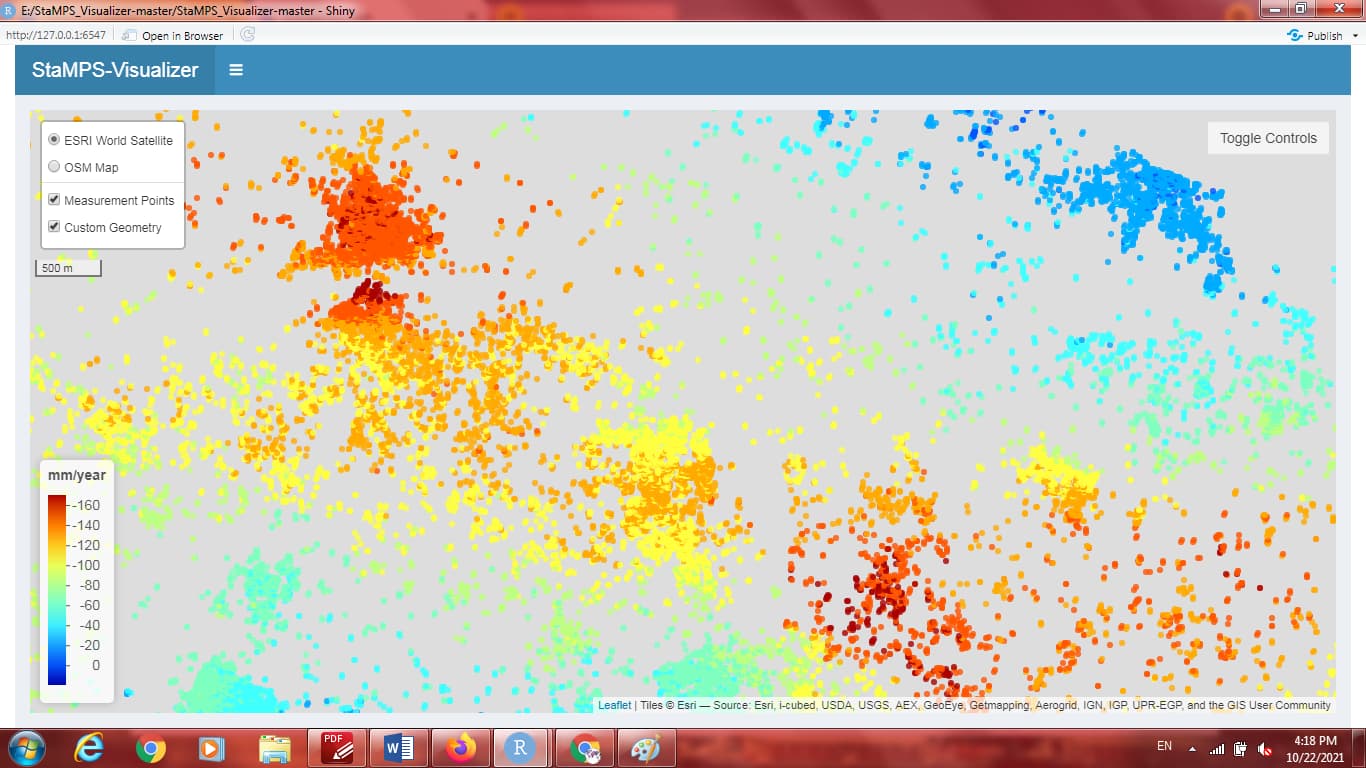
Hi @thho @nachin6789 , Why my Visualizer does not have tabs like TS Explorer and TS comparision like yours? How do I enable them?
And like you does not show the ESRI WORLS SATTLITE option?

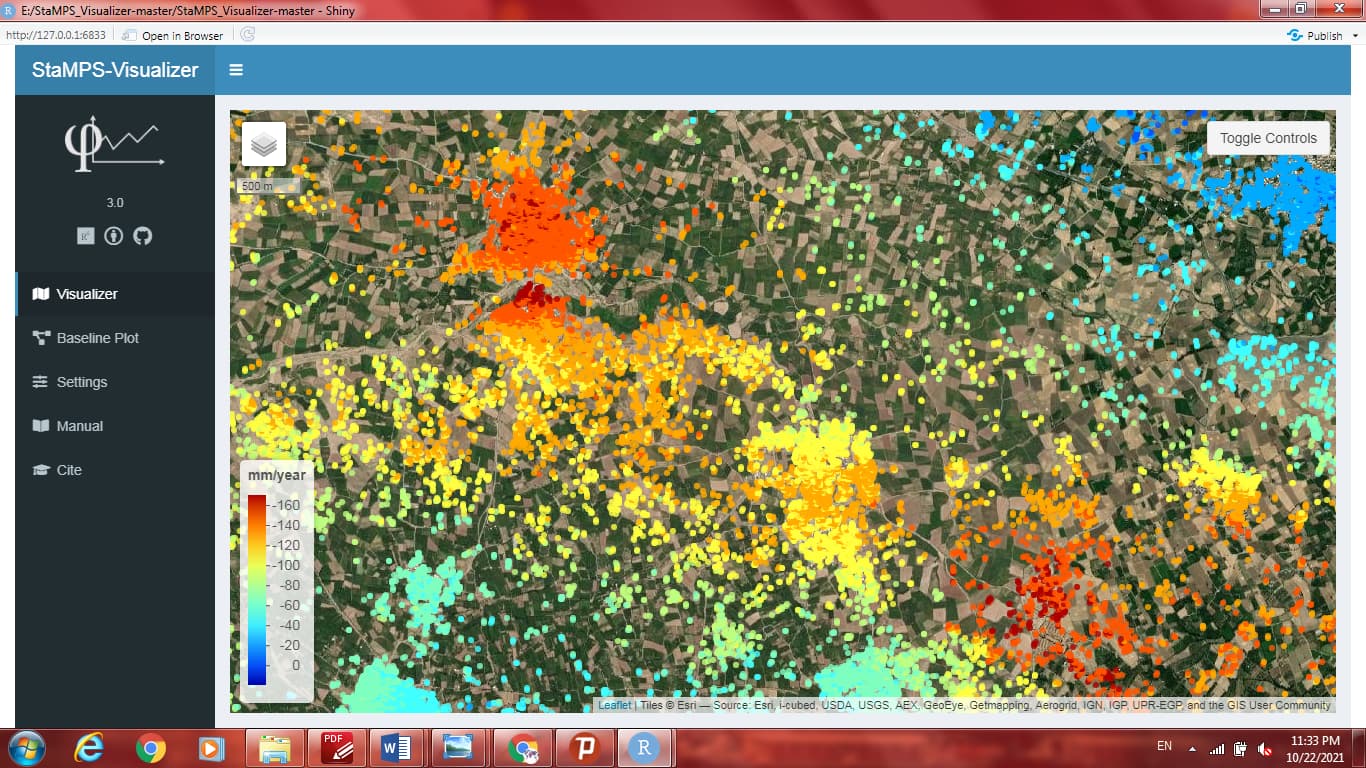
@despina98 you can toggle the tabs menu by clicking the horizontal stripes right to the “StaMPS-Visualizer” app title.
However, the TS Explorer and TS Comparision stuff is outdated and not included in the latest and stable version, which you are using atm
Why the app does not show a base map is hard to tell. When using Windows 10, I can not reproduce the error other than turning off internet connection, but that is not you problem i guess… since I have no Win 7 around, fixing this will be hard. You can try clicking “Open in Browser” and loock if that makes any difference.
@thho , I click “open in browser”, But nothing changed.

@despina98 Sure? I mean you can now see the OSM layer propperly. have you tried to change to ESRI World Satellite in the layers menu upper left corner?
@despina98 also, the ESRI layer will become gray if you zoom too close, but therefore you have to really really zoom very close, which from what I see on the OSM map is not the case.
1 Like
Maybe someone with a Windows 7 system has similar problems and can confirm that it is related to the OS version… I have just checked on Win 10, Ubuntu 14 up to 20 and also the demo server running on shinyapps.io everything works out fine, the ESRI server is also up and providing the tiles. More ideas:
I am not sure where you are in the world, maybe your IP causes an issue and the OSM server provides tiles but the ESRI server does not, if possible you can try to use a VPN?
Sorry, but that is all I have in mind right now.
dear @thho ,I turned on VPN and it worked. The problem is the IP of my country. I am in Iran. Thanks a lot 

2 Likes
Hi @Ramos, please check the version of the Visualizer and StaMPS you are currently using. StaMPS should be 4.X and the Visualizer 3.0
Normally, this known issue has been solved by a fix in Visualizer Version 3.0 and the export script in the manual tab. However, if you use the above mentioned version combination of StaMPS and the Visualizer and the issue still remains, let me know.
1 Like
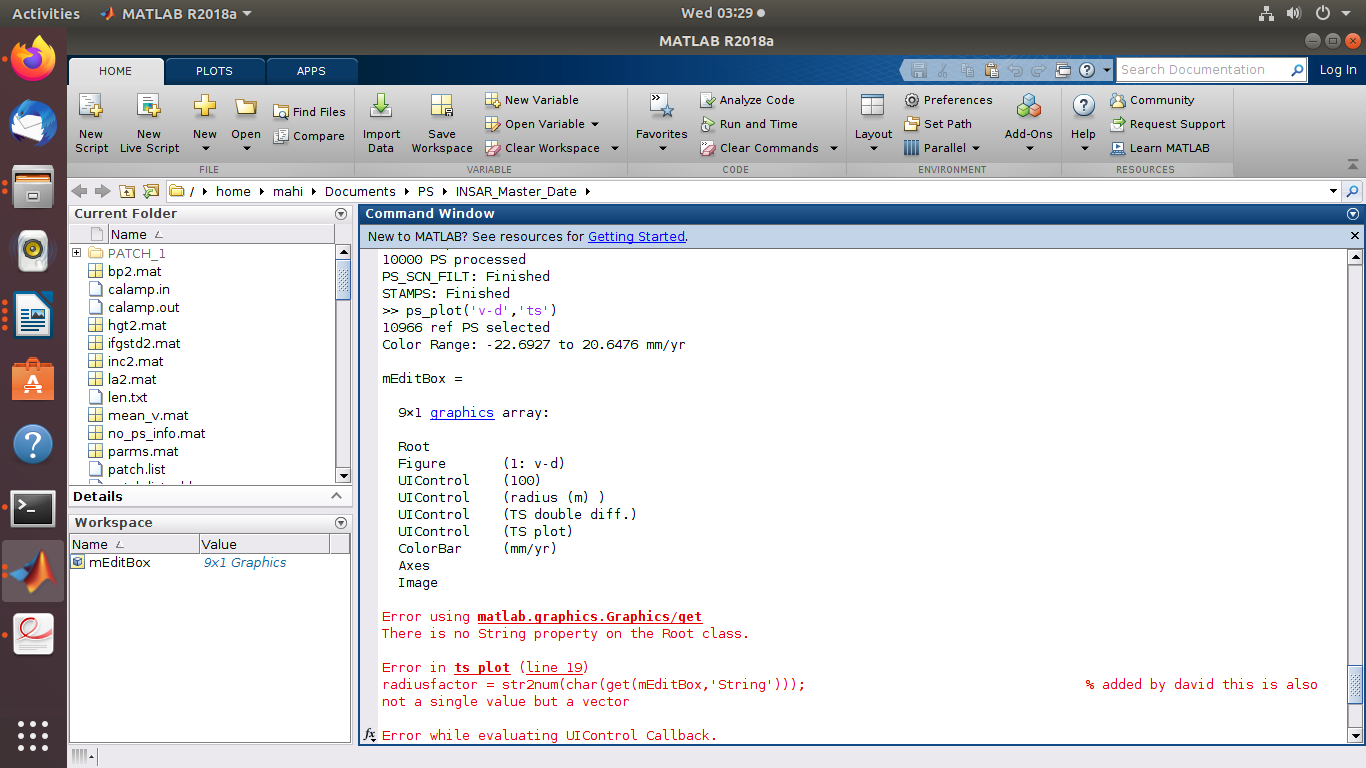
First run ps_plot(‘v-do’,‘ts’), and select the whole area (by selecting the radius is high). Once it will be ok then go for the next step. If any error in this step please update.
2 Likes
good job! 
1 Like
After generating the time series plot using ps_plot(‘v-do’,‘ts’), please select one point (mostly out of study area) using mouse button. Then it will work properly.
1 Like
Better just remove the reference latitude,longitude and radius from setparm(). Instead of assigning like this just use mouse button, select the reference lat long and radius.
1 Like
@Ramos My best guess is, that your reference area contains no PS…hence the list of the ref PS is length 0 and throws an error, try to increase radius to 1000 just to check if that make a difference.