This is from the original image right?? i have done this only and have got a split image of 7 bursts… My doubt is that y i cant further split from the split image rather than the original image…?
Yes,
But why you replicate the same process two times, you could do all at once, as I explained in my example,
From the error you get, I guess this operator is working only with multi sub-swath, to get splited the image to single burst, or multi bursts,
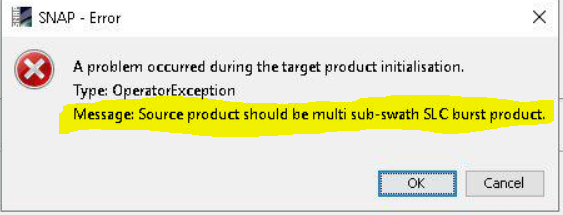
Yes i do understand that, the thing is i dont have my original image and i have only the split image. So i thought of sorting a way to subset or split the split image further, so that i could reduce some time…
But i find now that it is not possible without the original image…
Download again the original image, and if it’s offline you could order it again,
1 Like
yes… that is the only option left with now… Thank you…
to calculate the vertical displacement, should be used the local incidence angle or the angle of incidence from the ellipsoid ?
Hi everyone 
I have finished Stamps (8,8).
But before I visualize the results, I want to limit the area that will be displayed, how to do it?
What command should I use? and would you give an example of the number coordinate format entered in the command?
Thanks in advance 
This should be done in earlier steps in SNAP, By subsetting the AOI,
It can also be done at the plotting stage, just by following the plotting options provided within the ps_plot.m stamps script
Hi @berzata,
If you read StaMPS manual or the ps_plot usage you will find what you are looking for.
No need to start everything from scratch. I think these are good news for you
Some of the plotting options ![]()
BACKGROUND = -1 outputs the data to a .mat file instead of plotting
0, black background, lon/lat axes
1, white background, lon/lat axes (default)
2, shaded relief topo, lon/lat axes
3, 3D topo, lon/lat axes
4, mean amplitude image
5, mean amplitude image, brightness showing through PS
6, white background, xy axis (rotated lon/lat)
PHASE_LIMS = 1x2 vector with colormap limits (or 0 for default)
             defaults to the range of the plotted phase

REF_IFG = number of interferogram to reference to - defaults to 0 (master)
          -1 for incremental referencing

IFG_LIST = list of interferograms to plot - defaults to [] (all)

N_X = maximum number of images to plot per row
      defaults to 0 (find optimum based on image size)

CBAR_FLAG = colorbar flag - defaults to 0 (plot on master, if plotted)
             1 = don't plot a colorbar
             2 = plot a colorbar underneath

TEXTSIZE = size of date text in points - defaults to 0 (best)
           +ve size plots a top (default), -ve size plots at bottom

TEXTCOLOR = 1x3 color vector - default white or black depending on BACKGROUND

LON_RG = longitude range - defaults to [] (whole image)

LAT_RG = latitude range - defaults to [] (whole image)

'ts'   = produce time series plot on user click over velocity plots.
         the position of this switch is not important.
         Note needs to be SM (v-option) of SB inverted to SM
         time-series (V-option)


'ifg i' = only for 'a_p' show the topopgraphy correlated aps correction
          for the ith interferogram for all spatial bands. Note that
          the definition of ifg_list changes the spatial bands for this option.
3 Likes
I feel so relieved 
But, can I limit the area that I will display using shapefile or kml files?
Surely you can, but then it should be you to explore how to use this using matlab commands.
Again, StaMPS has a command call ps_gescatter, that you would like to explore.
I hope this helps.
OK.
In the manual I found a way to determine the subset of areas that I will display for visualization:
but where should I put the longitude and latitude value?
1 Like
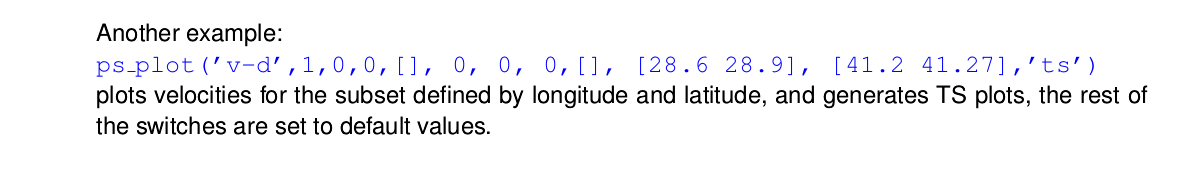
in the example
28.6 is the min longitude
28.9 is the max longitude
41.2 is the min latitude
41.27 is the max latitude
2 Likes
oh i got it, thanks
I worked on the stamps (1,1) to stamps (8,8) yesterday.
then I plot the results the next day, today, and when I open matlab I immediately enter the ps_plot command.
is it permissible if I enter the ps_plot command directly without first entering the stamps (1,1) to stamps (8,8)?
yes, if the data was already processed, you can directly plot.
In the latest version, there is also a variable end_step which tells you to which is the last completed step for each patch.
1 Like
okay, this is my plot with command:
ps_plot(‘v-d’,1,0,0,, 0, 0, 0,, [107.46 107.75], [-6.86 -6.78],‘ts’)
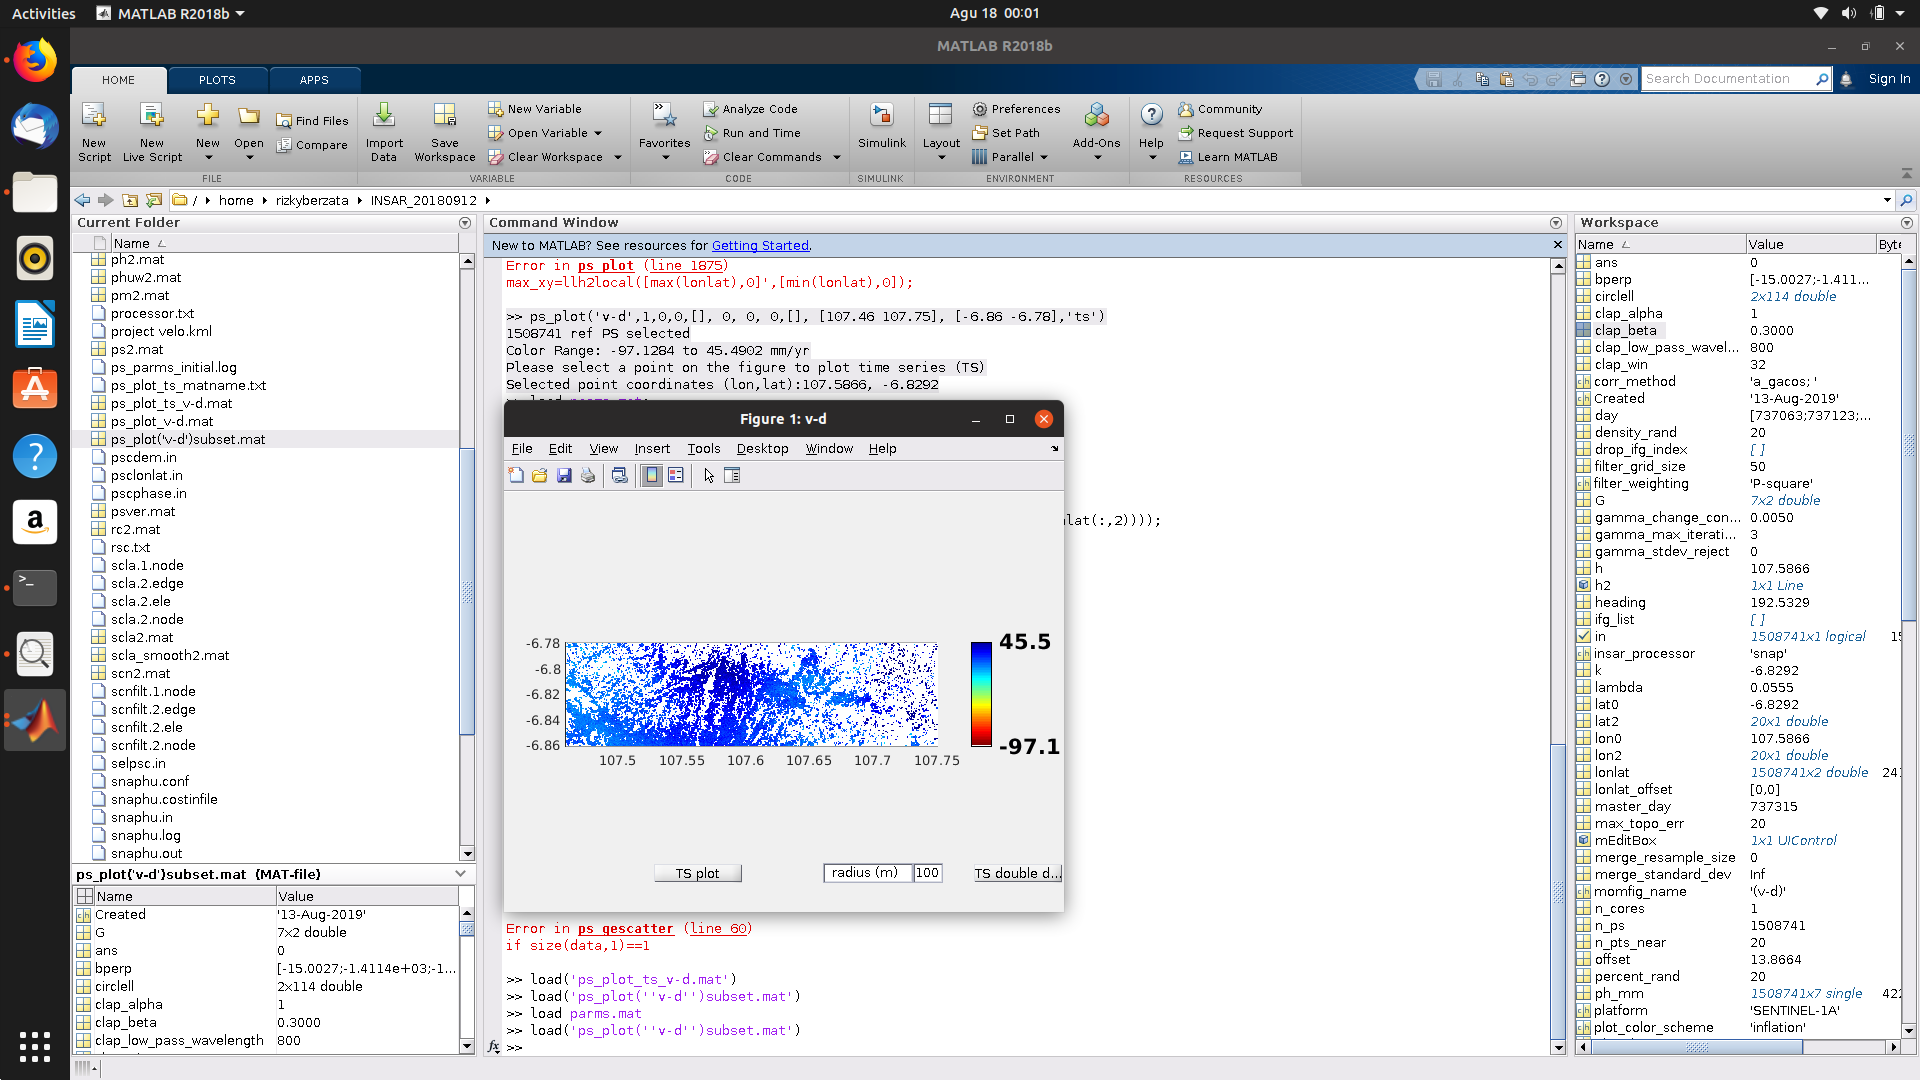
How do I convert it to CSV format?
Hi. I hope you are doing well. I would like to use your developed package but in the step of installing some dependent packages using “install_packages.R”, I faced some errors as follows:
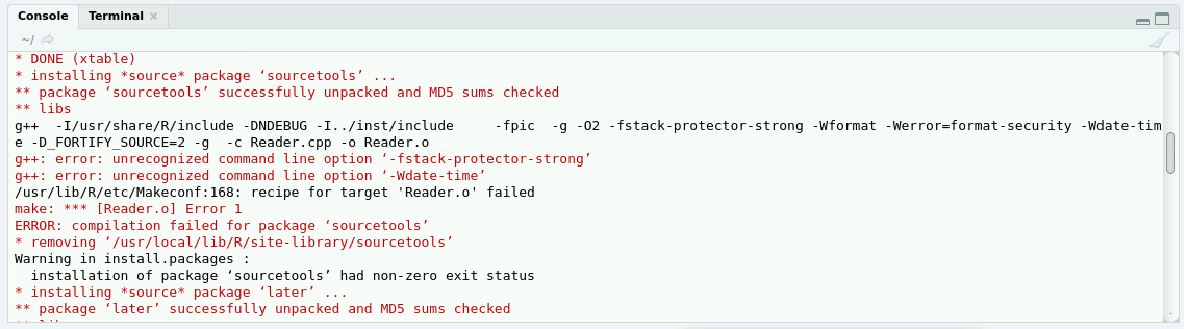
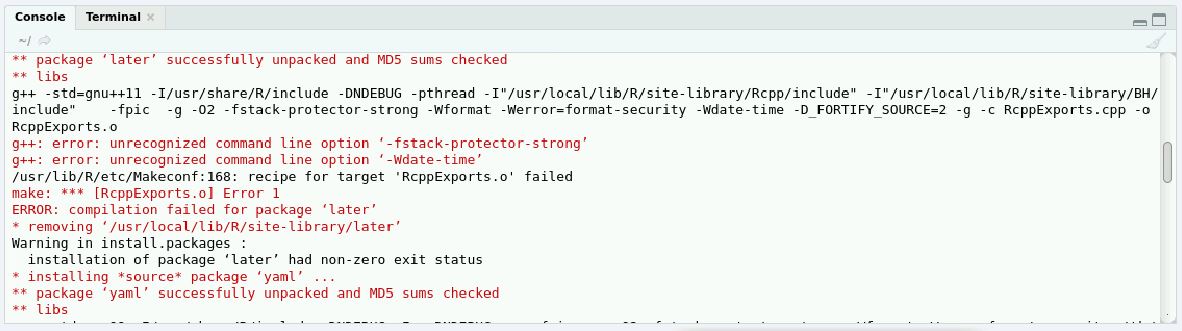
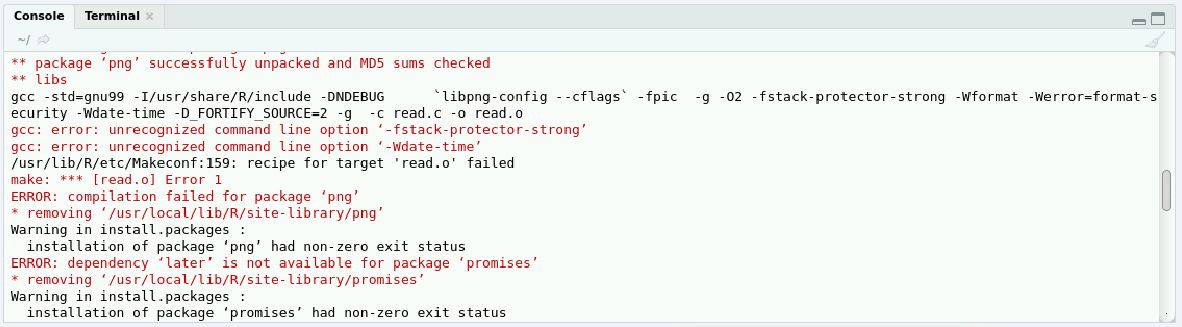
I am a user of a server and going to put and install them in “/usr/local” address.
Could you please guide me to fix them?!
Okay i got it thanks @falahfakhri
After I get the results on Stamps-Visualizer, can I do map-layout on arcgis?
because the results of this study are for the purposes of my thesis.
Thanks in advance