ArcMap can also read csv files if you prepare the column names a bit
Yes of course, it’s possible to to import the CSV file to the QGIS, Please have a look at this post and the posts below it,
@ABraun @falahfakhri OK thanks 
Hello everyone, I have arrived at the step “Matlab Code for exporting a csv table from StamPS 4.1”
But unfortunately I get an error:
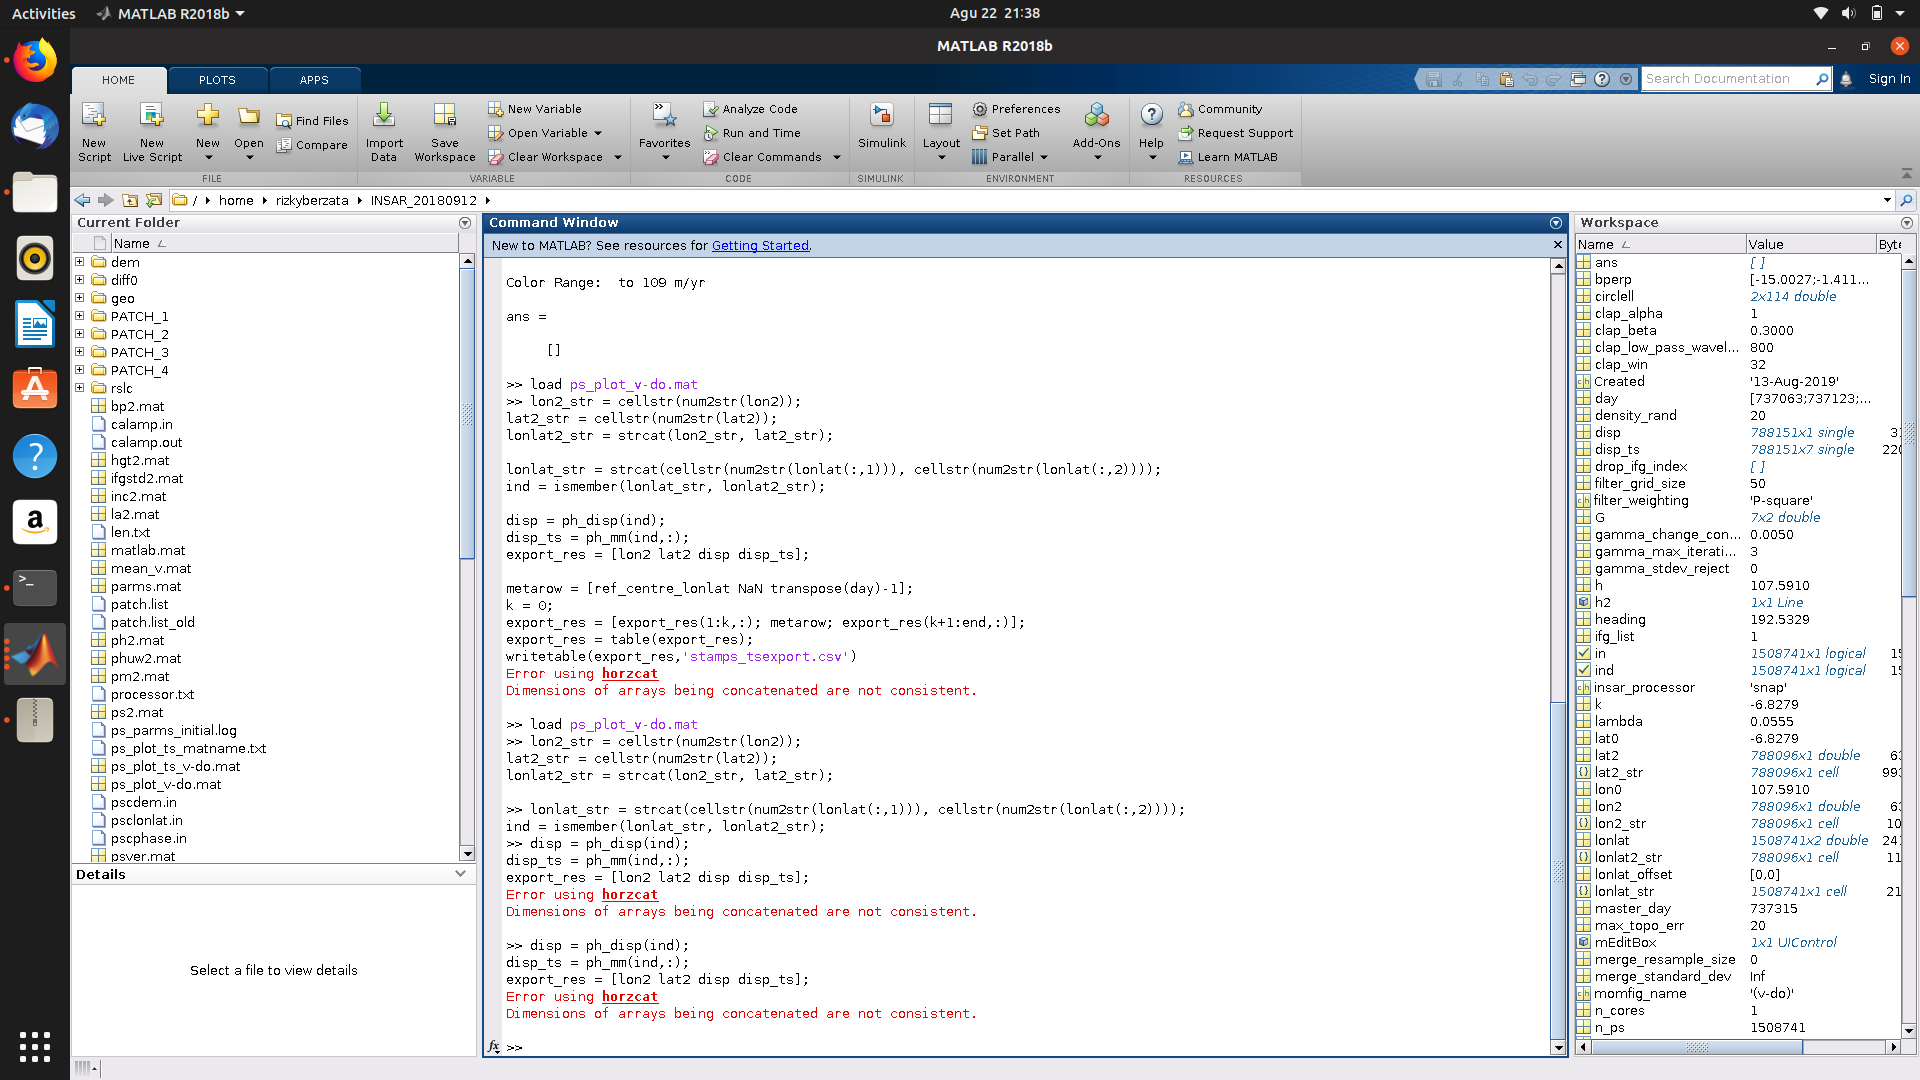
Could you give me a solution please? 
Use this code is written by @thho try up to apply it one by one,
ps_plot('v-do', 'ts');
load parms.mat;
ps_plot('v-do', -1);
load ps_plot_v-do.mat;
lon2_str = cellstr(num2str(lon2));
lat2_str = cellstr(num2str(lat2));
lonlat2_str = strcat(lon2_str, lat2_str);

lonlat_str = strcat(cellstr(num2str(lonlat(:,1))), cellstr(num2str(lonlat(:,2))));
ind = ismember(lonlat_str, lonlat2_str);

disp = ph_disp(ind);
disp_ts = ph_mm(ind,:);
export_res = [lon2 lat2 disp disp_ts];

metarow = [ref_centre_lonlat NaN transpose(day)-1];
k = 0;
export_res = [export_res(1:k,:); metarow; export_res(k+1:end,:)];
export_res = table(export_res);
writetable(export_res,'stamps_tsexport.csv')
1 Like

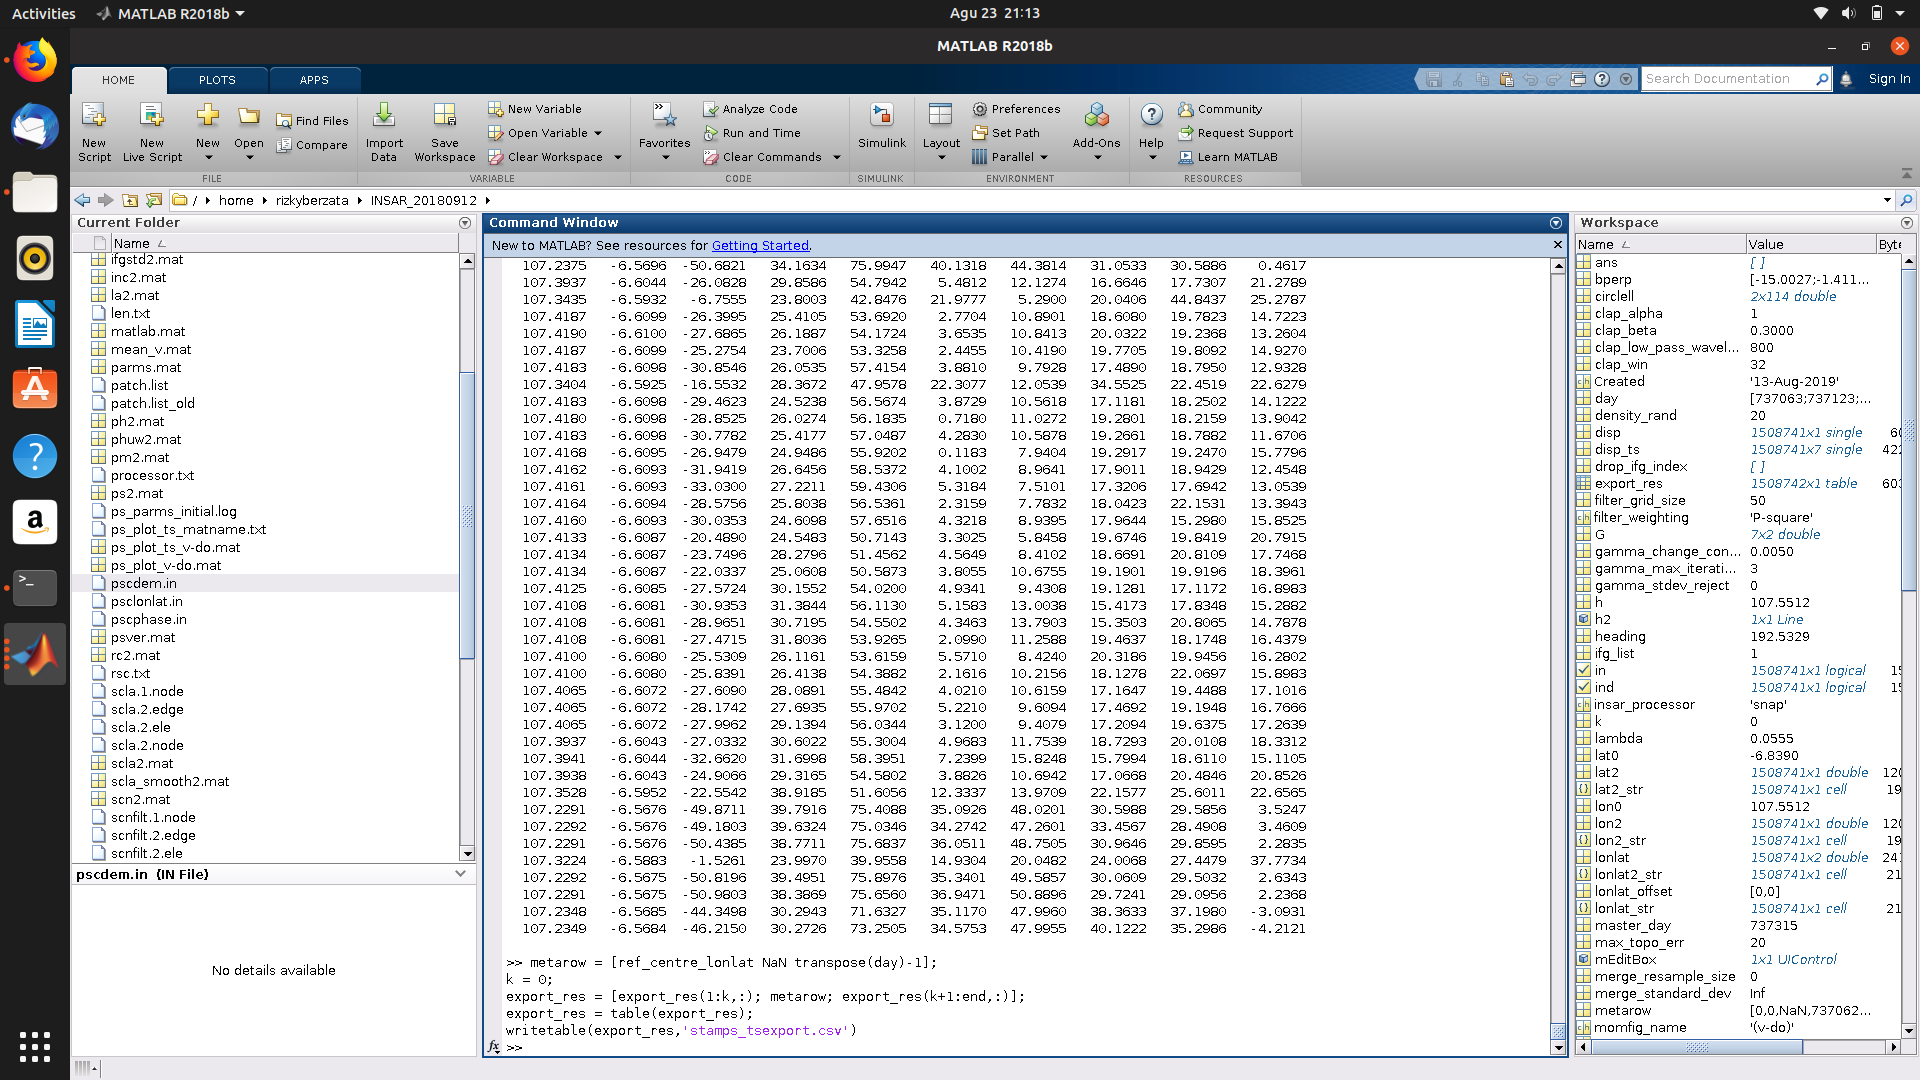
after you did the ts plot and chose a really big search radius, the 1000000 or what we used above, do not execute old code which is in your matlab but really copy paste line by line.
Also this code is written by @thho
ps_plot('v-do', 'ts');
load parms.mat;
ps_plot('v-do', -1);
load ps_plot_v-do.mat;
lon2_str = cellstr(num2str(lon2));
lat2_str = cellstr(num2str(lat2));
lonlat2_str = strcat(lon2_str, lat2_str);

lonlat_str = strcat(cellstr(num2str(lonlat(:,1))), cellstr(num2str(lonlat(:,2))));
ind = ismember(lonlat_str, lonlat2_str);
This block here is really important!
disp = ph_disp(ind);
disp_ts = ph_mm(ind,:);
export_res = [lon2 lat2 disp disp_ts];
and continue with:
metarow = [ref_centre_lonlat NaN transpose(day)-1];
k = 0;
export_res = [export_res(1:k,:); metarow; export_res(k+1:end,:)];
export_res = table(export_res);
writetable(export_res,'stamps_tsexport.csv')
2 Likes
I installed RStudio, but I’m confused for the first step. what is the first thing I have to do?
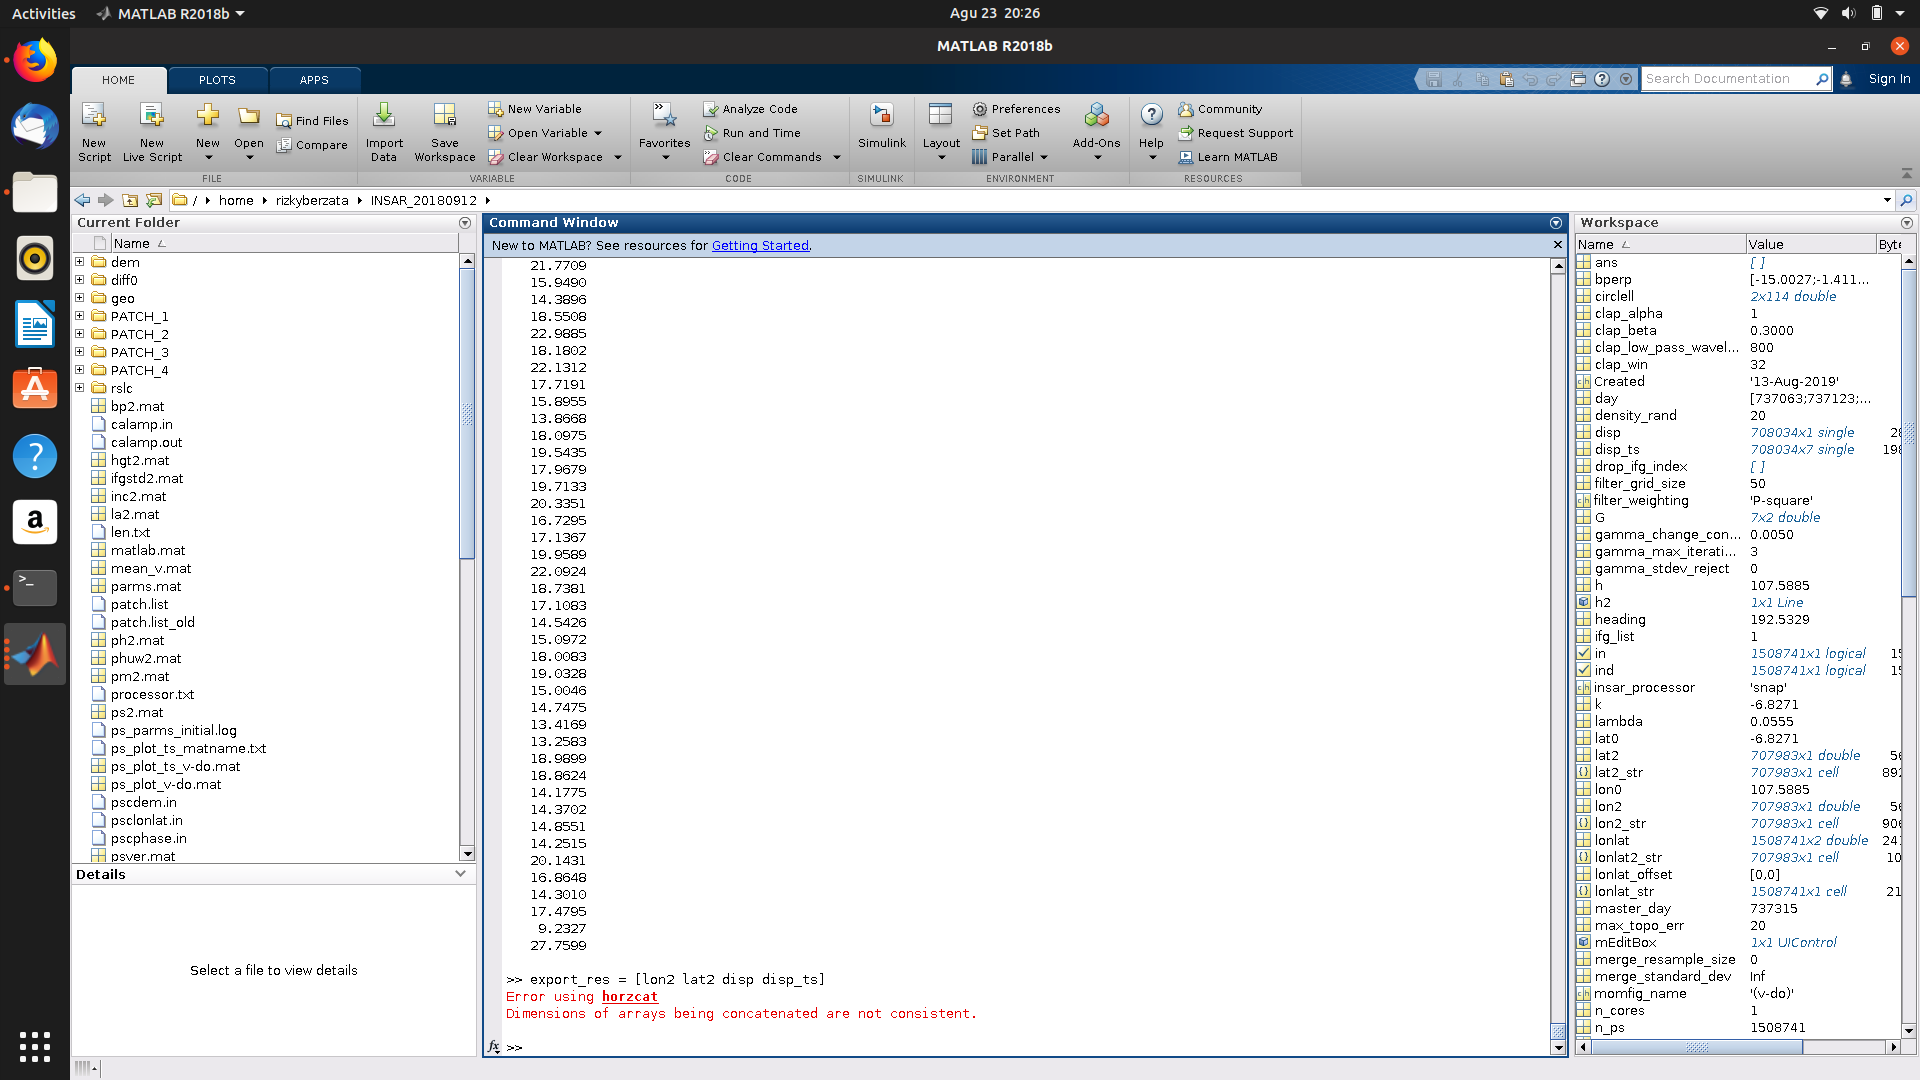
So far i get an error:
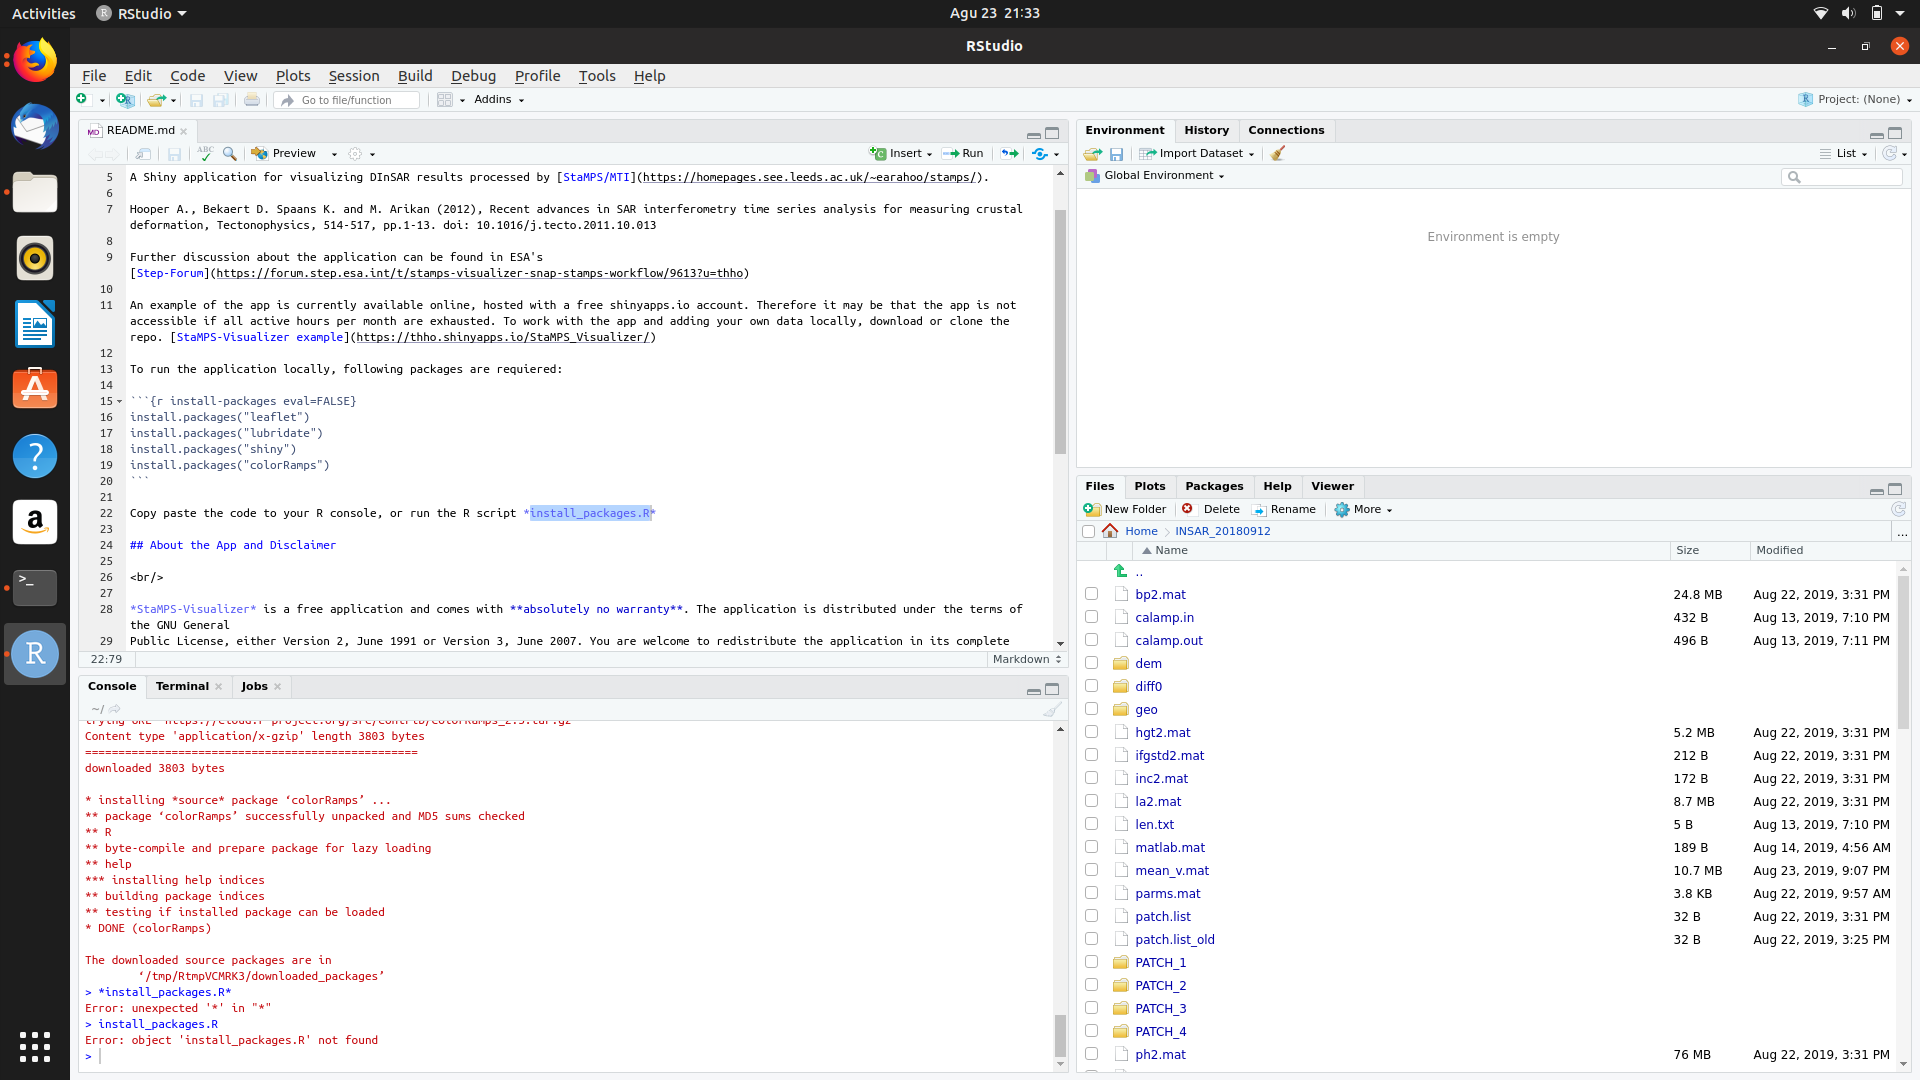
I have follow the manual of StaMPS-Visualizer on the step 1:
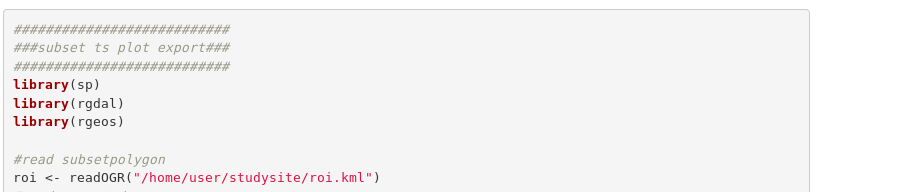
But i get an error:
It said "could not find function “readOGR”.
Could you give me an explanation about this. Thanks in advance
are you sure you have installed all needed packages? To me, it looks like the rgdal package is missing and therefore function readOGR unknown. run the install packages script from the repo.
1 Like
Oh i see. which package do I have not installed? can you provide a link to install the required packages? Thank you.
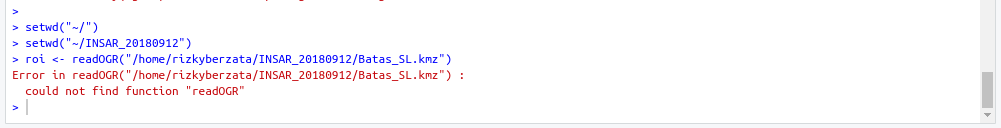
I enter the command “library (rgdal)”, but I get an error.
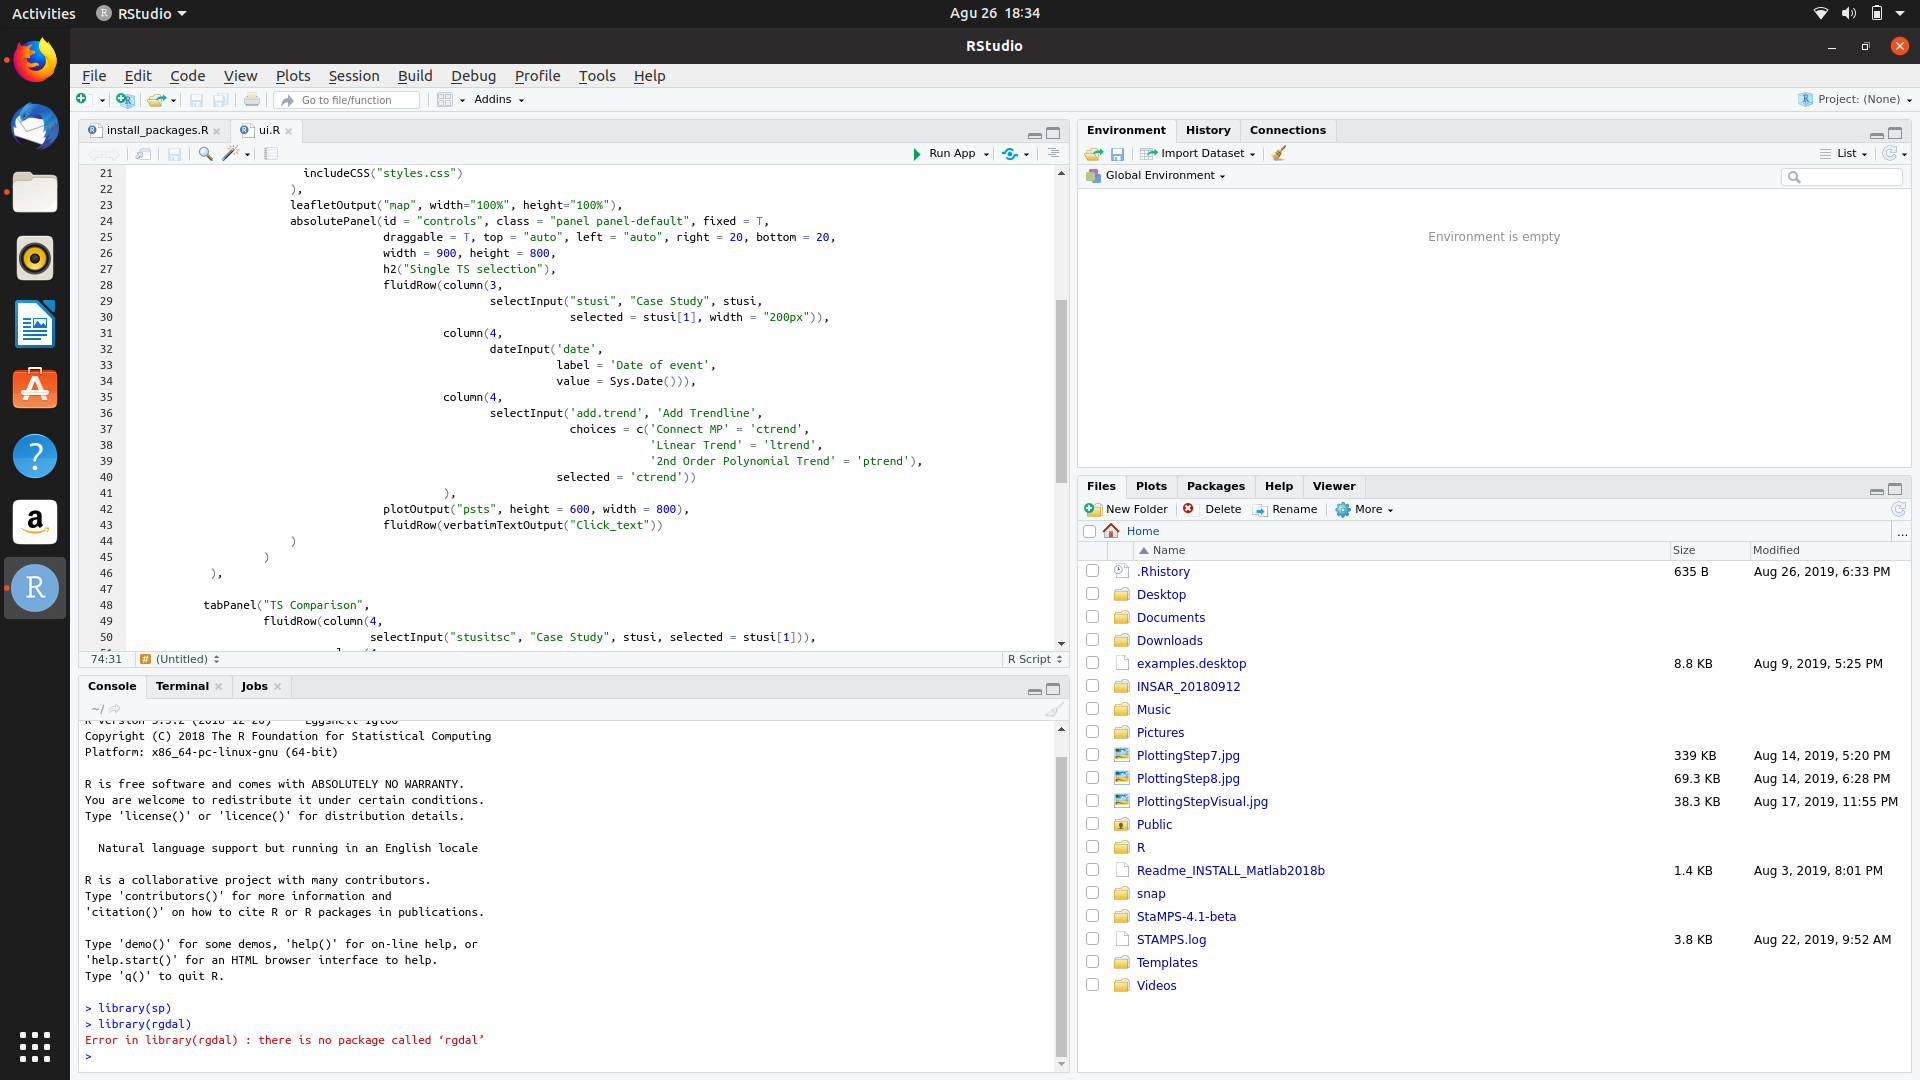
So I install “rgdal” , then i type the “library (rgdal)”.
But i got another error.
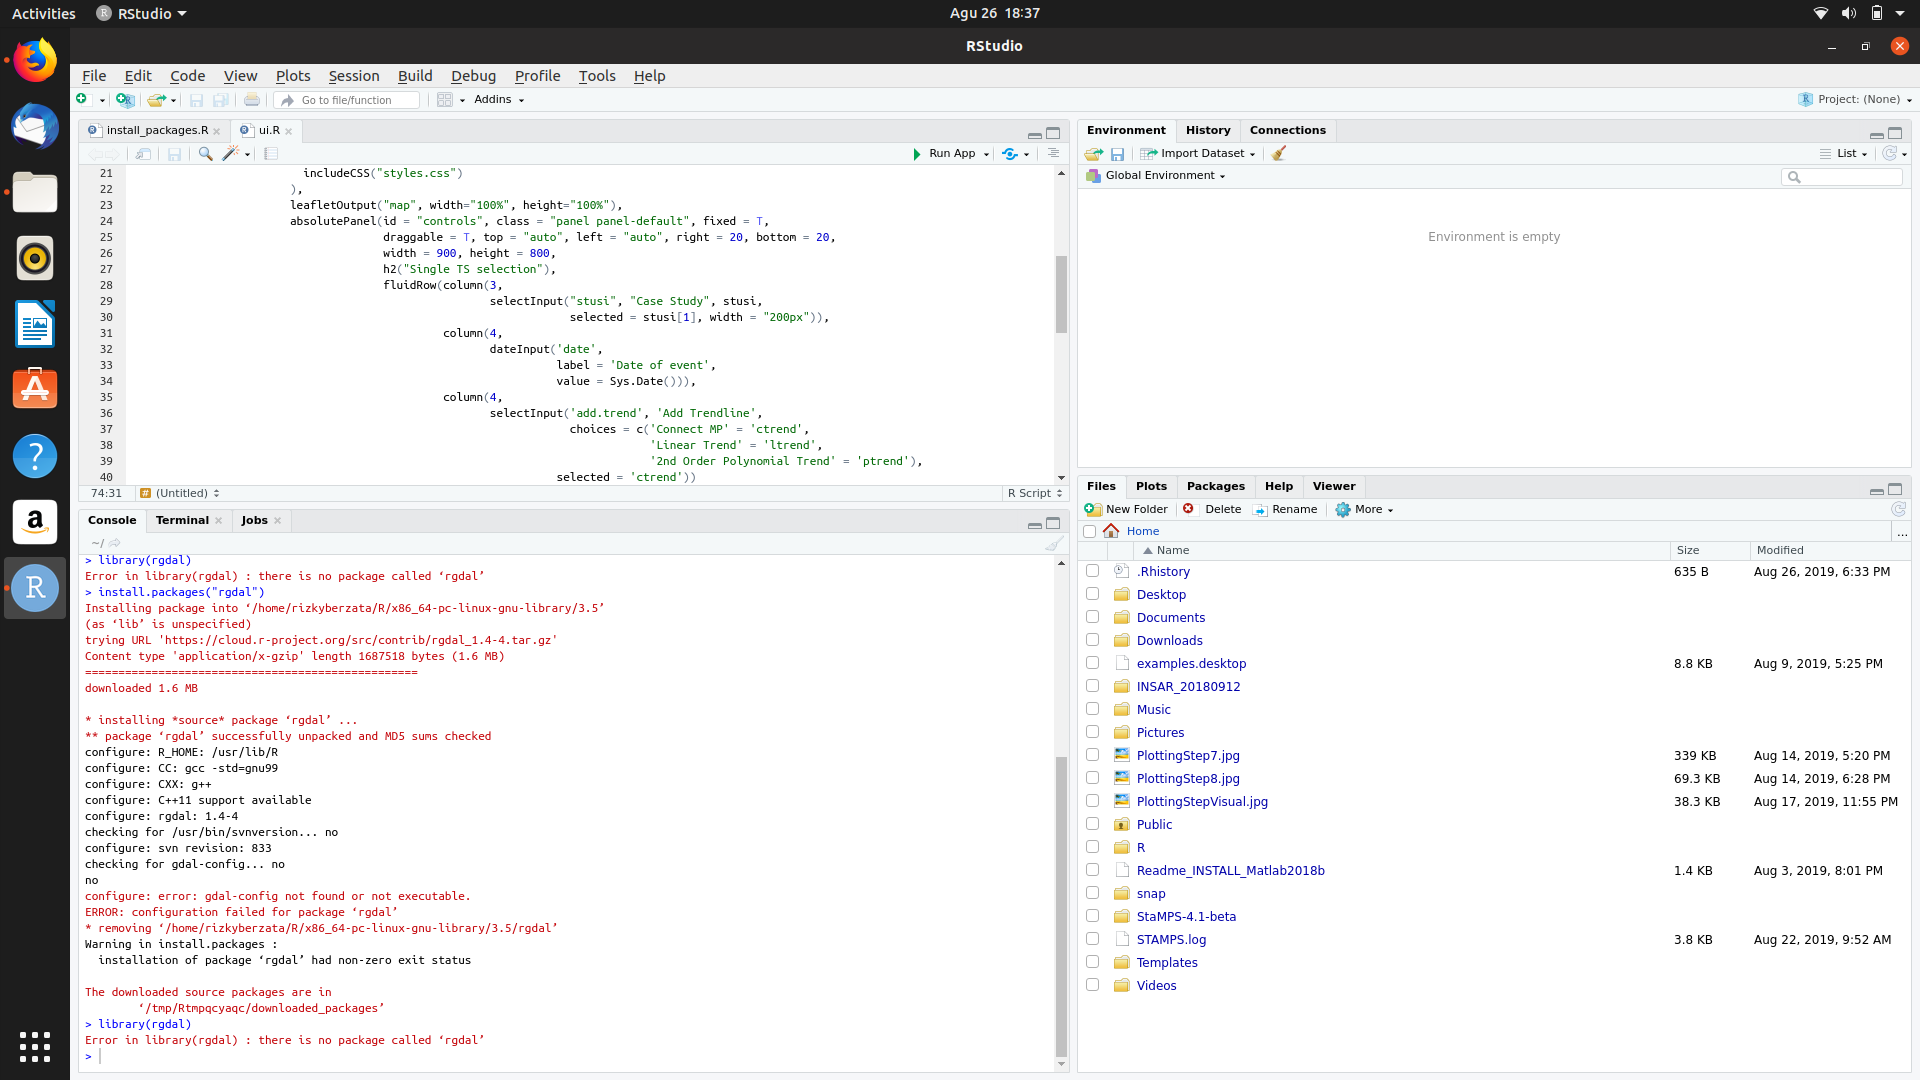
Could you give me a suggestion?
sometimes I am able to use Rstudio`s gui when installtion via command does not work…lower right window, Packages tab–>klick install–>search for rgdal–> klick install
Is my first thought about your error
OK thanks now the sp, rgdal, rgeos has been installed
Now I’m entering the step:
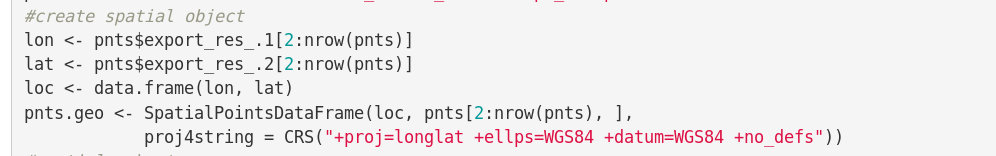
Could you please tell me which part of the command should I edit? 
None, please get familiar with the instructions given in the repo on github or the example linked in the repos read me. Just start the app with the button run app in Rstudio upper left window, everything is reported in the manual.
2 Likes
Thankyou for your help
Finally I got the visualization of my study:
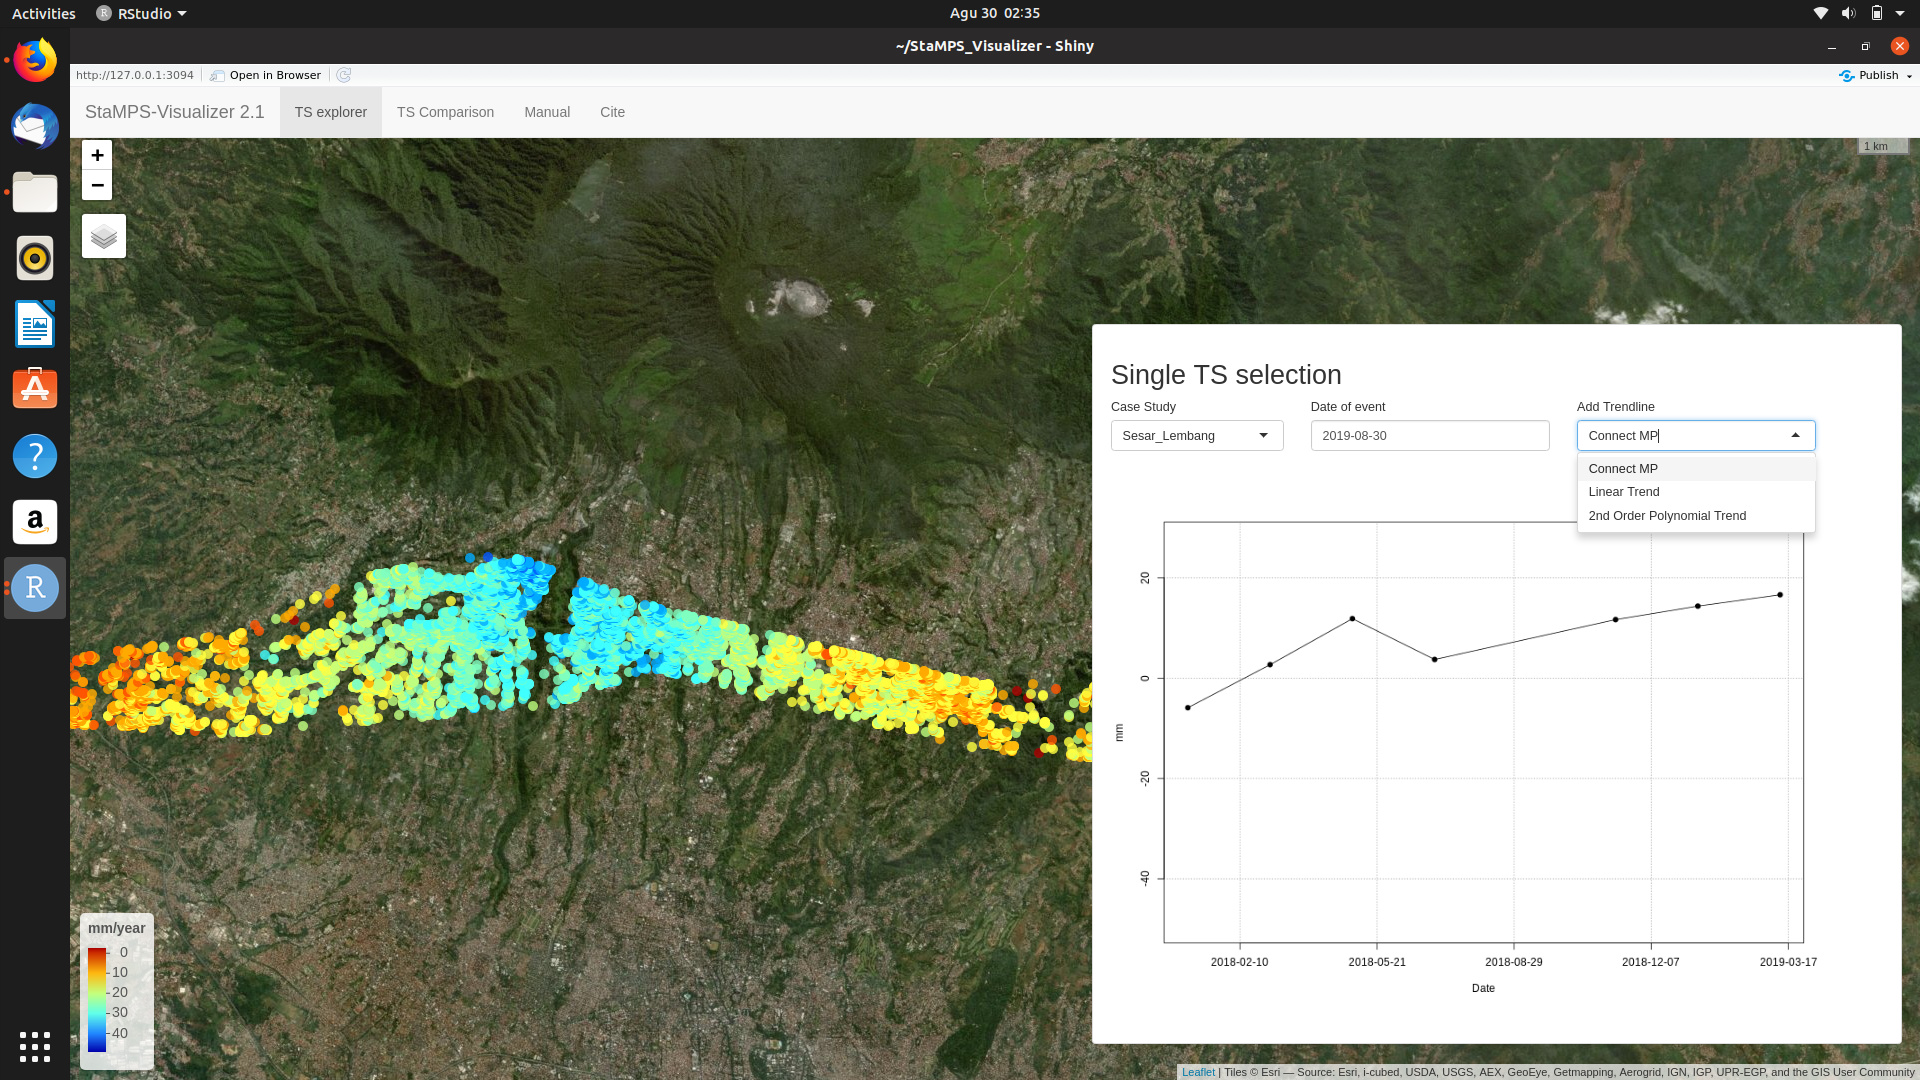
But why does nothing happen on the graph when I change options on the “Add Trendline” button?
And how to find out the average value of deformation that occurs at my PS points?
I hope you never get bored answering my questions 
2 Likes
Hm looks to me, that you have to choose a point first, then changing trend line visualisation works…The default point is somehow random and while programming I thought that you will select a point first, then changing the trend line.
After you have selected a point, the points number is given below the plot, if you want to calculate the mean deformation, you can use this information and look for the data in the csv table. you can then do with the data whatever you want…eg calculating the mean
So the graph doesn’t show the trendline of my whole PS point?