Thank you so much for your great suggestions and hints about my system  Maybe, I try to use it in another free system, which has gcc 4.9 or later.
Hi everyone,
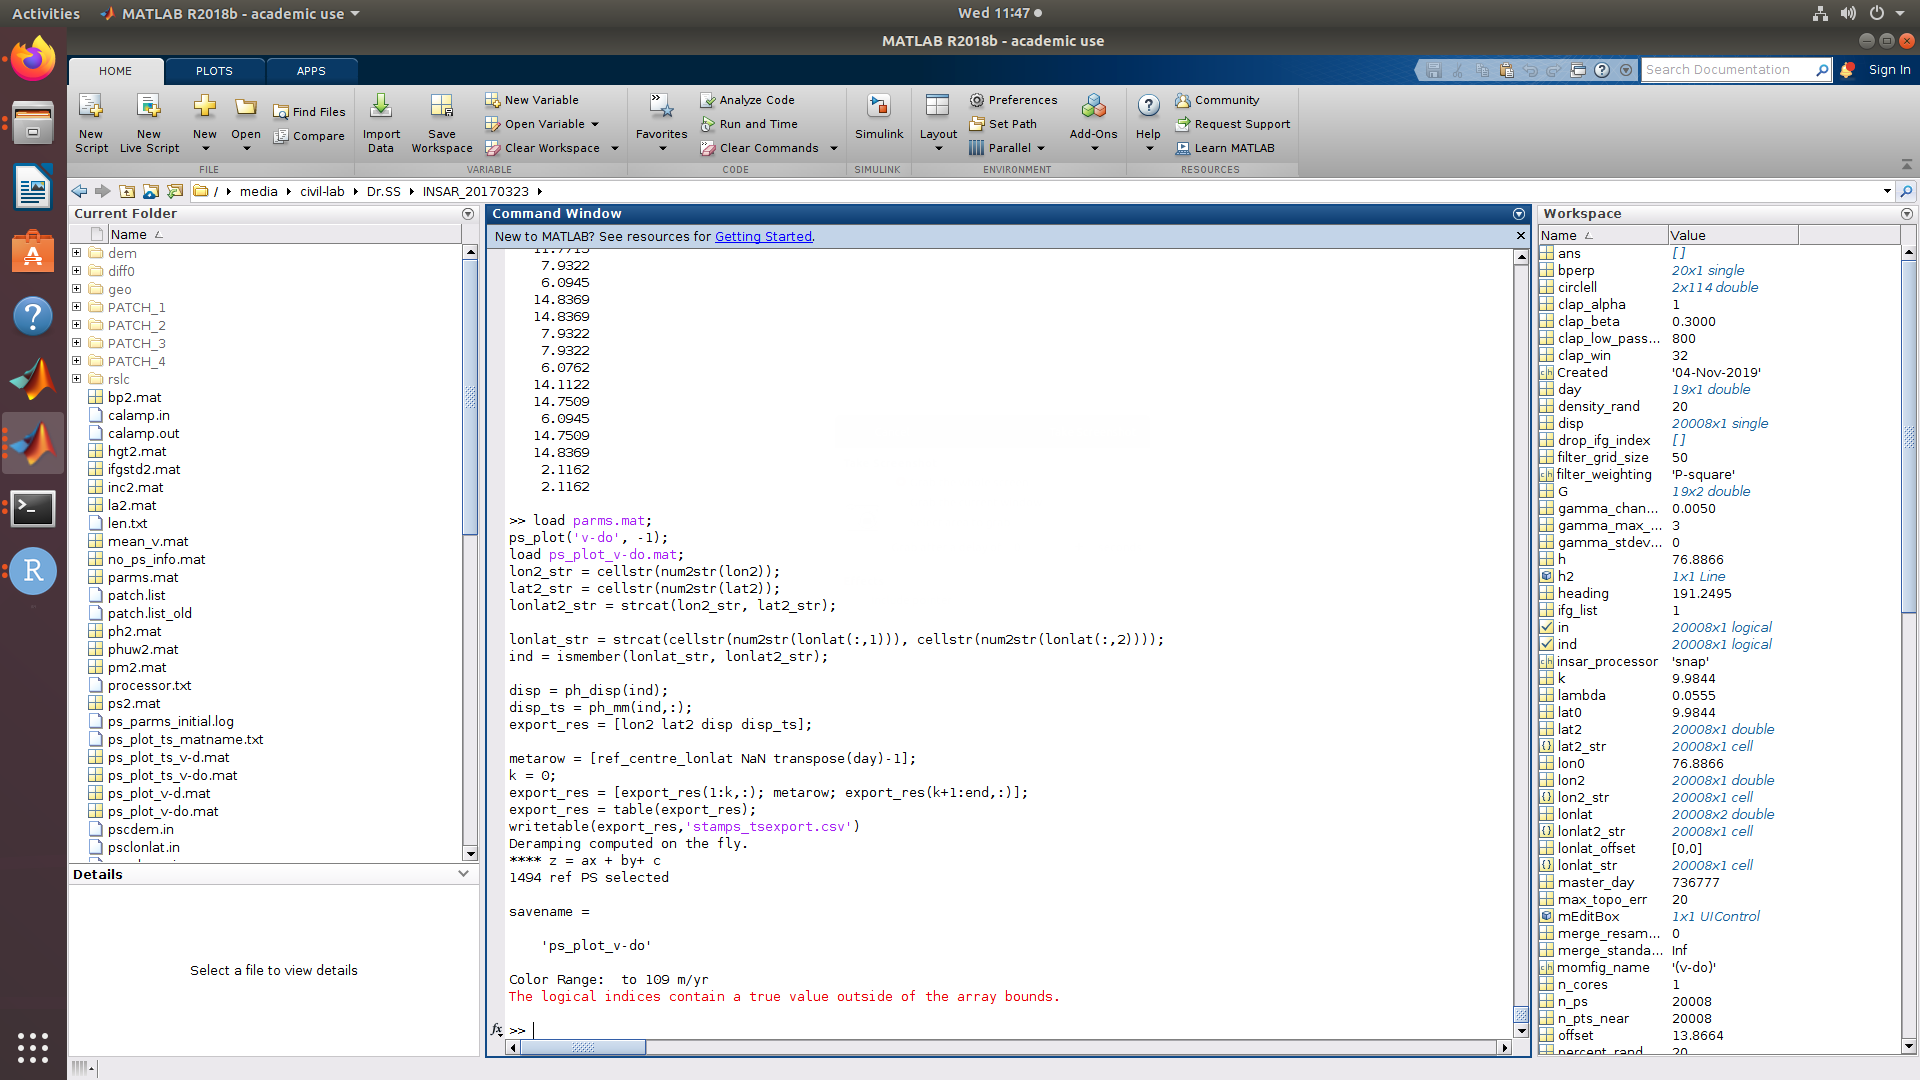
I get an error in matlab as:
"The logical indices contain a true value outside of the array bounds"
I get this error while i try to create a csv file.
Could anyone suggest me a solution for it please @thho @ABraun
Please give a trail of this code is written by @thho
ps_plot('v-do', 'ts');
load parms.mat;
ps_plot('v-do', -1);
load ps_plot_v-do.mat;
lon2_str = cellstr(num2str(lon2));
lat2_str = cellstr(num2str(lat2));
lonlat2_str = strcat(lon2_str, lat2_str);

lonlat_str = strcat(cellstr(num2str(lonlat(:,1))), cellstr(num2str(lonlat(:,2))));
ind = ismember(lonlat_str, lonlat2_str);
This block here is really important!
disp = ph_disp(ind);
disp_ts = ph_mm(ind,:);
export_res = [lon2 lat2 disp disp_ts];
and continue with:
metarow = [ref_centre_lonlat NaN transpose(day)-1];
k = 0;
export_res = [export_res(1:k,:); metarow; export_res(k+1:end,:)];
export_res = table(export_res);
writetable(export_res,'stamps_tsexport.csv')
after giving this block of code i get the same error as
Please apply them line by line,
1 Like
with the execution of the first line:
disp = ph_disp(ind);
itself i am getting that error
Did you start from the fist line, or did you continue?
Please apply then again from the first line
ps_plot('v-do', 'ts');
To the last one,
writetable(export_res,'stamps_tsexport.csv')
One by one,
In case any error, might be the best one is @thho
Because this script is working fine for me,
i tried new from the beginning and it is working now while i gave the codes line by line…
Thank you so much @falahfakhri
1 Like
Hi all,
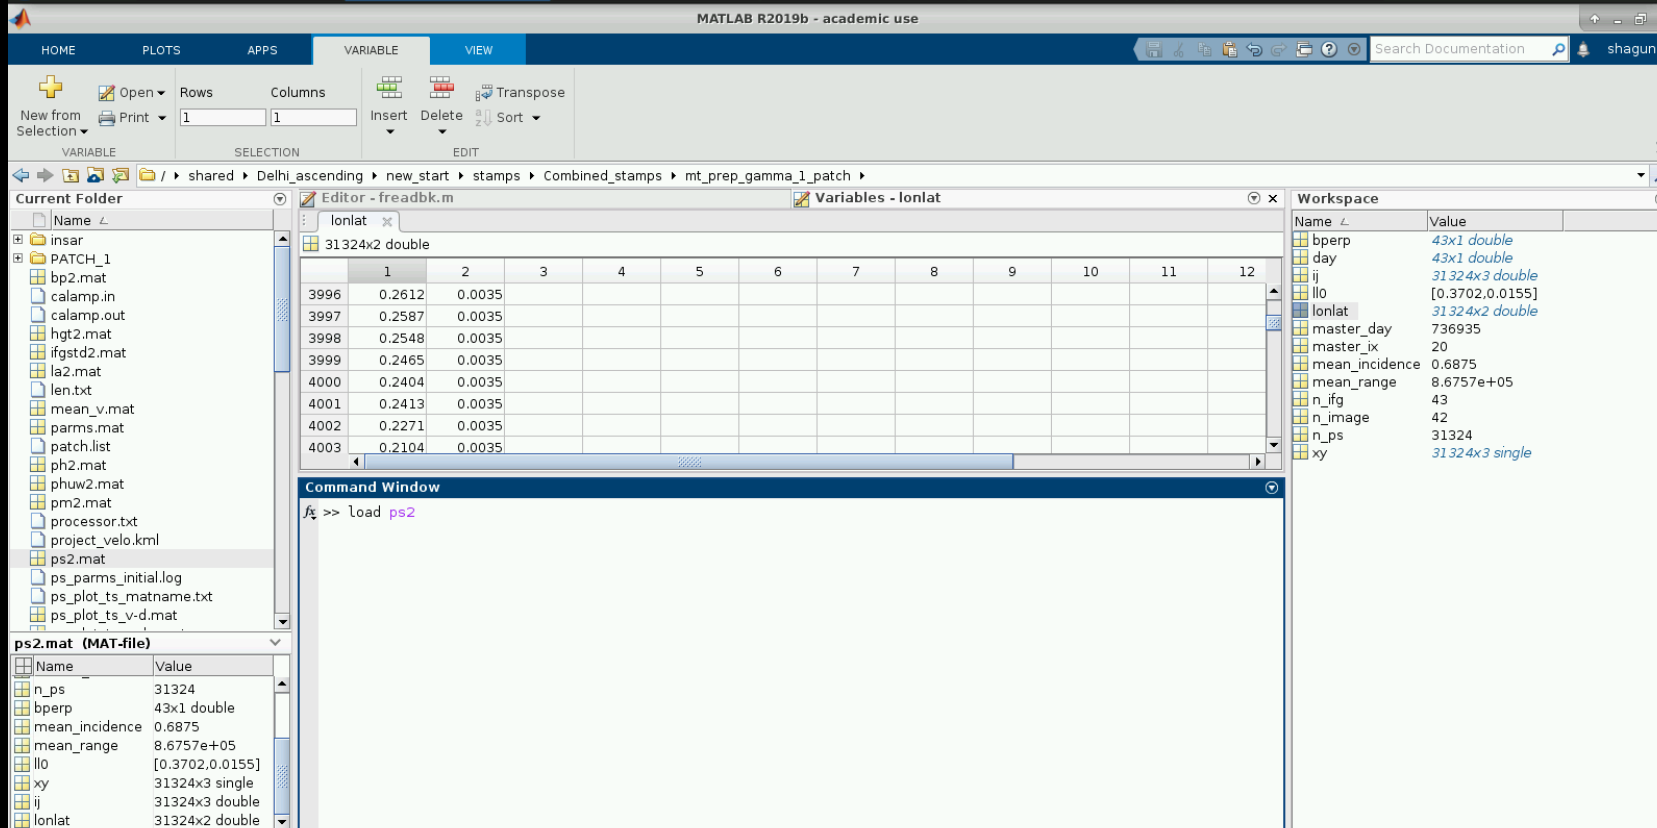
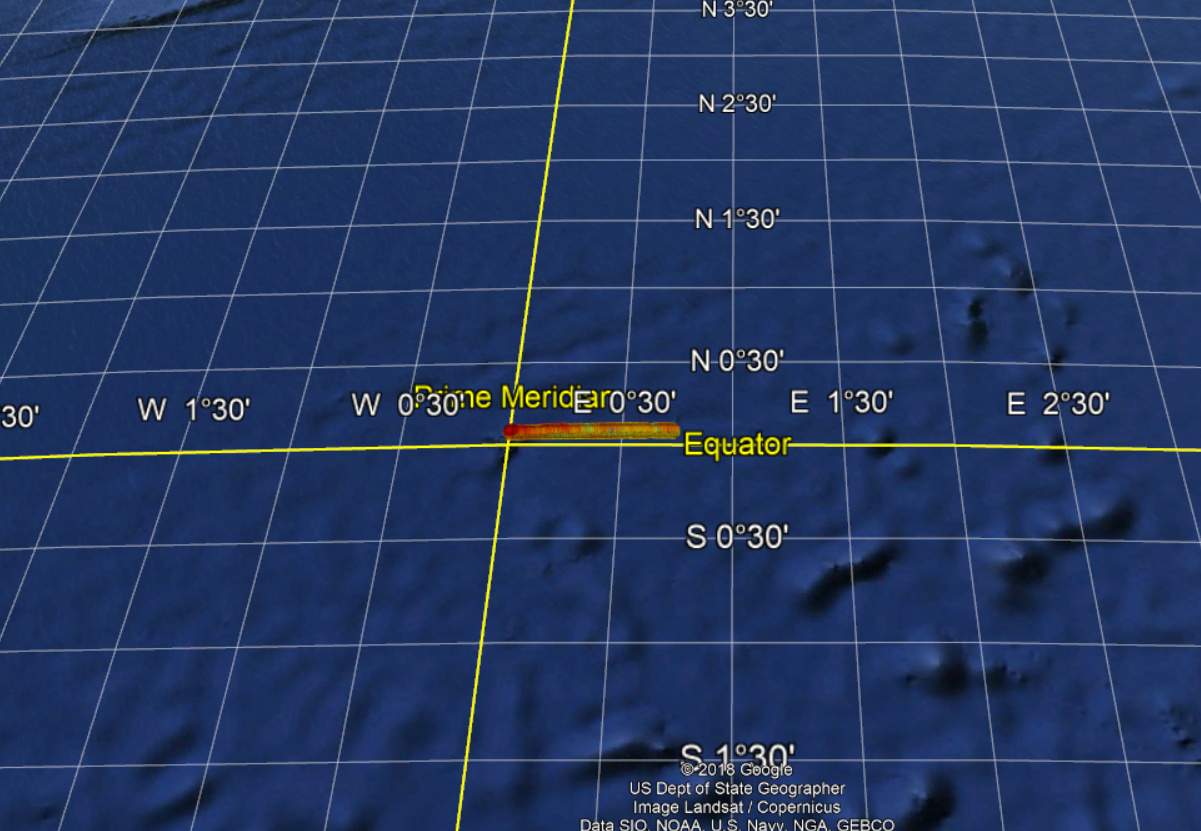
I exported the ph_disp results to google earth, and found the PS points are displayed near equator(see figure) . I checked the lat long variable in ps2.mat and found the values close to zero(fig. attached)
How can I correct my Lat long file ?
Thankyou!
PNG|690x477
I think these are just pixel coordinates (starting from 0,0)
how did you export them?
I think pixel coordinates are ‘ij’. The variable ‘lonlat’ is latitude longitude. This is the most probable reason why I am seeing my area near equator.

Can Someone ‘load ps2’ in matlab and show me the values of lonlat variable. Thanks
Hi @shagun1511,
atm I have no Matlab installation, but from the top of my head, try this if nobody provides you with the loaded ps2 or lonlat object…attention, could not check the code myself!:
change all ‘v-doa’ args in pas_plot related lines to your settings!
ps_plot('v-doa', 'ts');
load parms.mat;
ps_plot('v-doa', -1);
load ps_plot_v-doa.mat;
lonlat2 = [lon2 lat2]
Hi @thho, Thankyou for the response.
I tried your suggestion, but the problem is still the same. The PS candidates are shown near equator when visualised in google earth. (figure : https://forum.step.esa.int/uploads/default/original/3X/f/b/fbe2734a5cdf2f371910d2172c4eac9795aba07a.jpeg)
Not sure you have processed stamps without geographical coordinates and just in radar coordinates…
Had you ever checked the content of the lat/lon variables?
I have checked the lat long variables, and they are all close to zero. I don’t know what mistake I have done while processing the data. I followed every step carefully, which has been discussed in this and related forums. 
I have a query…
The .csv file which we use in stamps visualizer has the lat long along with the displacement values in each interferogram right?
However, what is the field(column data) which comes after the long and lat field?
What is the manual method of calculating the velocity (mm/year) using the values in the .csv file?
Could anybody tell me?
sooo the value you ask for is the velocity, its used for color coding the points ;)… enjoy
1 Like
thank you @thho
So you mean, the values in the column 3 below the Nan (in [1,3]) are the velocity values in mm/year?..!!!
Thanks a lot…
i guessed it to be the same but just wanted to clarify…!!!
exactly…do not want to make it to easy  if somebody feels the need, one can share a screenshot with some notes in it where is what in the table, then I can include it in the manual…I linked to my answer above several times in this post…
1 Like