i could send a screenshot of my table if required

The first column (A) shows the longitude
The second (B) latitude
The third (C ) velocity (mm/year)
i could send a screenshot of my table if required
The first column (A) shows the longitude
The second (B) latitude
The third (C ) velocity (mm/year)
ok, am I allowed to use this in the manual of the visualizer as an example?
and btw, use a ref point, this might highly improve your results…since it is set to 0,0 as reference the overall velocity of all points is used in StaMPS as baseline…
of course you can…
By the way where could i specify the ref points?
And the ref point should be mentioned by specifying lat long?
from https://homepages.see.leeds.ac.uk/~earahoo/stamps/StaMPS_Manual_v4.1b1.pdf page 32
You can select areference areaby setting parametersreflonandreflat(for a rectangulararea) orrefcentrelonlatandrefradius(for a circular area). All plots will then be refer-enced to the mean value for this area. If not set, the reference value is the mean value for the wholearea <
and an other answer concerning this and your last question out of this thread ![]()
thanks a lot @thho
Good afternoon, could you help me in this step please, I’m new to matlab, after applying ‘ps_plot (’ v-do ‘,’ ts ‘)’ I get this window, how do I select a reference point to export a CSV? .
you have to define the ref point before plotting, see the StaMPS manual for that, page 32 if I recall right.
then when you have this window, select the radius in the field under the plot, to include all points make it large. then click in the image where the radius should be applied. The points within the radius are then used to build some objects. in the Visualizer app in the Manual tab is matlab code to extract those objects to a csv file.
TL;DR
BTW, nice study location 
Hello Thho
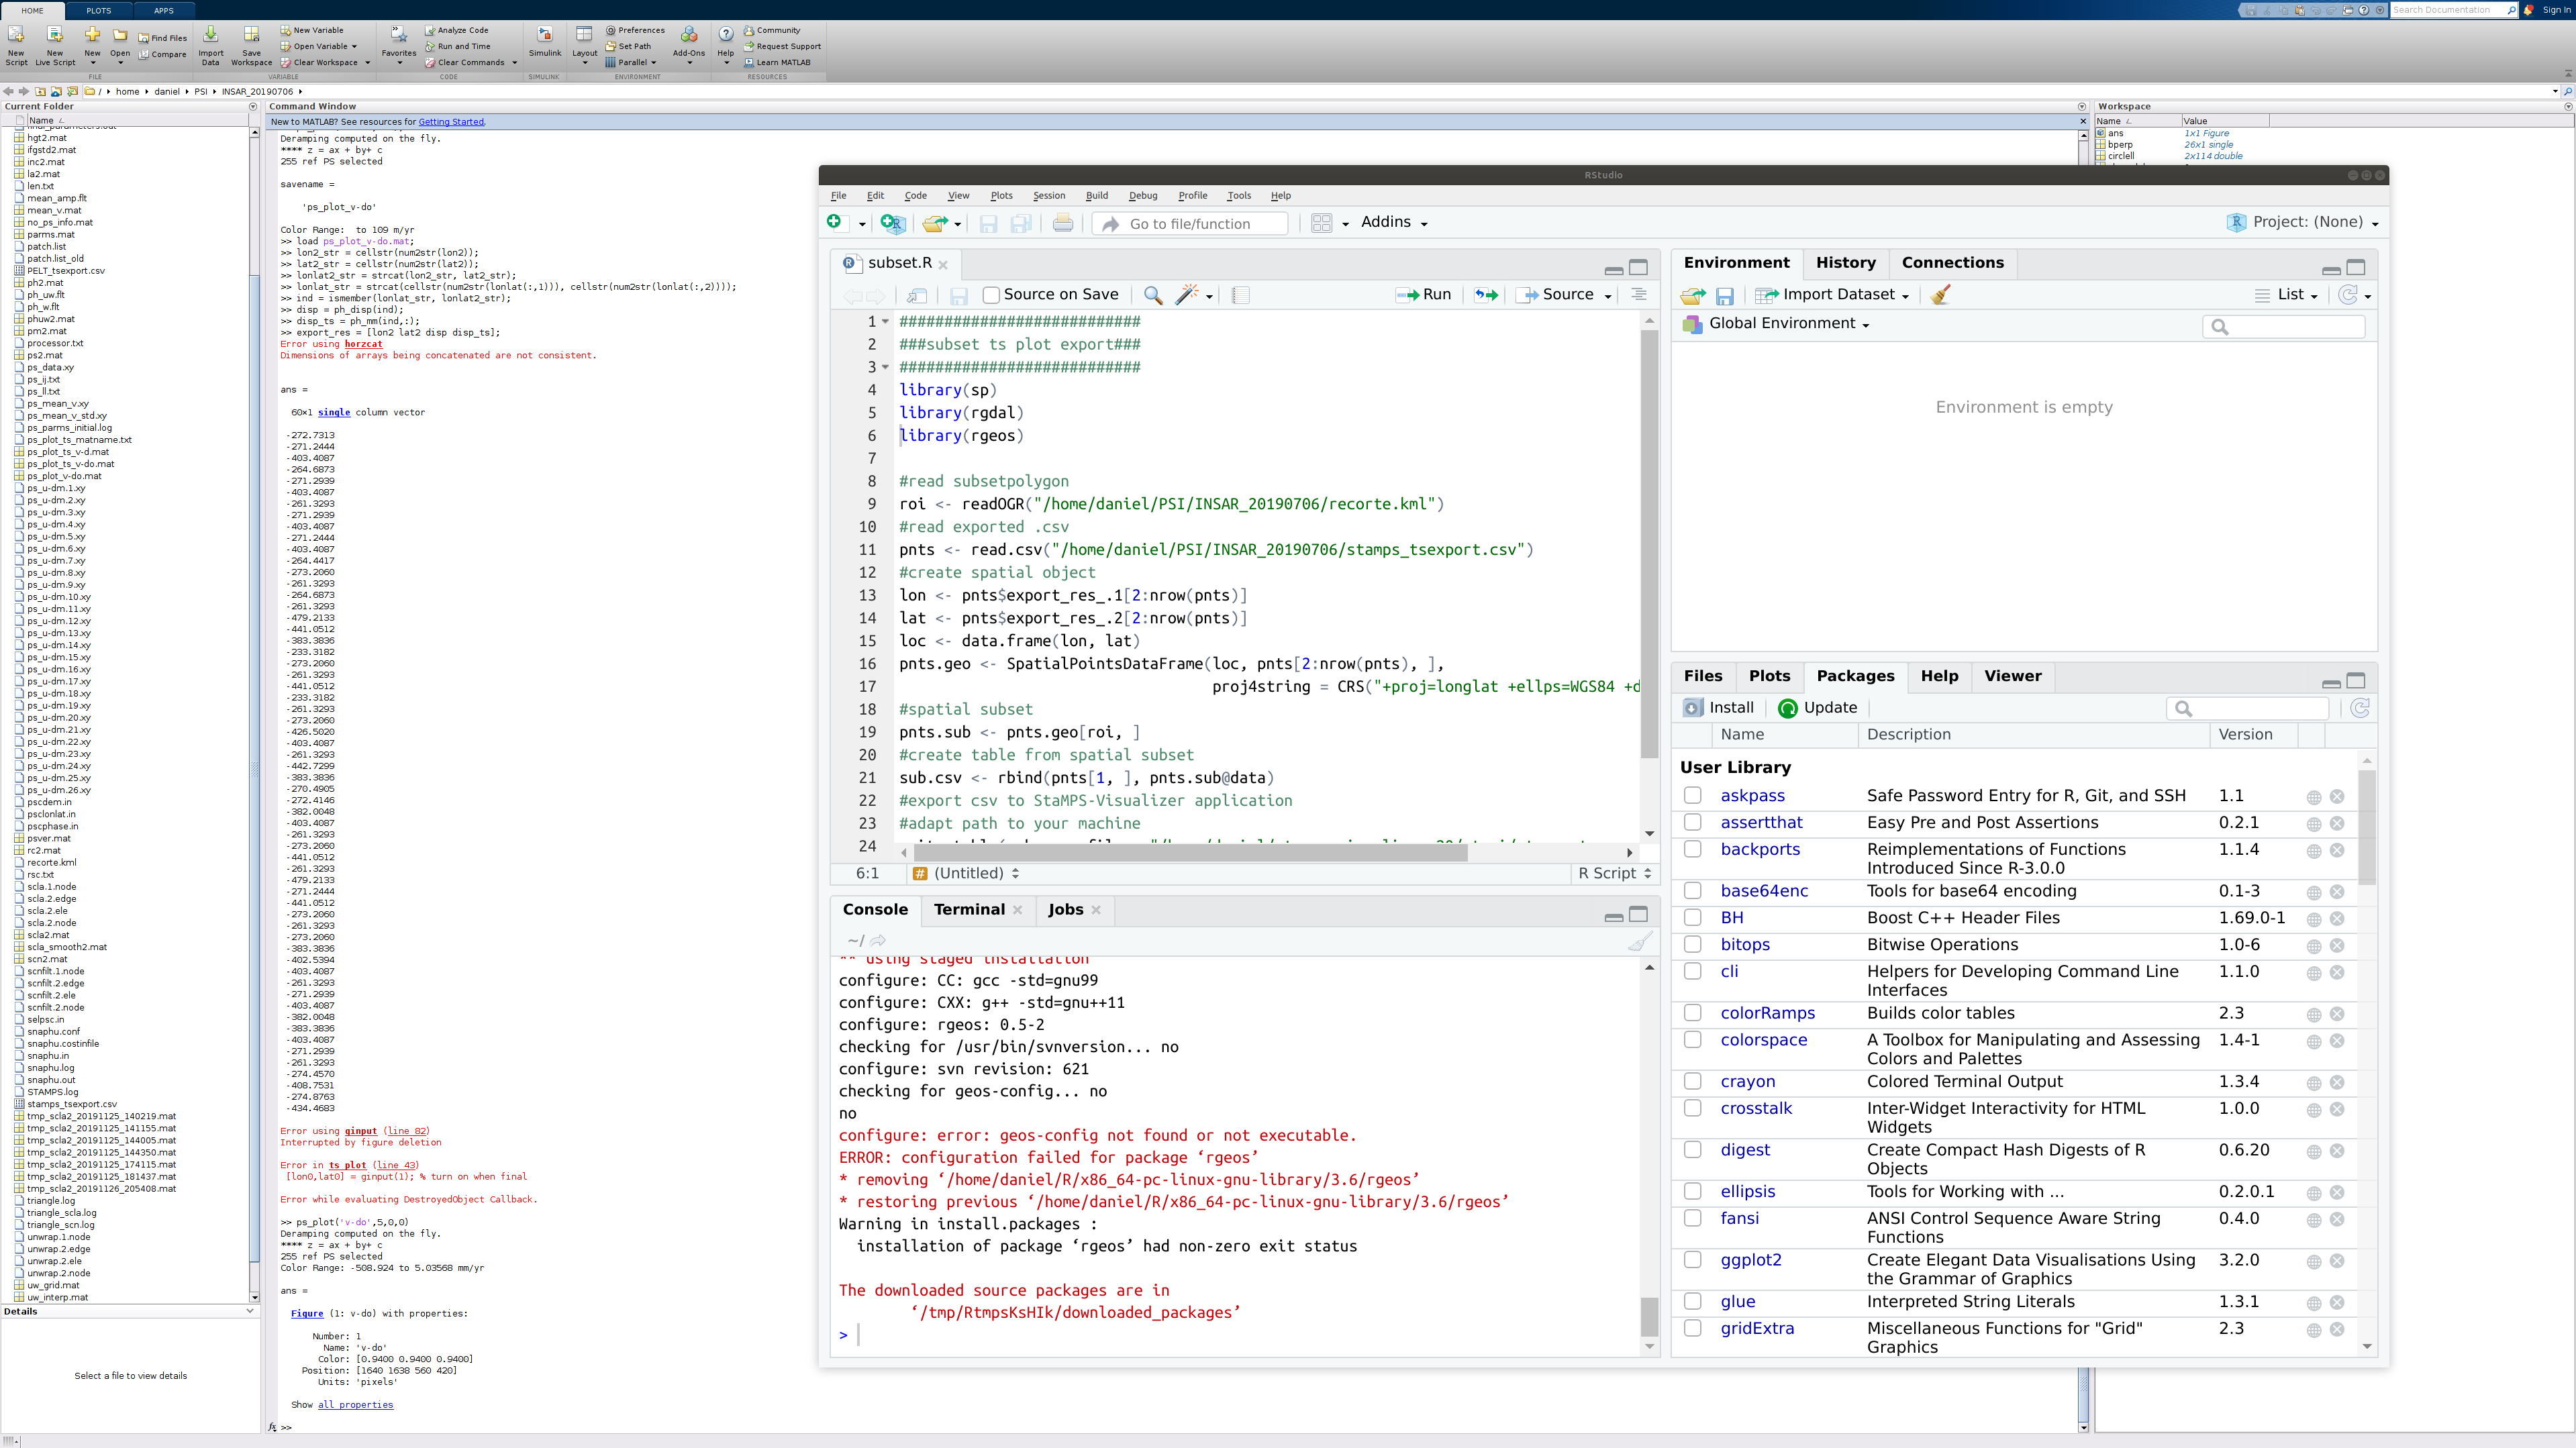
I’ve been following the steps in manual for make subset of my interest area, I would like to make subset with kml file but I have error installing “rgdal” and “rgeos” packages.
I tried typing "insatall.package(“rgdal”) and clicking on packages tab by gui but I cannot had successful
¿Cloud you help me, please?
Thank you very much, seriously! Thanks to all your posts I was able to get here being very new on the subject, I hope the questions are not a nuisance. 
@CFEgildan71, I assume you are using a Unix OS, then open a terminal and do:
sudo apt install libgeos-dev
after that open RStudio again
install.packages('rgeos')
should do.
@thho I have followed the code instructions as specified in the manual however I am running into an issue on the line export_res = [lon2 lat2 disp ts]
Error using horzcat
Dimensions of arrays being concatenated are not consistent.
Looking in the workspace the items have the following dimensions:
lon2 = 1542 x 1
lat2 = 1542 x1
disp = 1545 x 1
ts = 9 x 1
How would I go around solving this?
Hi @hm1u16, have a look at the posts around this one…sounds familiar, if the error remains, ask again here.
If I remember correctly, you have to give a radius big enough to get all your points selected, by doing that the dimensions are consistent and you can proceed.
Hi Everyone.
I tried the code in R which comes with the Shiny Visualizer to subset my data in R. In order to visualize it in Shiny Visualizer, however, it fails. Due to availability of ‘rgdal’ and ‘rgeos’ packages in R version 3.4.4. I updated R to the latest version 3.6.2. It still tells me that the packages are not available.
My question is this:
Has anyone faced similar problems with R version 3.4 installing rgdal and rgeos packages?
Thank you
This is solved. Thanks to @thho.
hello,I am a newbie in PSInSAR,so if I can take few
of your time,I hope to communite with you about some questions in this.
feel free to go ahead.
Just one hint to this post which collects the most important information PS InSAR:
For all having the same problem, use this as a starting point:
Hi Thho, thankyou for all your posts.
I’m trying for the first time to visualize my PS just processed.
I copied the script you suggested ad I got this error
Deramping computed on the fly.
**** z = ax + by+ c
619688 ref PS selected
savename =
'ps_plot_v-do'
Color Range: to 109 m/yr
ans =
[ ]
Undefined function or variable ‘lon2’.
Do you know how to fix this parameter?
thank you very much
have you executed it line by line, including the plot command beforehand?
So at best you follow this order
ps_plot('v-do', 'ts');
wait for the image to load
load parms.mat;
then execute the rest as a whole.