I’m sorry,
The error is “unrecognized function or variable ‘ph_disp’.”
ph_disp is actually part of ps_plot (StaMPS/matlab/ps_plot.m at master · dbekaert/StaMPS · GitHub)
It is important first to run these two lines
ps_plot(‘v-d’,-1)
load ps_plot_v-d
Then ph_disp should be defined and be visible in your matlab workspace window
Problem solved, Thank you! Unfortunately a new one occurred…
When I try to visualize my PS, StampsVisualizer crushes. I suppose because there are too many PS (967 440) and the .CSV file is too large, is it possible? In this case, how can I select a specific area? My AOI is quite smaller compared to the all image.
the PS you select after calling the ps_plot(‘v-do’, ‘ts’) command are used for the export. So, depending on the radius you enter, you can reduce the amount of points in the csv.
I used 100 000m as radius, a lower one gives the “horzcat” error
hmm, tricky. Any chance to reduce the csv file with a python script maybe?
I have not tried it but removing all lines with coordinates smaller/larger than your AOI could work.
@Evandro look at the Manual page of the Visualzer, there should be an R script doing exactly what you want 
1 Like
###########################
###subset ts plot export###
###########################
library(sp)
library(rgdal)
library(rgeos)

#read subsetpolygon
roi <- readOGR("/home/user/studysite/roi.kml")
#read exported .csv
pnts <- read.csv("/home/user/ISNAR_master_date/stamps_tsexport.csv")
#create spatial object
lon <- pnts$export_res_.1[2:nrow(pnts)]
lat <- pnts$export_res_.2[2:nrow(pnts)]
loc <- data.frame(lon, lat)
pnts.geo <- SpatialPointsDataFrame(loc, pnts[2:nrow(pnts), ],
            proj4string = CRS("+proj=longlat +ellps=WGS84 +datum=WGS84 +no_defs"))
#spatial subset
pnts.sub <- pnts.geo[roi, ]
#create table from spatial subset
sub.csv <- rbind(pnts[1, ], pnts.sub@data)
#export csv to StaMPS-Visualizer application
#adapt path to your machine
write.table(sub.csv, file = "/home/user/stamps_visualizer/stusi/stamps_tsexport.csv",
            row.names = F, col.names = T, sep = ",")
2 Likes
Thank you @thho!
So, do I have to change only the red ones with my paths and the parameters of my AOI?
jep, but just the paths not the string in pnts.geo <- … line…
Mmmh ok, but where should I set the borders of my AOI (maxLat, minLat / maxLon, minLon)?
you create a kml file defined in the roi variable
I can’t create a kml file regarding only my area. What I’m doing wrong?
I followed the steps presented in the chapter 7 of Stamps manual for the kml file of the whole area and it works:
ps_plot (‘v-d’, -1)
load ps_plot_v-d ph_disp
ps_gescatter (‘project_velo.kml’,ph_disp,10,0.4)
For my study area I used
ps_plot (‘v-d’, 1,0,0,[], 0, 0, 0,[], [9.18 9.23], [44.31 44.34], -1)
but it does not creat a new mat file
you can digitize a polygon in Google Earth and use it in thho’s script. I think this is easier than the approach presented in the manual (which directly creates a kmp point file contining every 10th scatterer).
Unfortunately the file is too big for Google Earth too…
you only digitize a Polygon in Google Earth and name it roi.kml
Then you apply this kml to the csv using thho’s script. No need to open data in Google Earth before the clipping.
@ABraun I didi as you said! In R theese errors occur
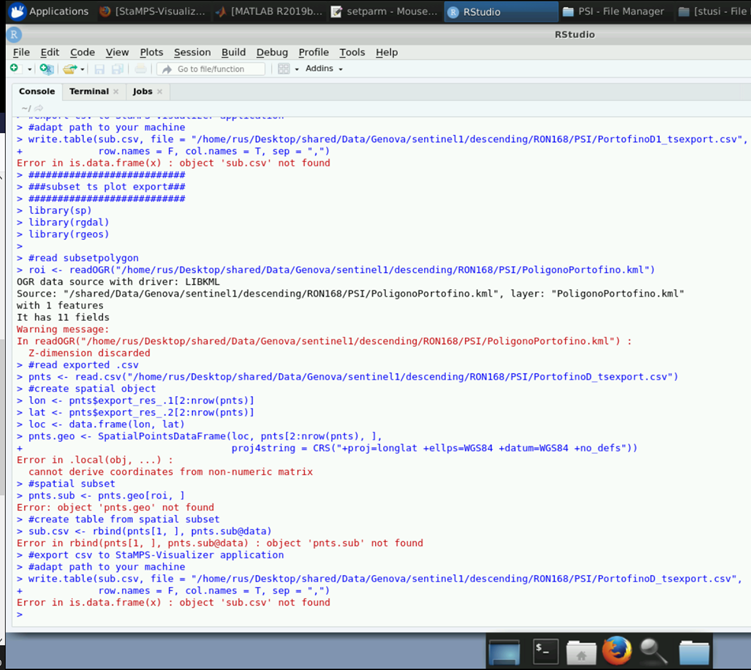
is this the correct path to the csv?
![]()
No typo or maybe a missing / ?
Even changing the output directory the same errors occur. I laso renamed csv and kml files using “roi.kml” and “stamps_tsexport.csv” but nothing…any ideas? 
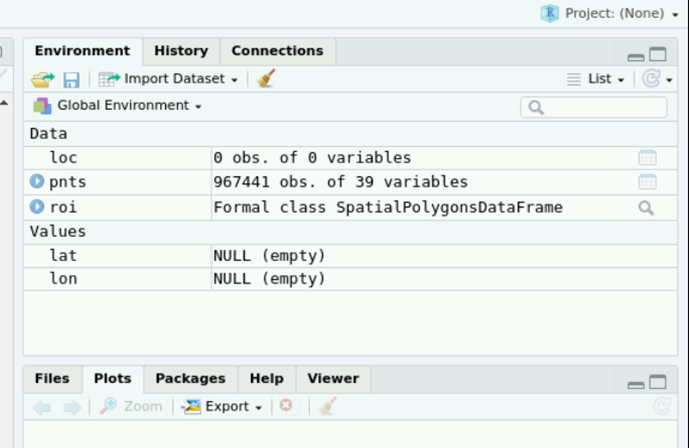
I noticed that in this field in R lat and lon values are null, does this means anything?