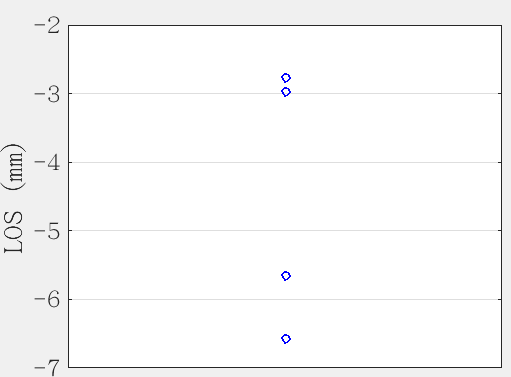
I have a question. What does the picture below mean?
more context please. Where is it from?
Looks like a box plot but with insufficient number of observations, so all points are considered outliers.
LOS could be the displacement along the line of sight.
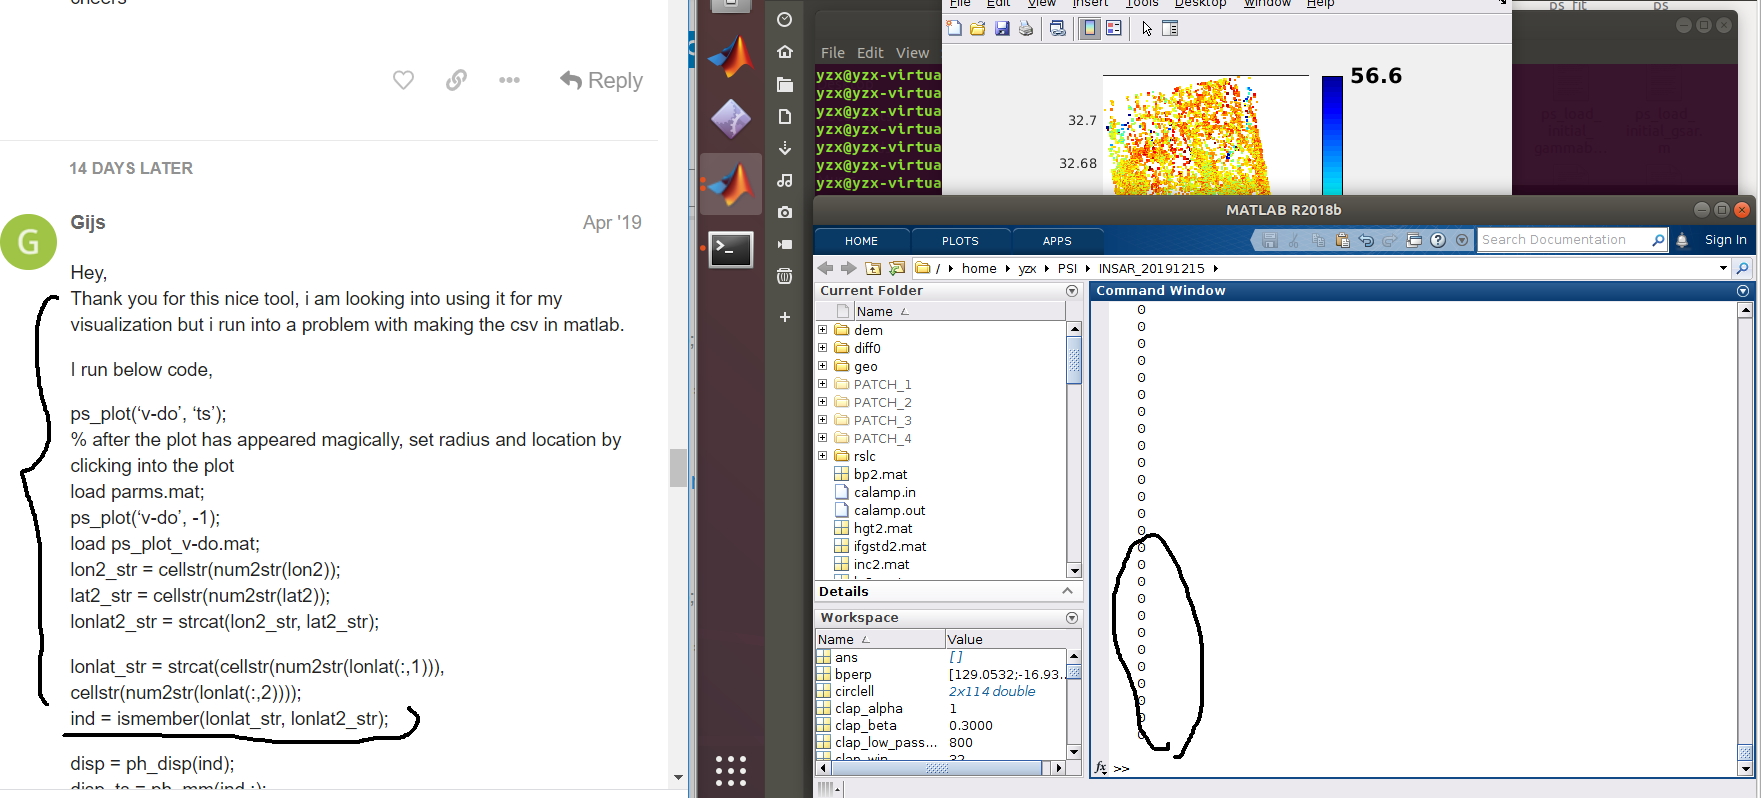
When I use ps_plot (‘vs’, ‘ts’), I can get an interactive interface as shown in Figure 1.
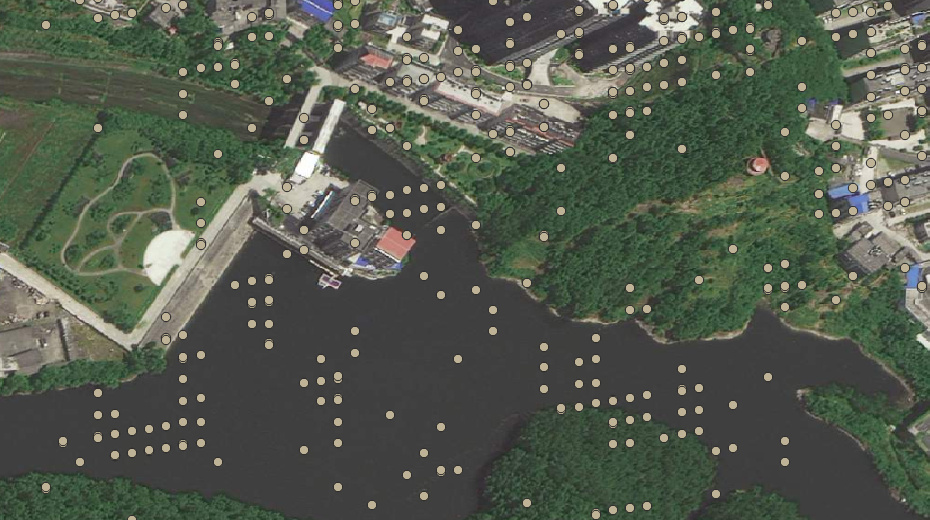
Then set the radius (such as 1000m), click TS plot, use the crosshair to select a suitable point, and then get the following Figure 2, Figure 3.
Figure1:
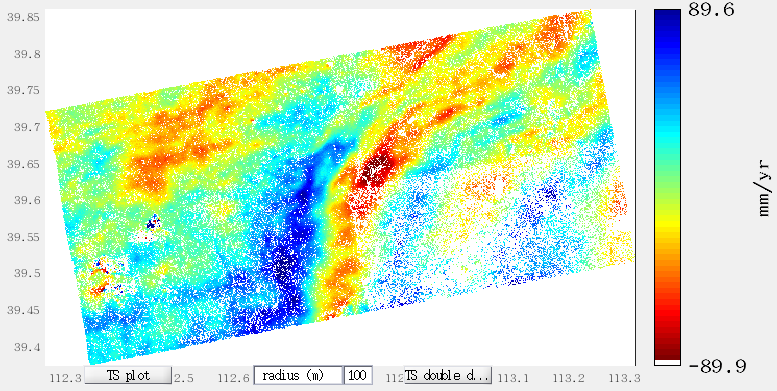
Figure2:
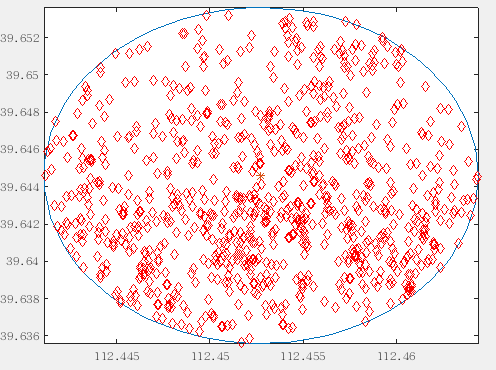
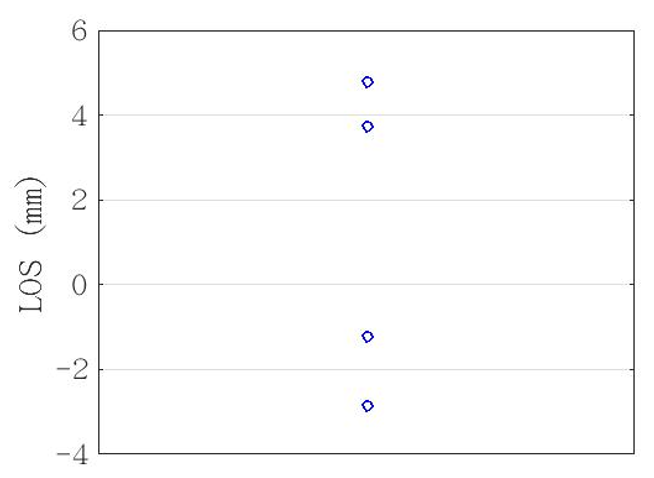
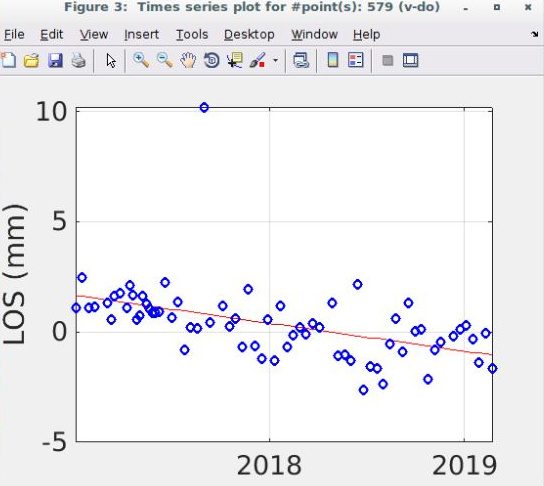
Figure3:
I want to ask for figure3 what message does it want to convey?
1 Like
now I understand. Acutally, these points should form a time-series plot like this
How many images did you use to compute the result?
Does the x axis have any units?
In fact I only used 5 images to understand how to use StaMPS / MTI.
In addition, there are no units on the x-axis in Figure 3. What is the cause?
I have never seen this, sorry. Probably not enough to display a correct trend.
As the number of images is very small, your result contains lost of noise and atmospheric disturbance. But as you now completed it correctly, try to increase the number of interferograms to 20 or more to get rid of noisy scatterers.
1 Like
Thank you, Abraun.
You cannot get all the points over the same x point. that means that for that time/day you got 5 different measures
or the x-axis is out of scale and ranges between the years 2000 and 2030, for example, so that all points seem to belong to one date.
1 Like
Right!
But I was not expecting this done by StaMPS.
In fact that graph is not StaMPS standard… so maybe it was customised.

Thanks for the remark
2 Likes
Hello to all
I want to see if anyone has the steps to do the Stamps algorithm in SNAP software.
Thanks for sending to this address: aminmohamadi676@gmail.com
@aminmo, please have a look here Snap2stamps package: a free tool to automate the SNAP-StaMPS Workflow
This forum has a lot of supply for this specific workflow searching the forum is the way to go to get started. However, consider reading some posts and papers to get familiar with the theory of DInSAR, they are widely referred to in this forum, too.
2 Likes
hi,how to open PS Time Series Tool in QGIS ,any manual recommanded about QGIS,thank you!
The plugin can be installed via the plugin manager.
Please have a look at my explanations on the formatting of the table: StaMPS-Visualizer, SNAP-StaMPS Workflow - #47 by ABraun
Referring to your other question: The 0 output is fine, I get it as well. As long as no error message occurs, you can proceed.
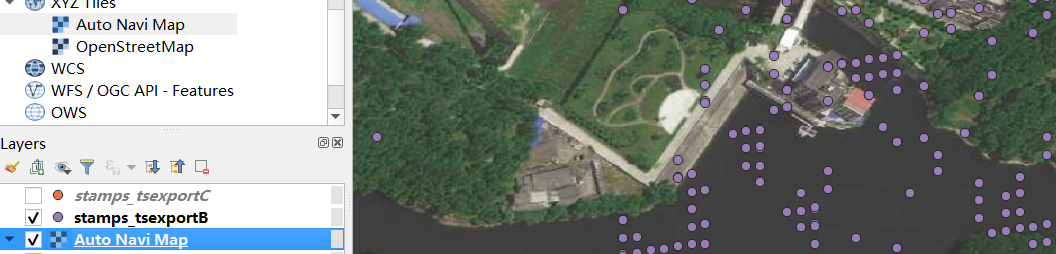
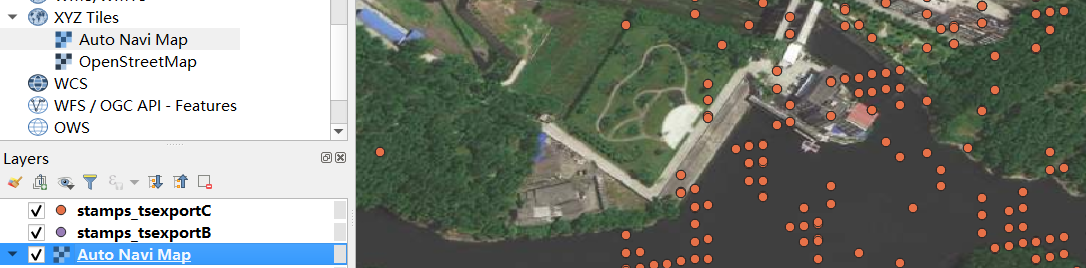
hello @ABraun:here are two question in Qgis,thank you!!:
1/how to avoid PS points in water ;
2/ Qgis Plugin error:no time series value found for the selected point;
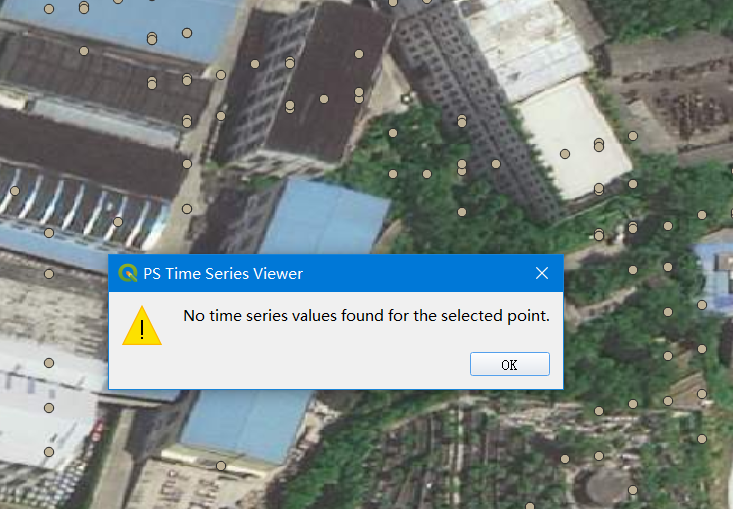
ubuntu18 ,StaMPS-Visualizer 2.1,matlab2018.
Please make sure that your attribute table matches the structure from the example file provided by the plugin
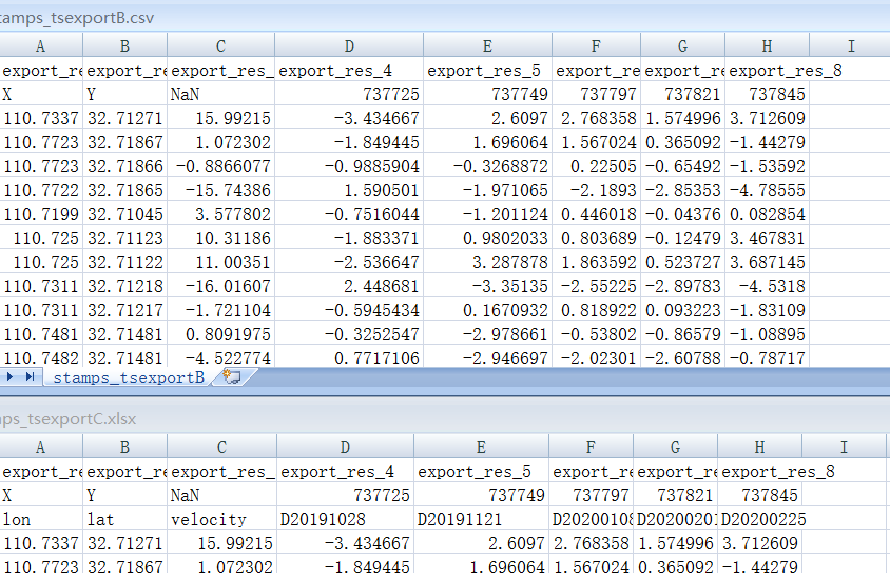
sorry,After you have mentioned ,it did’t mathed only differing in line 3,why,I just make csv file in matlab as mentioned above ,then improted in Qgis,
upper is mine,lower is the example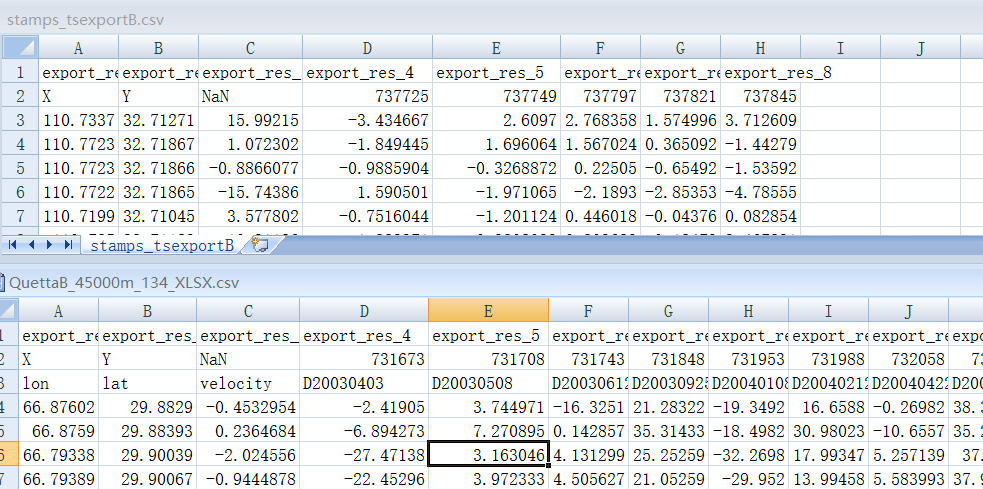
you are missing the formatted date in line 3. If this is not present, the QGIS plugin will not be able to interpret it as a correct input.
Simply insert a new line and enter lat, lon, velocity and the dates according to your images in the corresponding columns.