please share the csv in here and I will test it.
different in qgis and vsStaMPS thank you
Uploading: stamps_tsexportC.csv…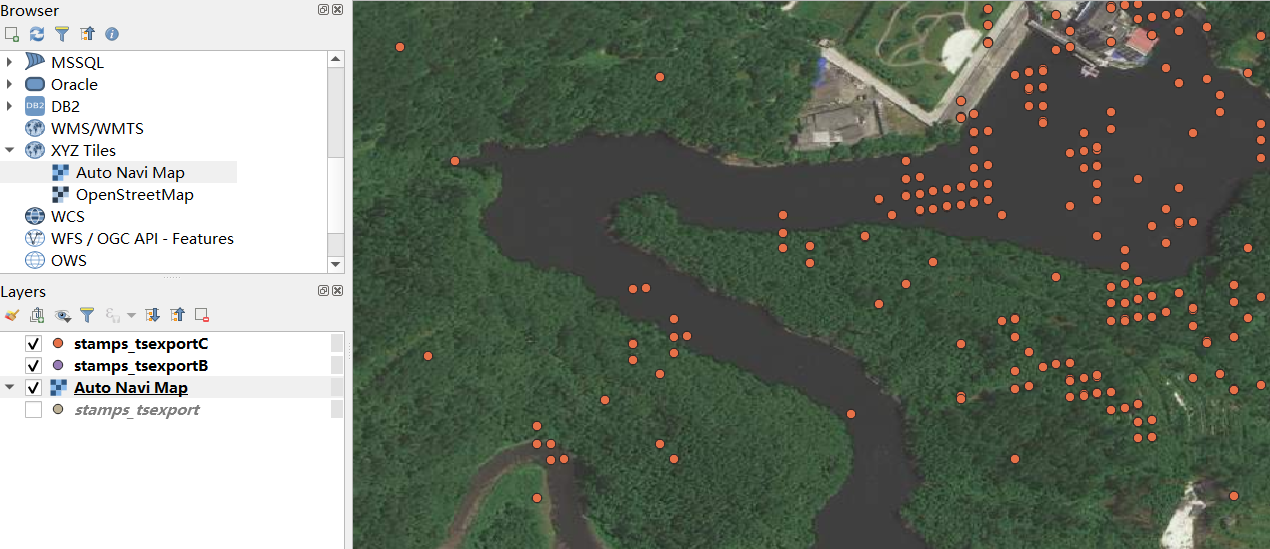
blush to say ,I don’t know how to reduce csv file(PS points) which is more than 7MB now. so upload fault.
the upload of the csv was not completed correctly.
The location shift could result from coordinate precision of the lat/lon column
en,I do think so, the CSV file is exported from matlab directly,but 1col with 4 decimal and 2col with 5.
I meant that the CSV you were sharing in the previous post cannot be downloaded. I would like to try it myself once I have it.
my CSV file is larger than 4MB ,cann’t upload ,so I must find a way to reduce the file size first 
you can remove a couple of the lines from the end or upload it somewhere outside the forum.
thank you ,there are more than one hundred thousand PS points,now 30 thousand remain(remove from end)stamps_tsexportD.csv (2.7 MB)
remove from start,include the example above (eg:water):stamps_tsexportE.csv (3.2 MB)
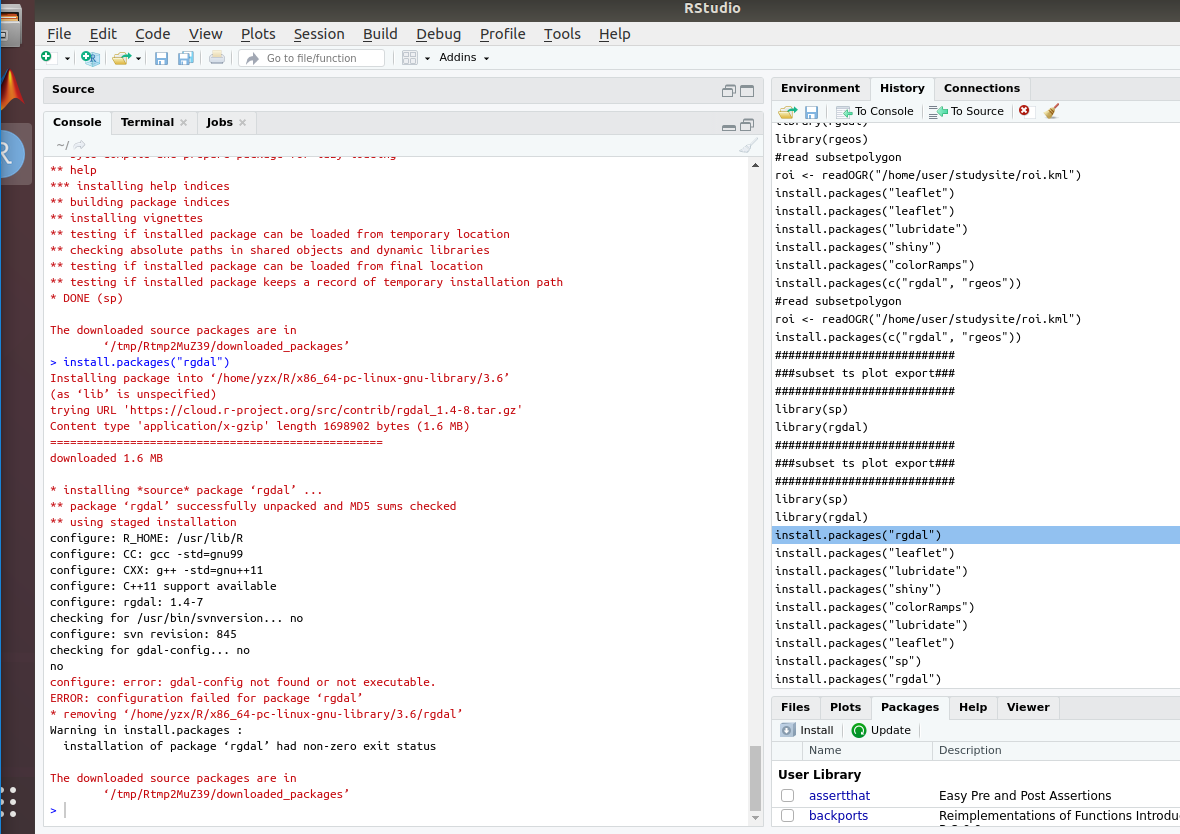
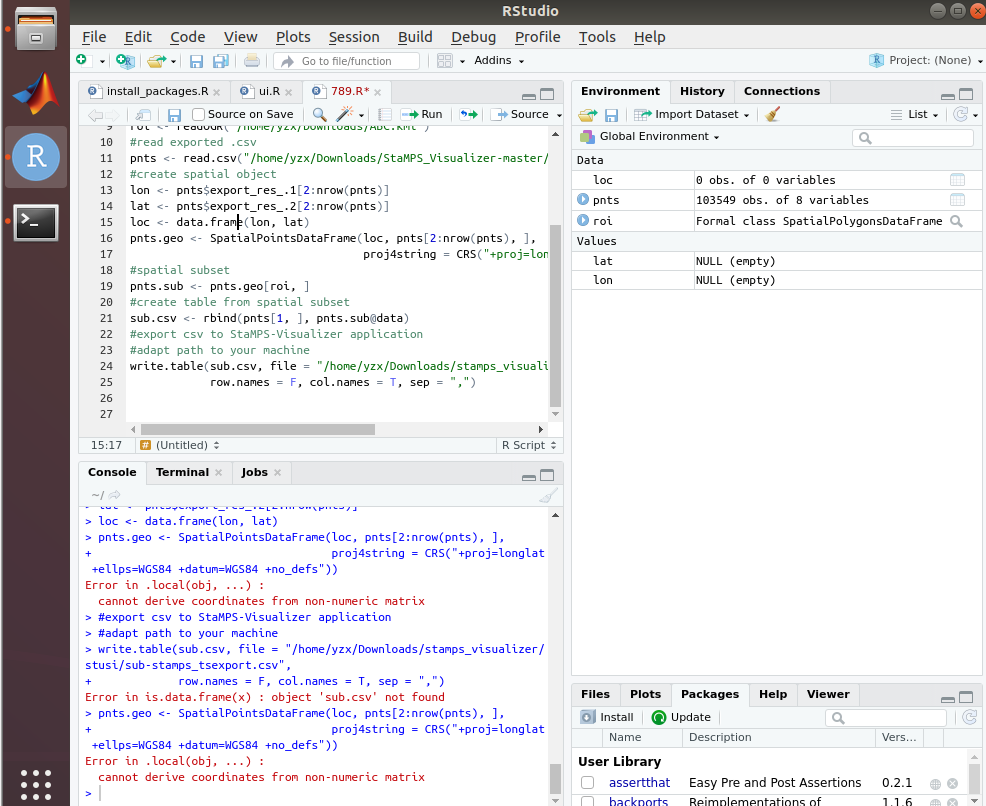
configure: error: gdal-config not found or not executable.
ERROR: configuration failed for package ‘rgdal’
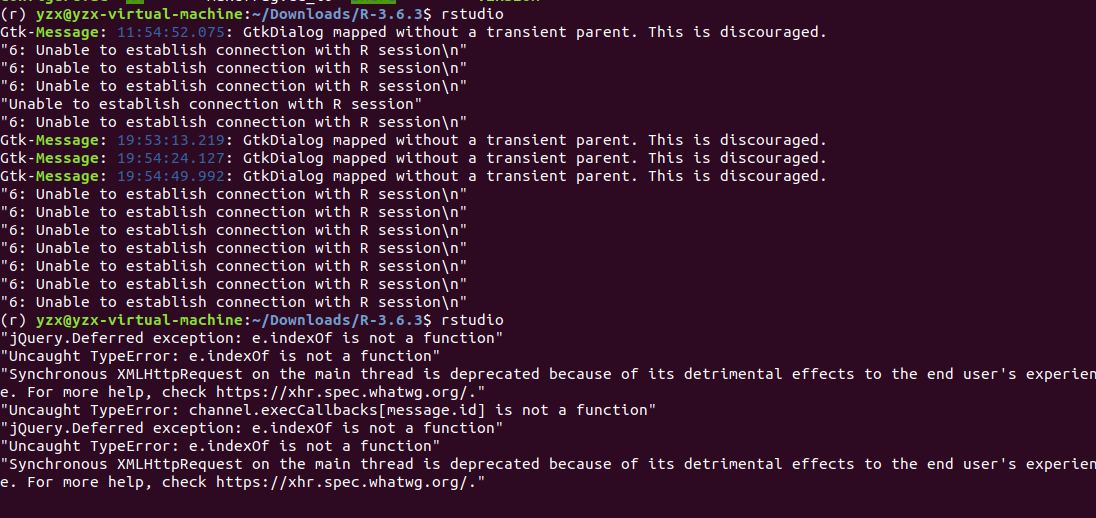
I run as @thho:
[quote=“thho, post:300, topic:9613”]
sometimes I am able to use Rstudio`s gui when installtion via command does not work…lower right window, Packages tab–>klick install–>search for rgdal–> klick install
[/quote]
please have a look here:
and here:
1 Like
you have to replace the days since year 0 by the formatted date
Then you import the points from the csv
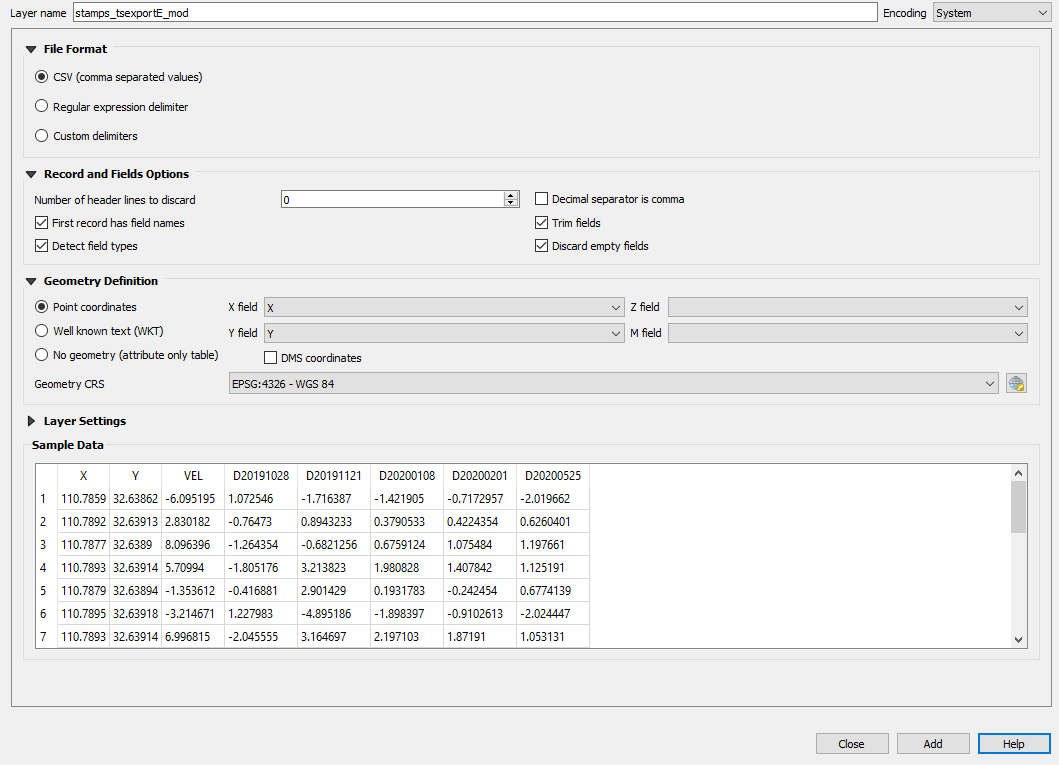
Then you save the imported CSV as a shapefile.
Then the tool works
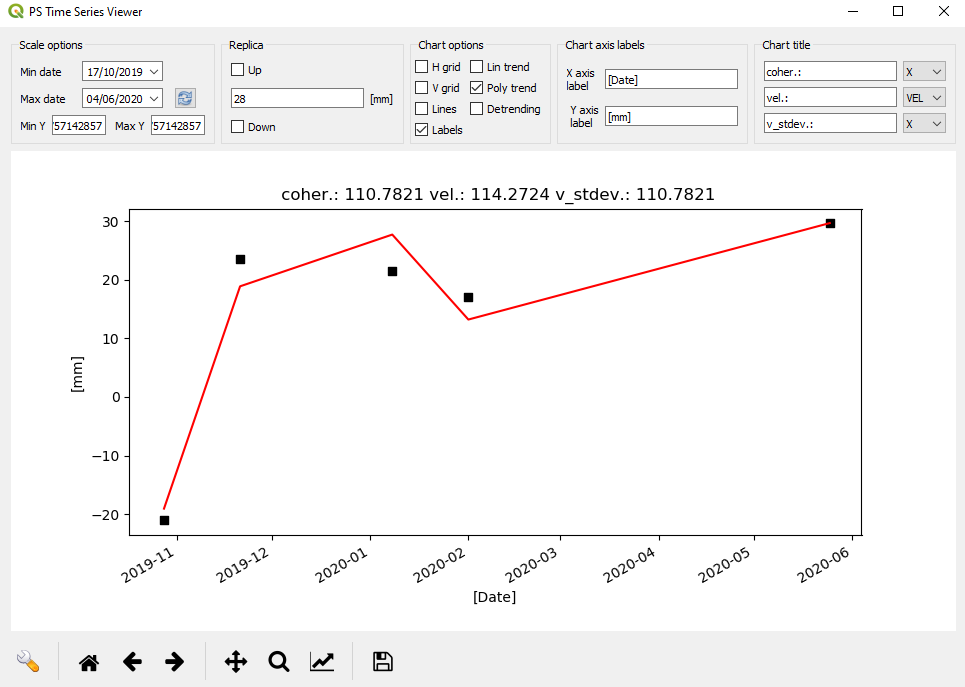
But I recommend to increase the number of input images to get more reliable results.
There is no clear trend in the single points and the overall image shows a strong ramp
stamps_tsexportE.zip (2.9 MB)
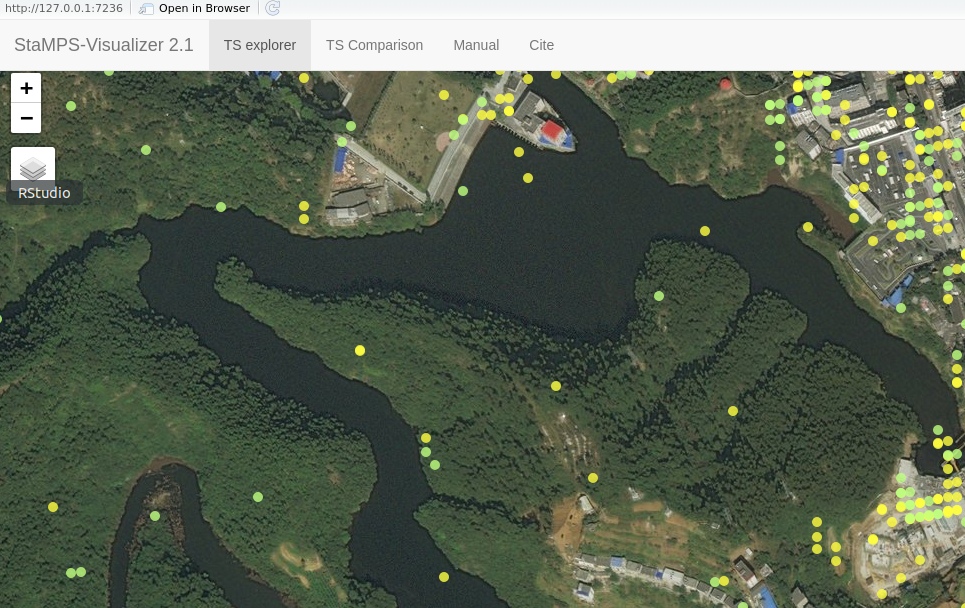
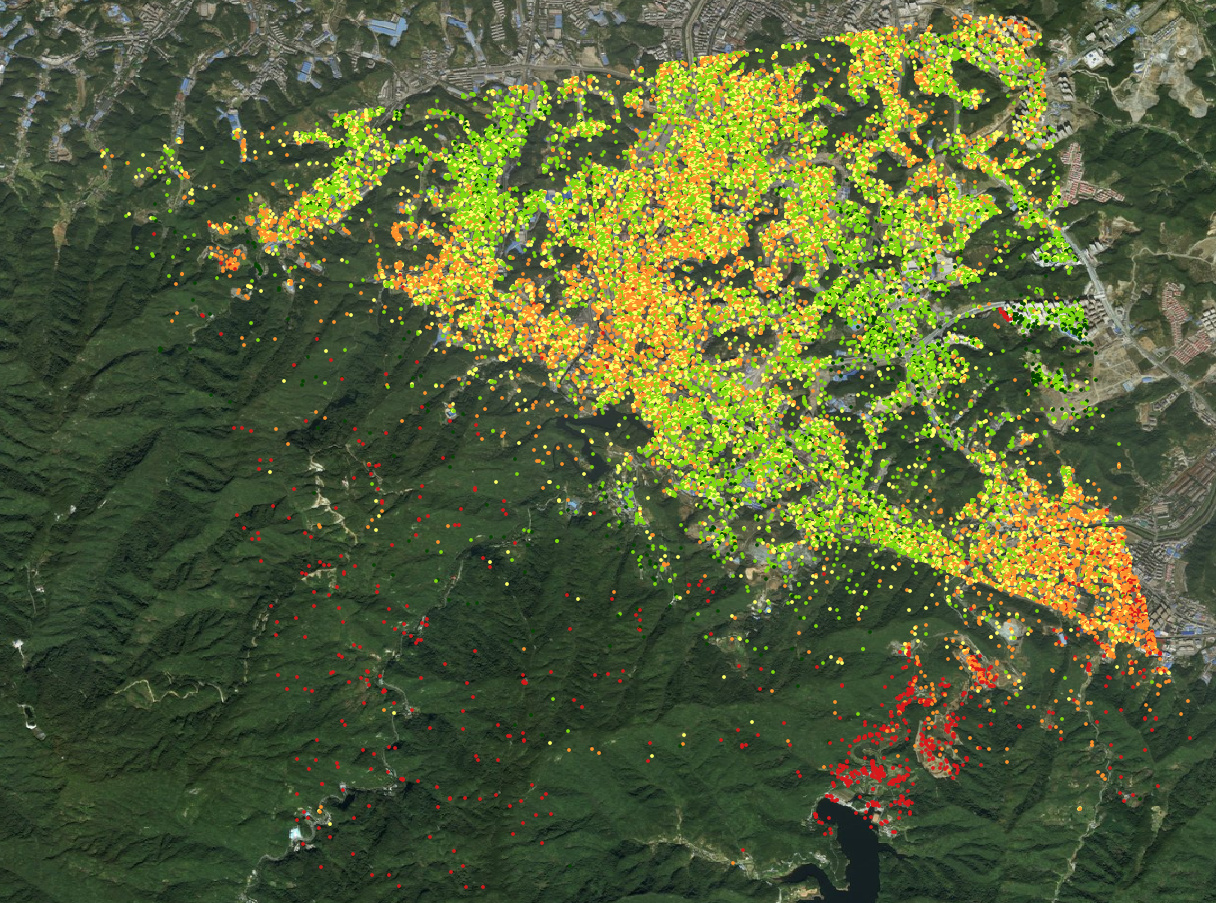
thnk you for your help.1/yes ,I just have a try about the scripts within 6 images to know the whole workflow .2/ compare the map between auto navi map and open street map, it seems a little shift about the each coordinate,this result in my PS points in water as showed above.3/ I download the file stamps_tsexportE,it runs successful ,very thanks for you .I’ll do further exercise to learn.
a possible explanation for smaller shifts is given here:
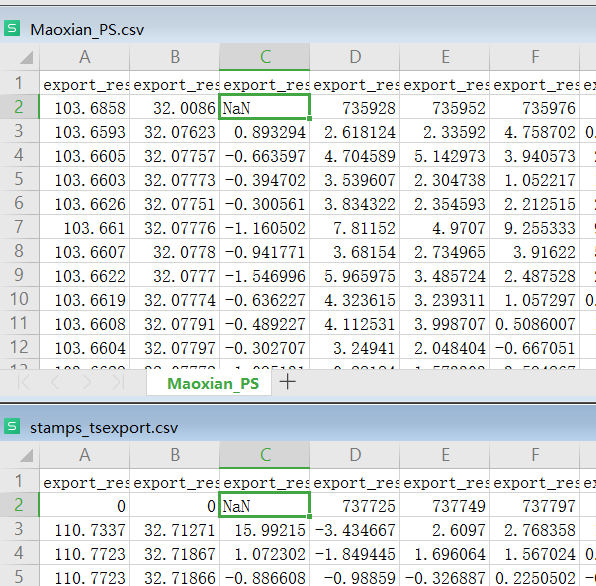
hello,viStaMPS 2.1 subset progrom error :as below,I compared the two csv files structure ,one is direct ly exported from matlab2018 (stamps_tsexport.csv)the other is the example of viStaMPS 2.1(Maoxian_PS.csv).the question is what’s 2row 1:2col mean (before NaN in Maoxian_PS.csv)?
I think you are mixing up the packages:
The R scripts developed by @thho are called the StaMPS Visualizer
The Matlab GUI developed by UTAD is called ViStaMPS
About the NaN column - this is explained here:
thank you for your mention,I indeed mix up two plugins.Another question ,how can I sort the result of csv file or shp file ,which related to [2:nrow, 3] mean velocity 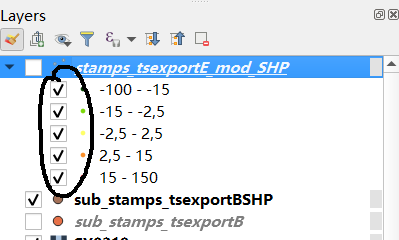 ?
?
in QGIS you can sort columsn of an attribute table by clicking on their name. https://docs.qgis.org/2.18/en/docs/user_manual/working_with_vector/attribute_table.html#sorting-columns
HI,I’ve read through https://docs.qgis.org/2.18/en/docs/user_manual/working_with_vector/attribute_table.html#sorting-columns .if there any other materials related , recommend to me please!