I have tried many times with a 300-10 radius. But i have got error. What should be i have to do?
From the Matlab code I see that you are using code I wrote for StaMPS 3.x however I think you are using StaMPS 4.x…please go to the github repo and use the up to date version of the StamPS-Visualizer, within in the Manual Tab you can find the new Matlab code for exporting the .csv from StaMPS 4.x. Your problem will be solved 
1 Like
Ohh bi… 
Thank you so much.
Hi…Have a good day… @thho Thank you very much for sharing your work in Subseting .csv file created from TS Plot. I have an error like this when trying to execute command in R studio.
R - Script
###########################
###subset ts plot export###
###########################
library(sp)
library(rgdal)
library(rgeos)
#read subsetpolygon
roi ← readOGR(“/home/cresos/TOKYOSENTINEL1/ROI/ROI.kml”)
#read exported .csv
pnts ← read.csv(“/home/cresos/TOKYOSENTINEL1/DESCENDING/SUBSET2/STAMPSEXPORT/INSAR_20190714/tokyosentineldescendingsubset2.csv”)
#create spatial object
lon ← pnts$export_res_.1[2:nrow(pnts)]
lat ← pnts$export_res_.2[2:nrow(pnts)]
loc ← data.frame(lon, lat)
pnts.geo ← SpatialPointsDataFrame(loc, pnts[2:nrow(pnts), ],
proj4string = CRS(“+proj=longlat +ellps=WGS84 +datum=WGS84 +no_defs”))
#spatial subset
pnts.sub ← pnts.geo[roi, ]
#create table from spatial subset
sub.csv ← rbind(pnts[1, ], pnts.sub@data)
#export csv to StaMPS-Visualizer application
#adapt path to your machine
write.table(sub.csv, file = “/home/cresos/stamps_tsexport_subset_descending.csv”,
row.names = F, col.names = T, sep = “,”)
Response
###########################
###subset ts plot export###
###########################
library(sp)
library(rgdal)
library(rgeos)#read subsetpolygon
roi ← readOGR(“/home/cresos/TOKYOSENTINEL1/ROI/ROI.kml”)
OGR data source with driver: KML
Source: “/home/cresos/TOKYOSENTINEL1/ROI/ROI.kml”, layer: “ROI.kml”
with 1 features
It has 2 fields
Warning message:
In readOGR(“/home/cresos/TOKYOSENTINEL1/ROI/ROI.kml”) :
Z-dimension discarded
#read exported .csv
pnts ← read.csv(“/home/cresos/TOKYOSENTINEL1/DESCENDING/SUBSET2/STAMPSEXPORT/INSAR_20190714/tokyosentineldescendingsubset2.csv”)
#create spatial object
lon ← pnts$export_res_.1[2:nrow(pnts)]
lat ← pnts$export_res_.2[2:nrow(pnts)]
loc ← data.frame(lon, lat)
pnts.geo ← SpatialPointsDataFrame(loc, pnts[2:nrow(pnts), ],
proj4string = CRS(“+proj=longlat +ellps=WGS84 +datum=WGS84 +no_defs”))
Error in .local(obj, …) :
cannot derive coordinates from non-numeric matrix
#spatial subset
pnts.sub ← pnts.geo[roi, ]
Error: object ‘pnts.geo’ not found
#create table from spatial subset
sub.csv ← rbind(pnts[1, ], pnts.sub@data)
Error in rbind(pnts[1, ], pnts.sub@data) : object ‘pnts.sub’ not found
#export csv to StaMPS-Visualizer application
#adapt path to your machine
write.table(sub.csv, file = “/home/cresos/stamps_tsexport_subset_descending.csv”,
row.names = F, col.names = T, sep = “,”)
Error in is.data.frame(x) : object ‘sub.csv’ not found
I need your advice
Thank you in advance
Best Regards
Badrul
Dear @badrulhudahusain,
please provide the dimensions of these objects:
pnts
lon
lat
loc
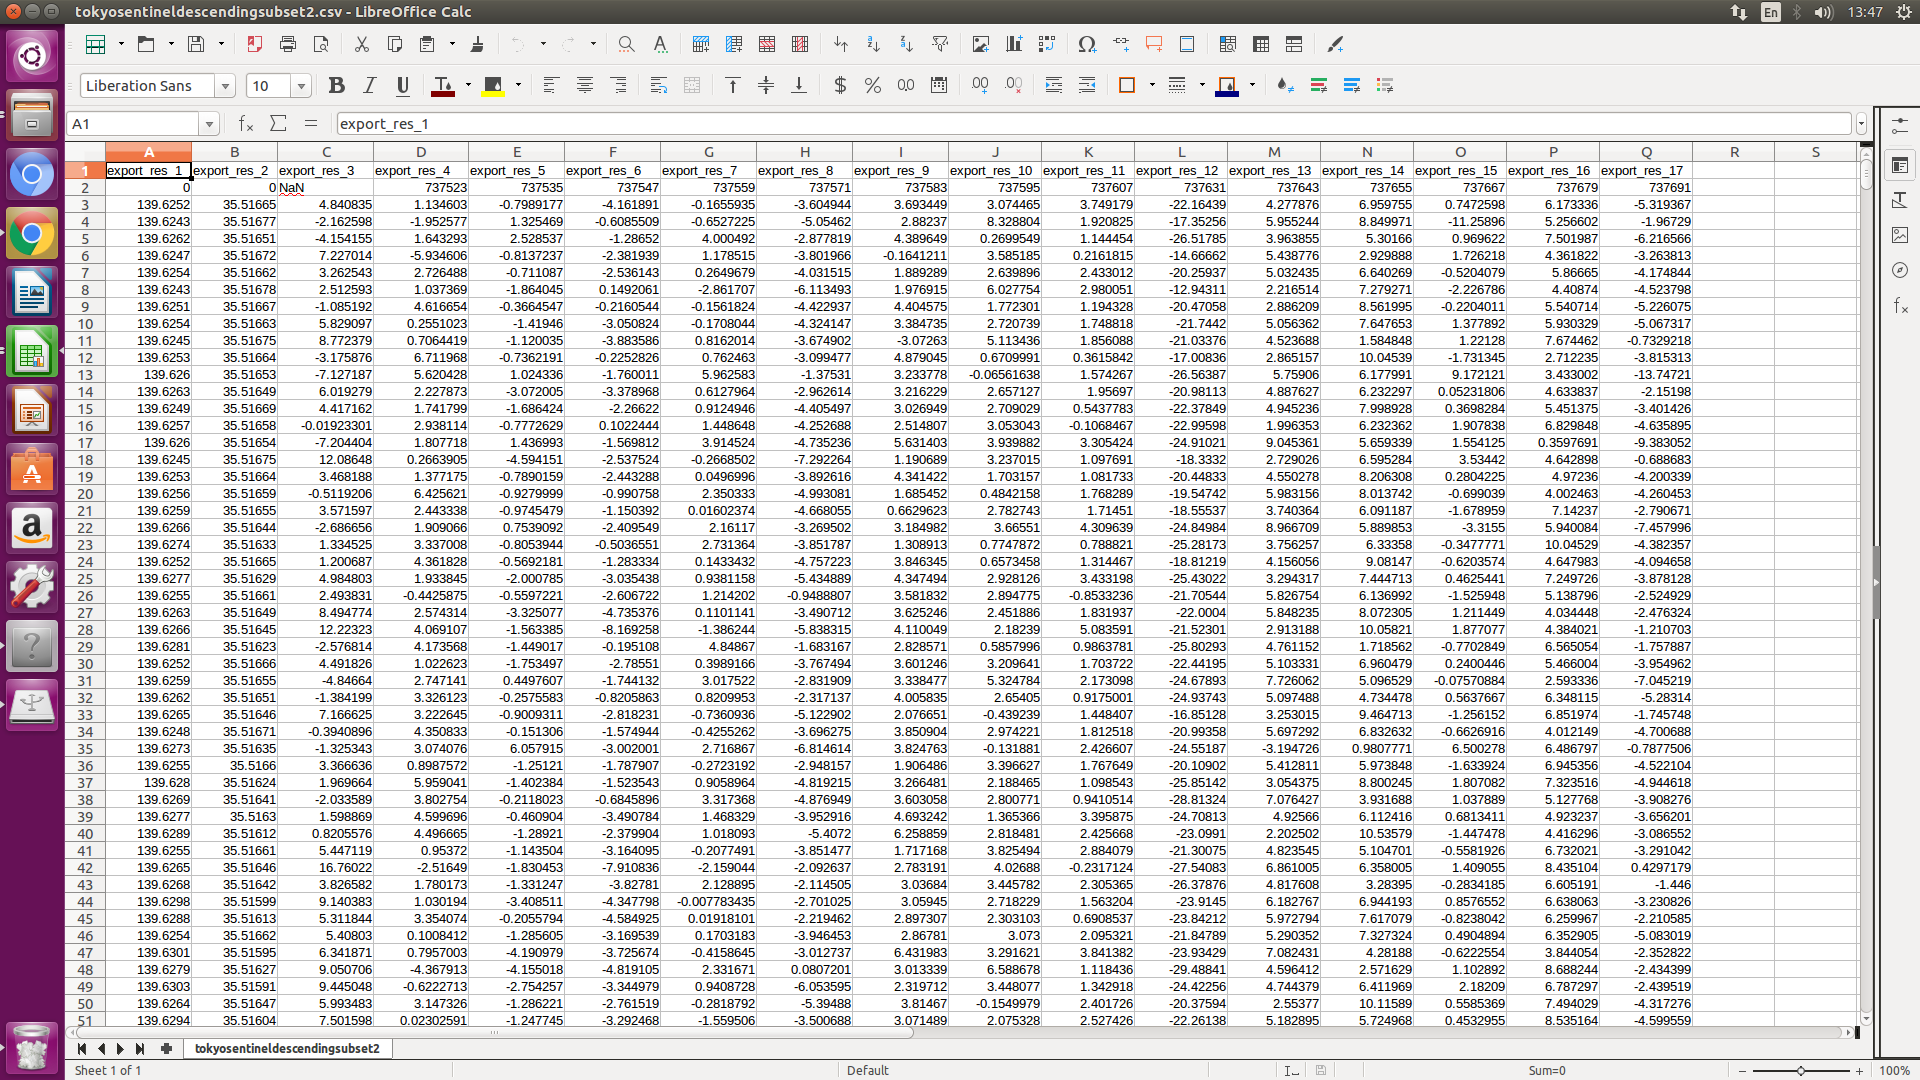
My first guess is, that your .csv export behaves strange. Therefore a screenshot of it opened in libre calc or microsoft excel would help further.
1 Like
Hi,when I run ui.R, error occurs:
shiny::runApp(‘C:/StaMPS_Visualizer-master’)
Loading required package: shiny
Warning: package ‘shiny’ was built under R version 4.0.2
Warning: package ‘lubridate’ was built under R version 4.0.2
Attaching package: ‘lubridate’
The following objects are masked from ‘package:base’:
date, intersect, setdiff, union
Error in .local(x, …) : Parameter is not used(origin = “0000-01-01”)
first try this out:
restart Rstudio, run the install_packages.R script and check that all packages are up to date.
to check further, remove all custom study stie .csv tables from StaMPS_Visualizer/stusi/ folder and then run the app again. If this produces errors, please post the versions of the packages you are using plus the R Version.
1 Like
thank you for your quickly reply ,I do as you said ,also I modified my csv file’s structure as same as Maoxian_PS.csv.now It works successfully ,thank you again
1 Like
Thank you and I’m sorry for late reply. @thho
I try to change (delete “.”) in your R script, turns out it works. I try to adapt it with my .csv export result.
in command for #create spatial object, I delete “.” to adapt with my .csv export result.
Original Script :
#create spatial object
lon <- pnts$export_res_.1[2:nrow(pnts)]
lat <- pnts$export_res_.2[2:nrow(pnts)]
loc <- data.frame(lon, lat)
pnts.geo <- SpatialPointsDataFrame(loc, pnts[2:nrow(pnts), ],
proj4string = CRS("+proj=longlat +ellps=WGS84 +datum=WGS84 +no_defs"))
Modified Script :
#create spatial object
lon <- pnts$export_res_1[2:nrow(pnts)] #modified line
lat <- pnts$export_res_2[2:nrow(pnts)] #modified line
loc <- data.frame(lon, lat)
pnts.geo <- SpatialPointsDataFrame(loc, pnts[2:nrow(pnts), ],
proj4string = CRS("+proj=longlat +ellps=WGS84 +datum=WGS84 +no_defs"))
Anyway, you did excellent in creating this script and share it here
Thank You
Best Regards
Badrul
3 Likes
Hmm for some reason, in the .csv tables which I provide within the visualizer the “.” is needed…Will check this again, when I work on it next time, thanks for mentioning!
1 Like
Hi, @ABraun!
It’s me again. I wanted to do some post analyses through QGIS, and came across this discussion here also related to the StaMPS Visualizer. I have QGIS 3.0 and 3.6. I have downloaded your example *.xlsx data you’ve provided here (Quetta_45000m_134_XLSX).
Here are the things I’ve done.
- Launched QGIS 3.6 and installed the PS Time Series Viewer plugin.
- Saved the *.xlsx into *.csv.
- Imported the *.csv into QGIS and converted it into shapefile (i.e. Export —> Save Features As… —> ESRI Shapefile)
- I named it Quetta_45000m_134_SHP.
- Plugins —> Permanent Scatterers —> PS Time Series Viewer
- I selected a PS point and got the same error shown in this previous shot. Mine is shown below.
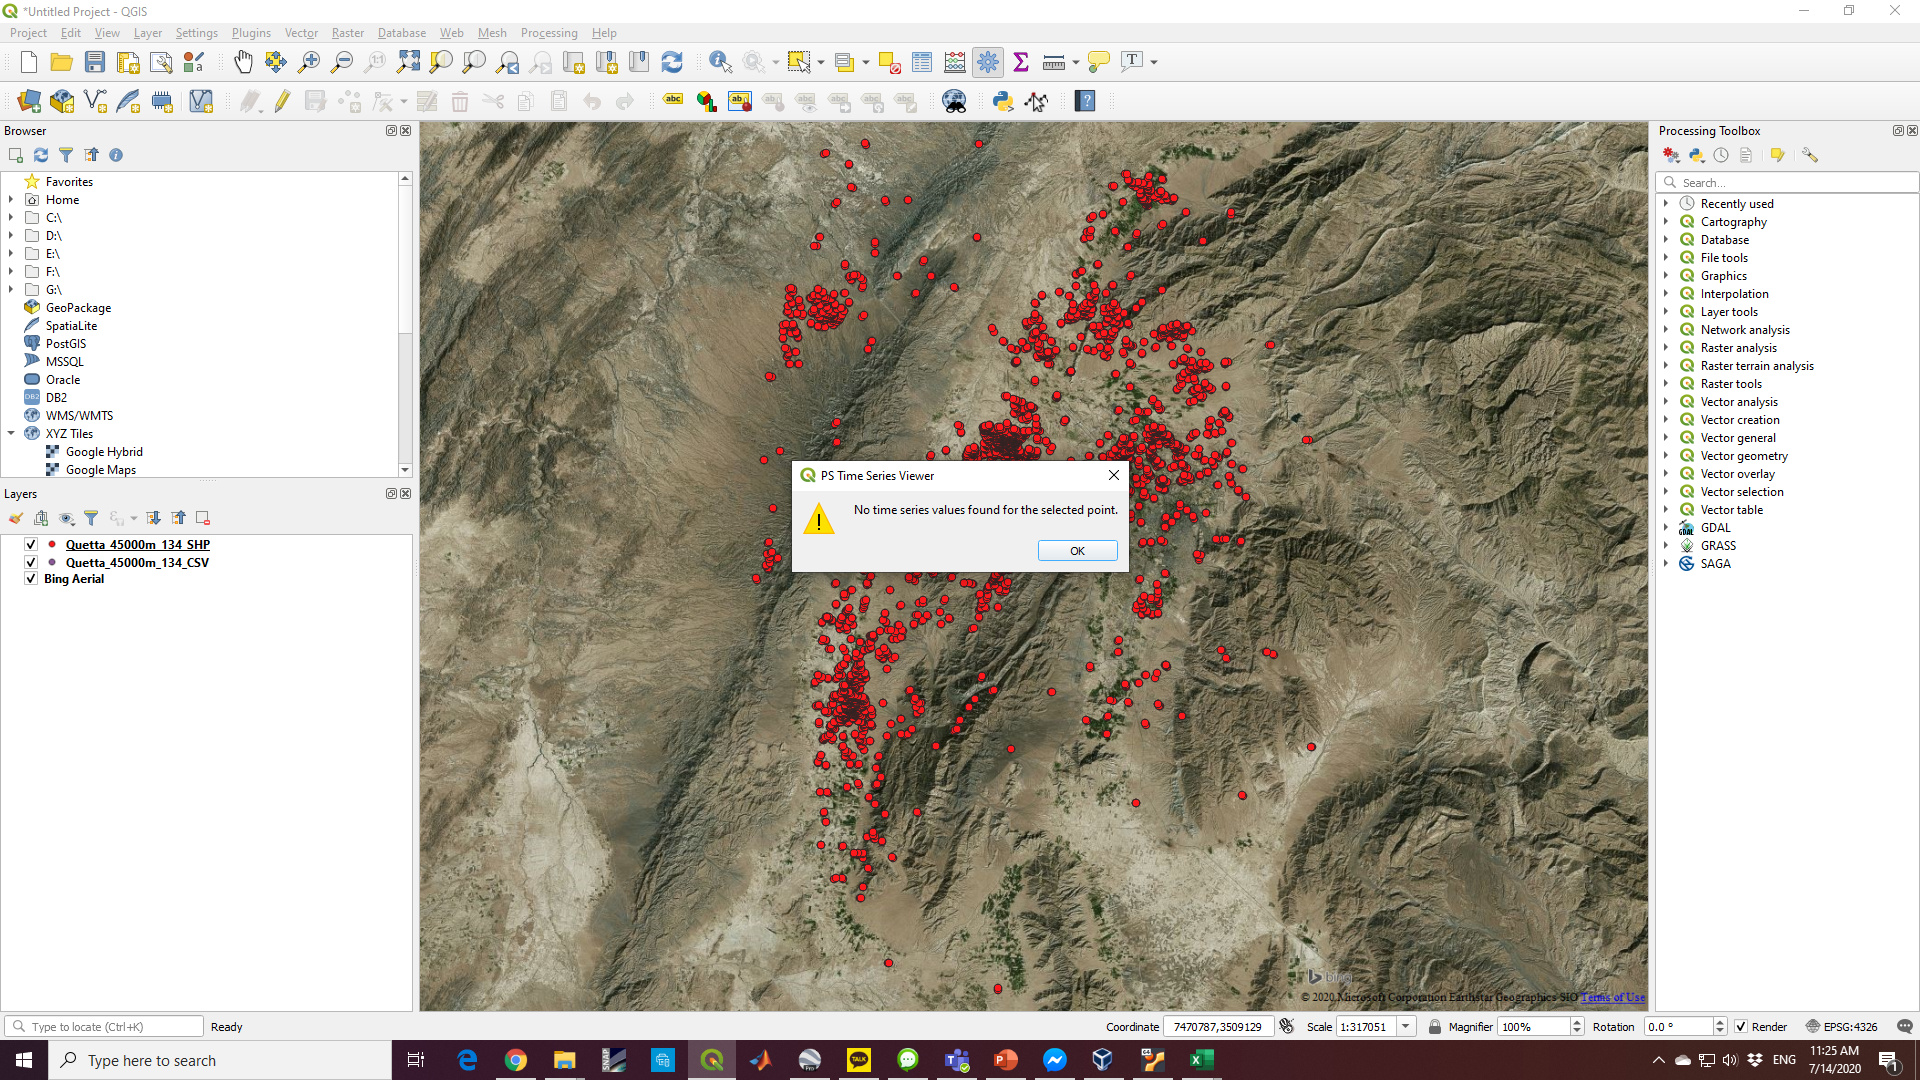
Are there additional steps I am missing here?
Also to display the displacement velocity profile, I should only me using the ‘velocity’ column, right?
I did the following:
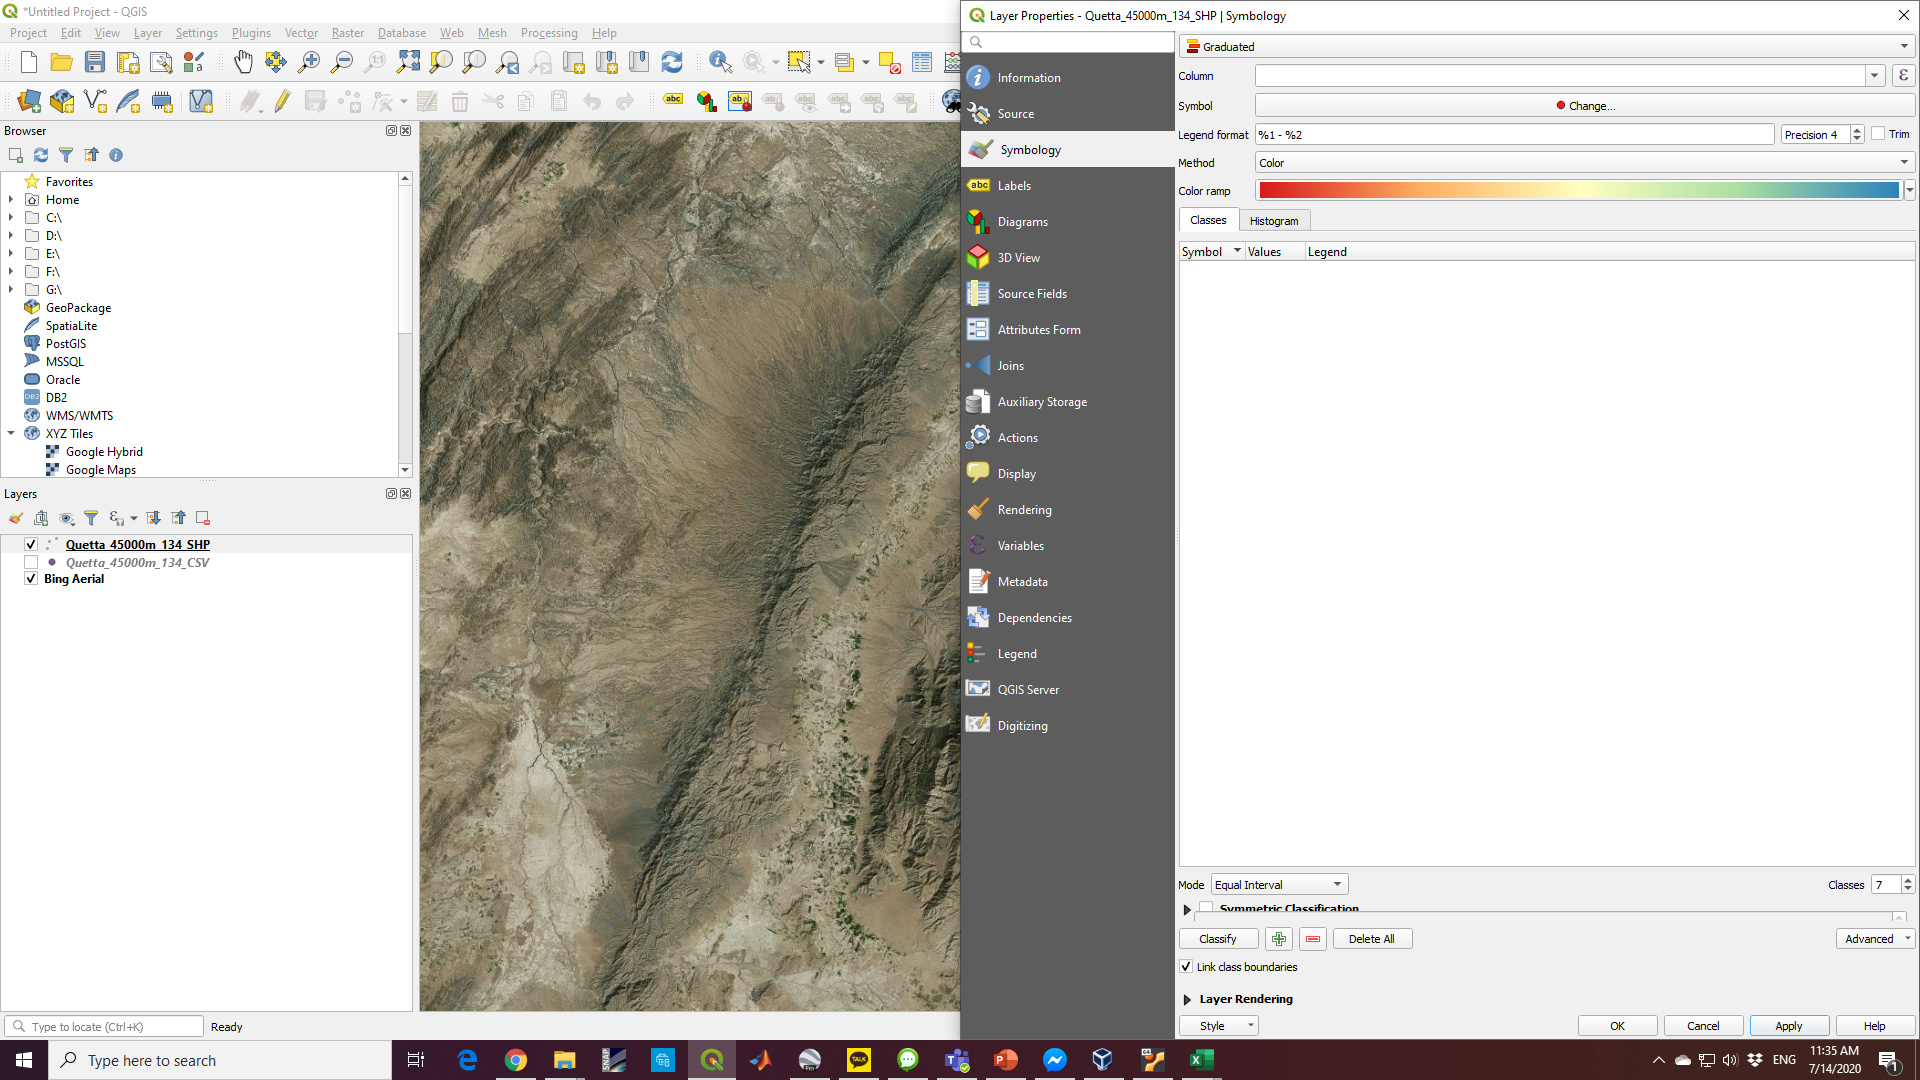
- Properties —> Symbology —> Graduated. The Column drop down menu doesn’t show the data attributes.
- Mode is Equal Interval with 7 Classes.
- Classify —> Apply
Please advise if I am on the right track.
Thank you.
Same here with the error, the plugin might have changed. But you still shouldbe able to display the example data from the plugin’s page. Carefully compare it with the output you created, some adjustments are necessary, especially in the header. The file structure must be exactly the same.
Nevertheless, the velocity attribute should be recognized after the import, maybe it’s for the same reason.
Hi, @ABraun!
I think I am okay already with the displacement velocity visualization in QGIS. Please see image below.
I’ve compared it with that of the StaMPS Visualizer. Please see screenshot.
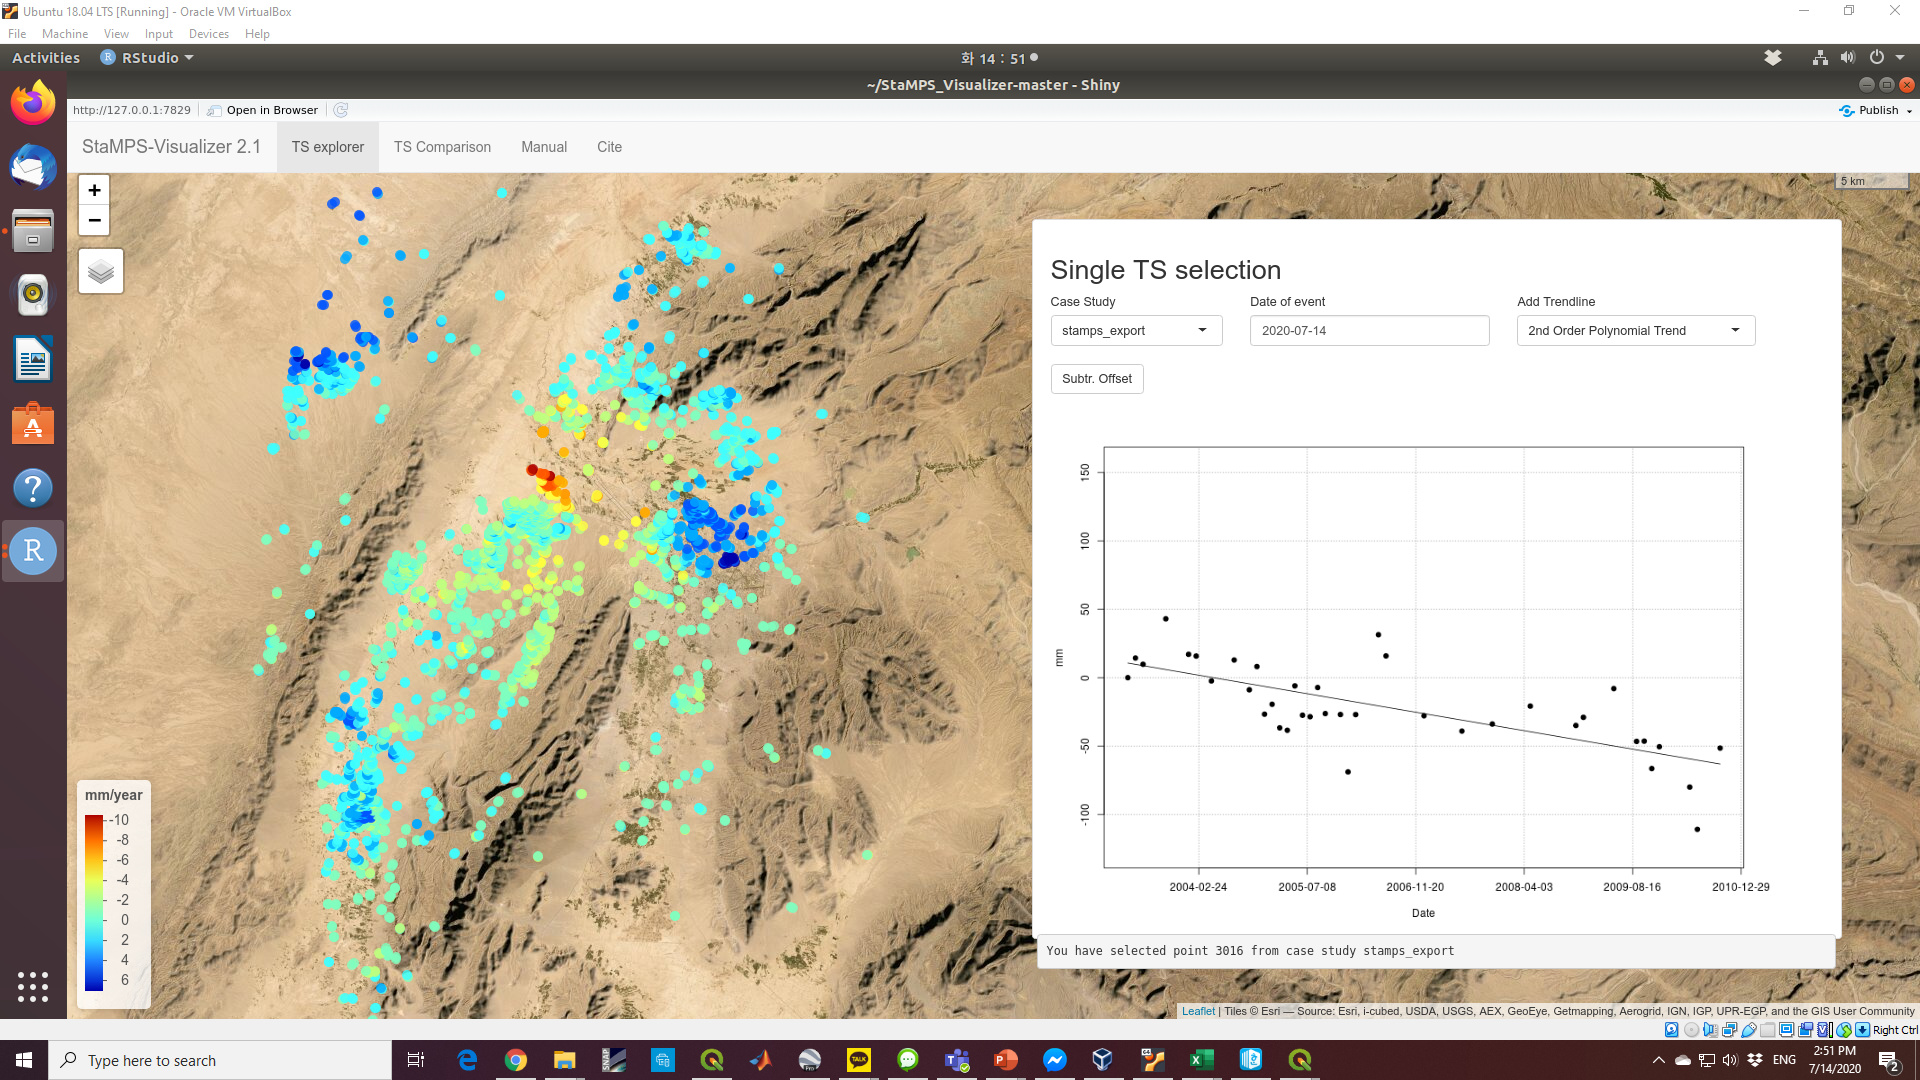
I think both are similar.
Thank you.
Yup. I have noted these adjustments as you’ve pointed out here (i.e., long, lat, velocity, Dyyyymmdd). And as I have mentioned, I’ve used initially your example Quetta data for familiarization. I hope there’s a way to solve this error to display the time series in QGIS.
Thank you.
good job! 
Dear Snap2stamps community,
I recently discover a small problem on using this series of commands in matlab in order to export the data as csv:
ps_plot('v-do', 'ts');
load parms.mat;
ps_plot('v-do', -1);
load ps_plot_v-do.mat;
lon2_str = cellstr(num2str(lon2));
lat2_str = cellstr(num2str(lat2));
lonlat2_str = strcat(lon2_str, lat2_str);

lonlat_str = strcat(cellstr(num2str(lonlat(:,1))), cellstr(num2str(lonlat(:,2))));
ind = ismember(lonlat_str, lonlat2_str);
This block here is really important!
disp = ph_disp(ind);
disp_ts = ph_mm(ind,:);
export_res = [lon2 lat2 disp disp_ts];
and continue with:
metarow = [ref_centre_lonlat NaN transpose(day)-1];
k = 0;
export_res = [export_res(1:k,:); metarow; export_res(k+1:end,:)];
export_res = table(export_res);
writetable(export_res,'stamps_tsexport.csv')
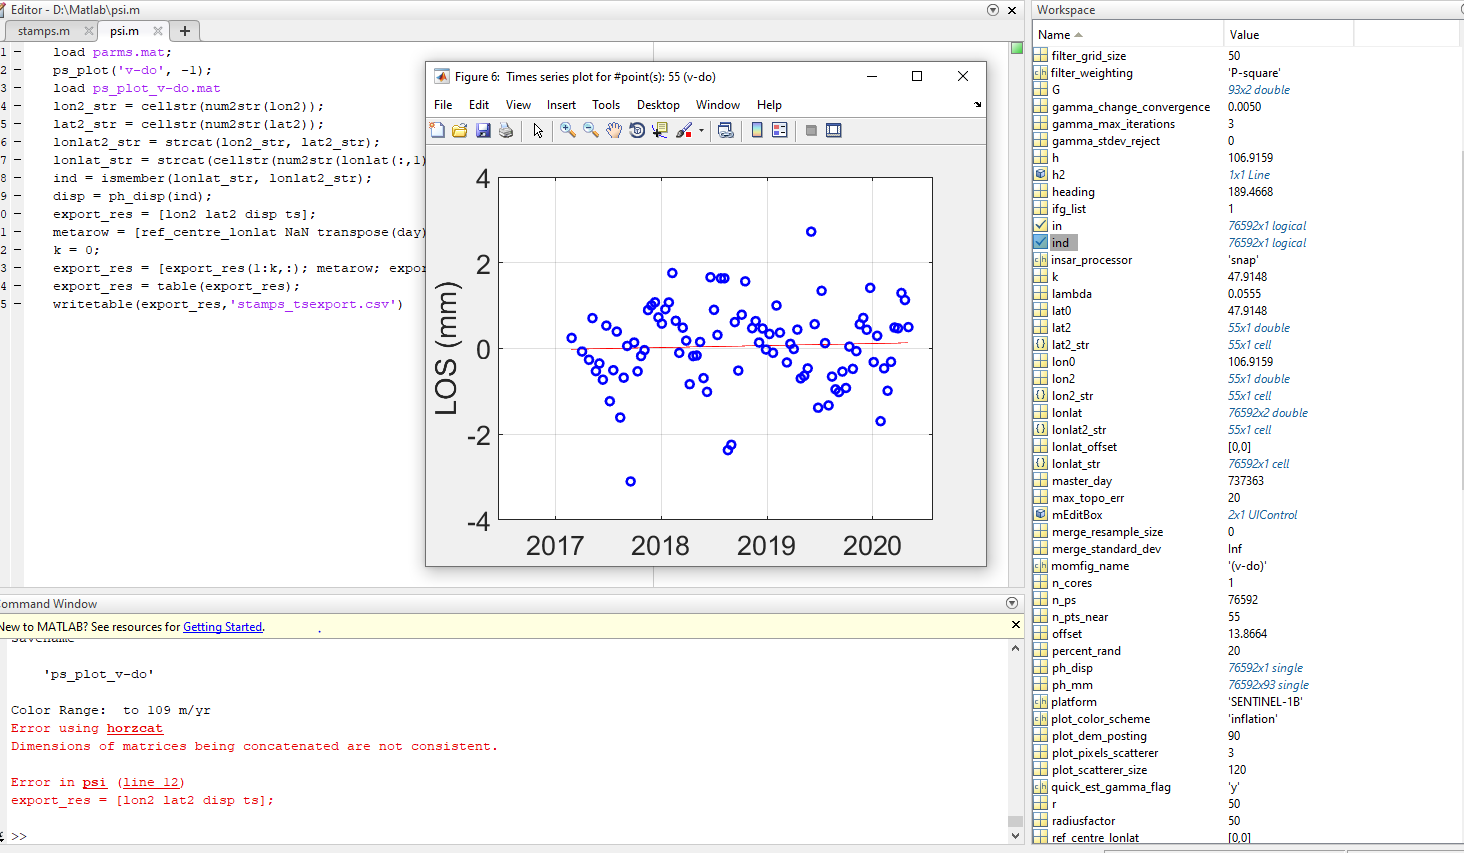
The problem is that although (in the stamp ver 4) the ph_mm object contains all the data about time series (whereas in the stamp ver 3 the object was called ts) as soon as I want to export another results based on train atmospheric correction (‘v-dao’, ‘a_l’ for example instead of v-do) the time series matrix does not change. The velocity value changes but the ts or ph_mm shows the same values. Did any of you already coped with this issue previously? Is there a way to solve that?
I tried by changing every time the setparm(‘subtr_tropo’,‘y’) followed by setparm(‘tropo_method’,‘a_l’) but that did not solve the issue.
Best regards
Buendia
1 Like
Dear @buendia,
interesting, if I remember right, the ph_mm object is created when you use the
ps_plot('v-do', 'ts');
load parms.mat;
ps_plot('v-do', -1);
load ps_plot_v-do.mat;
command. I assume you do this before export and always use StaMPS v.4.x , but if not, please retry.
You are right, that the ps_mm should change when you use TRAIN in comparison to the powerlaw approach or simply no atm subtraction, however I am not too familiar with TRAIN an not sure which objects are created while using it, If you want to be sure, which objects are created to figure out what is going on, restart matlab fresh, redo the plot_ps etc. lines and track which objects appear in your environment when you apply TRAIN. if then, the ph_mm object does not appear, there must be another place they store it. But I doubt it. If you like post screenshots of your full MATLAB Environment here that we can check this out together.
Hi,ryeramirez,
1.How did your base map made ?2. How to set PS points shadow ?any suggestion is appreciated ,thank you
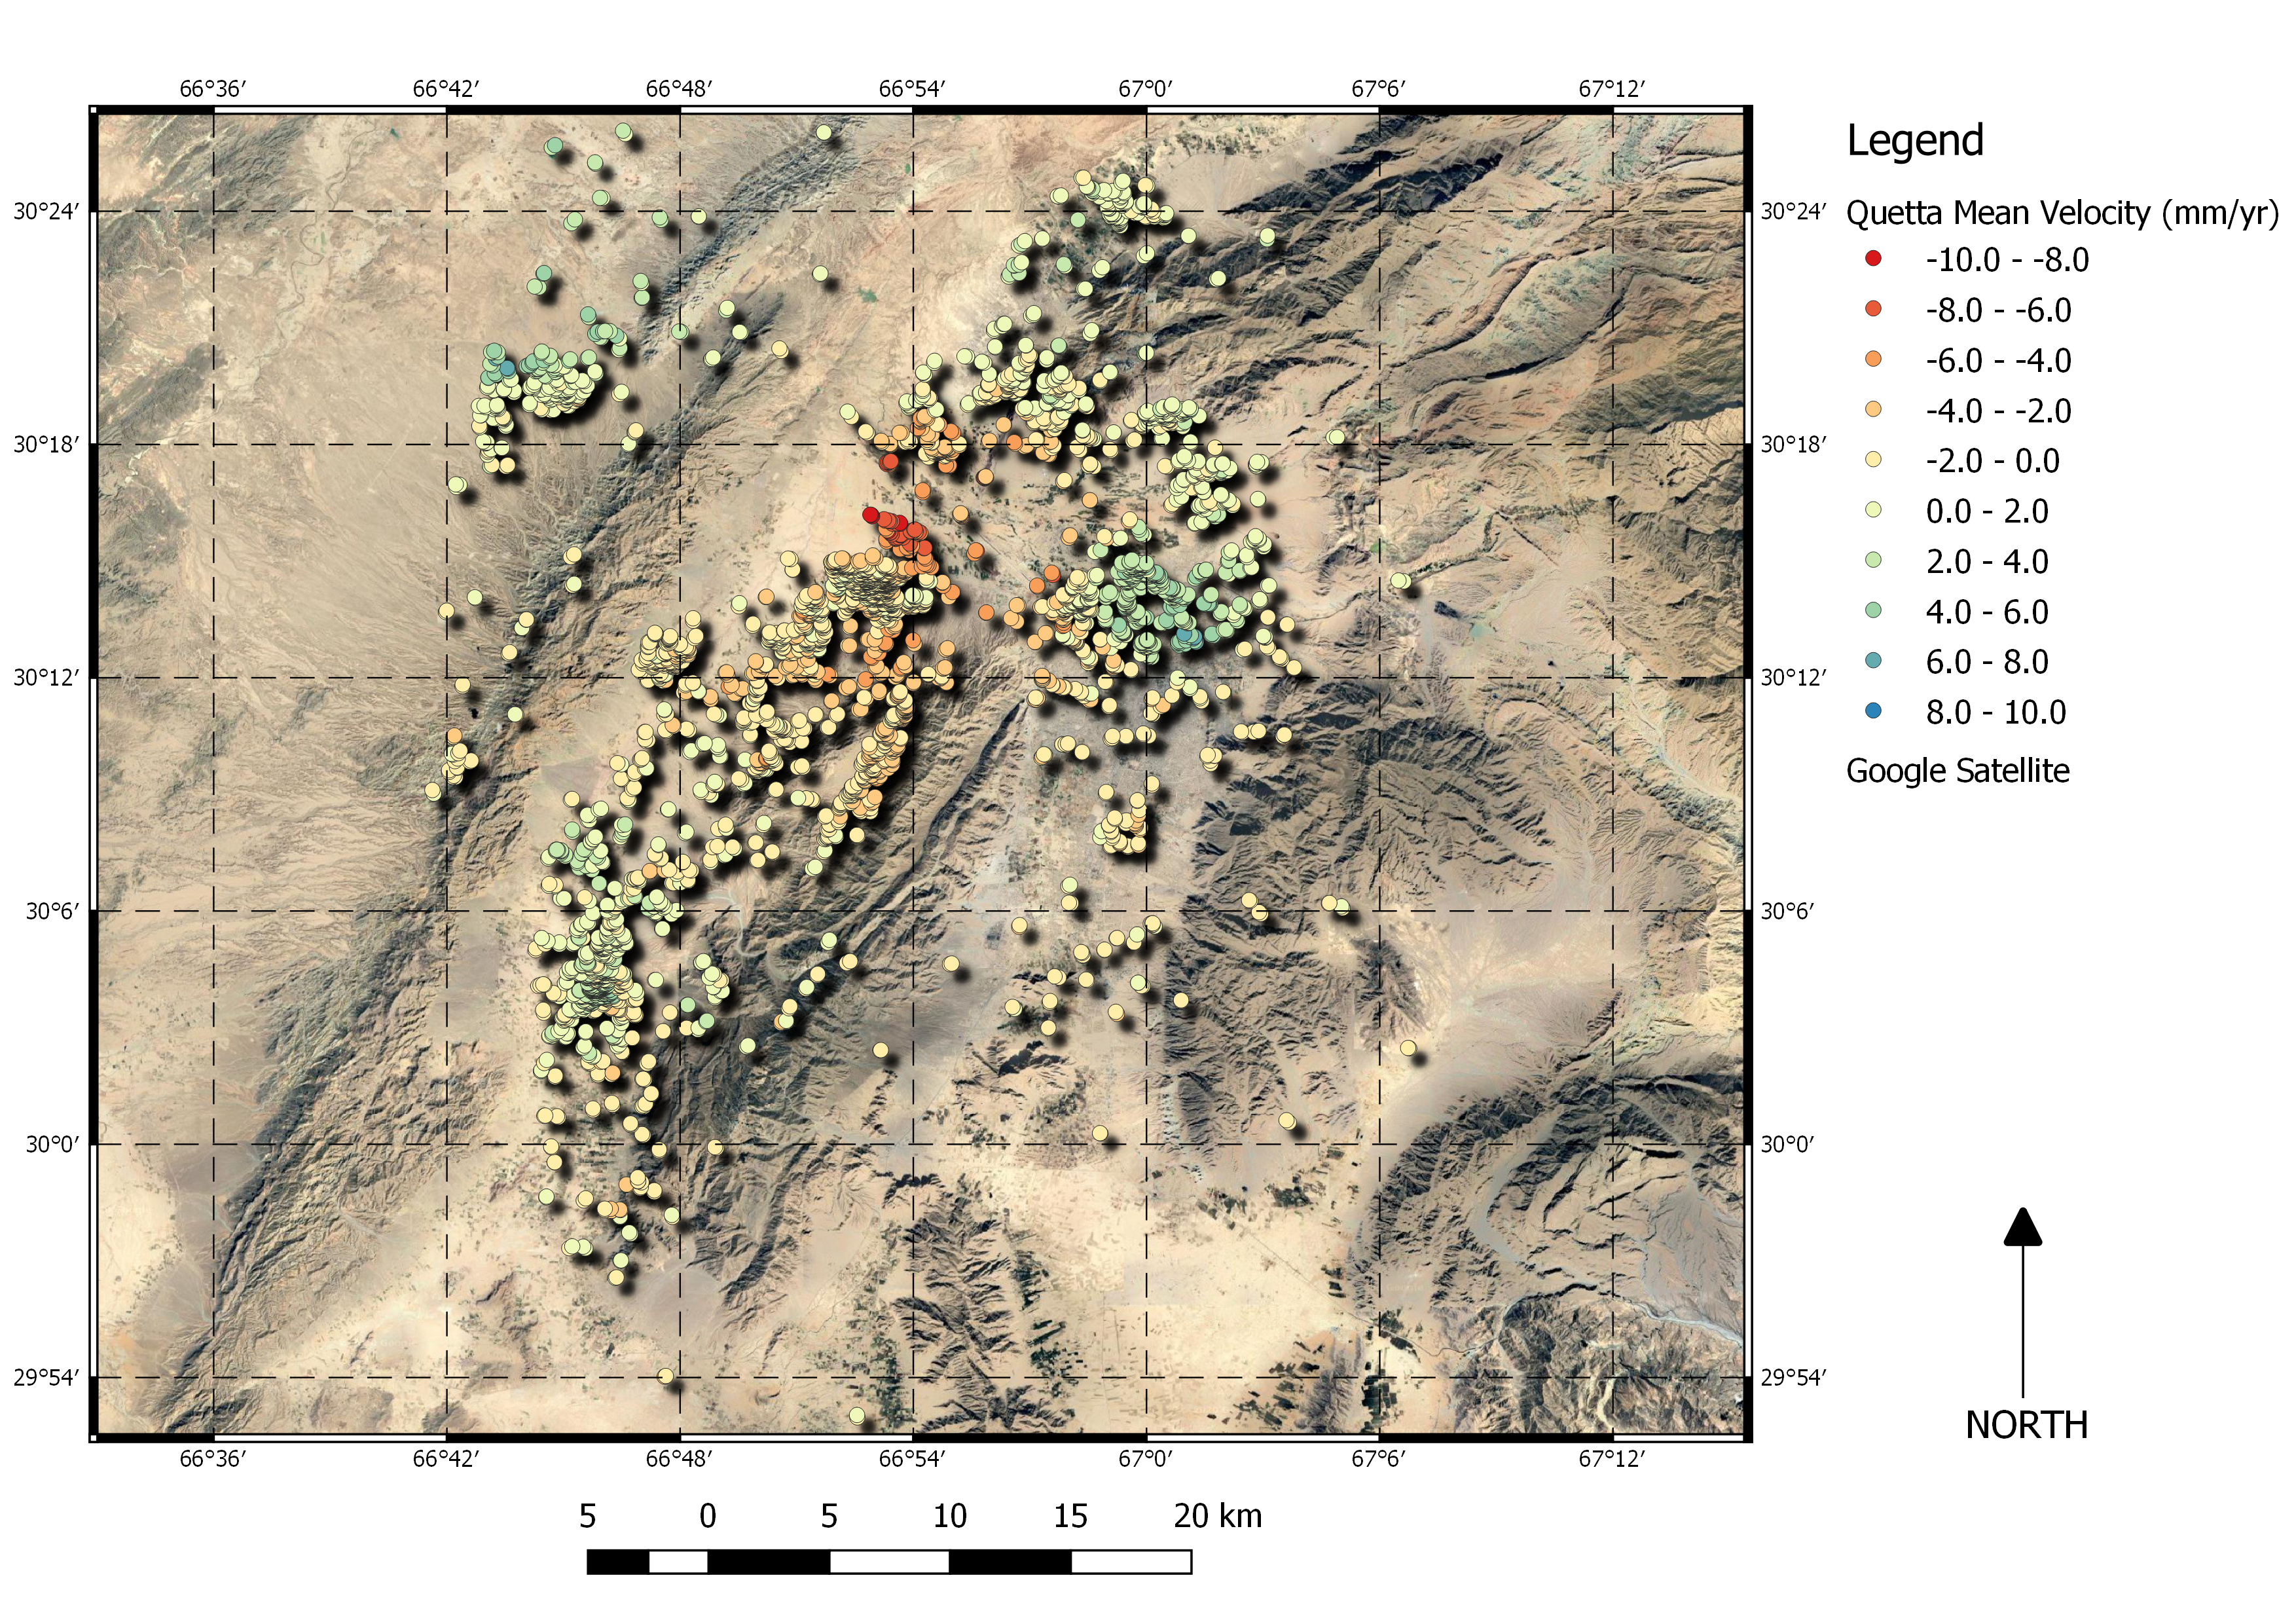
Hi! I am quite new to QGIS and I just simply followed the steps through this video (found towards the end).

QGIS has a number of base maps available through the Browser panel or the OpenLayers plugin (Web tab), and as you can see I simply used the Google Satellite as my background image. Regarding the PS points shadow effect, you can go to Symbology in Properties and under Layer Rendering just check Draw Effects then the Star icon will be activated. Click the Star icon and the Effects Properties dialog box will appear.

I hope it helps.
3 Likes

