Hi @ABraun, may I know how did you solve this problem? I put the radius over 100000m to include all of PS point, otherwise the script wouldn’t work, but now i visualize all of the TS point, making the viewer very slowly. I noticed that I can solve this using the command in the following picture, but I don’t understand where do I write the polygon coordinates …
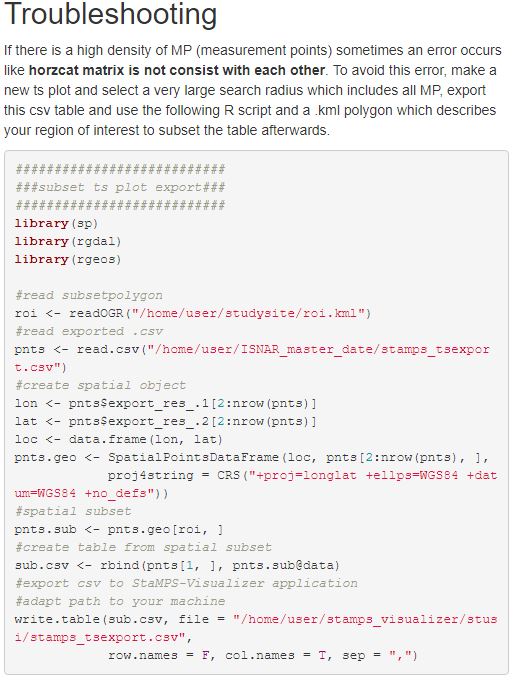
roi.kml is a vector defining the area. You can create a shapefile in QGIS and then convert it to kml.
1 Like
I just wanted to state that I had the same problem of @badrulhudahusain, and i followed what he sad about deleting the “.”
This seems to work for me too.
1 Like
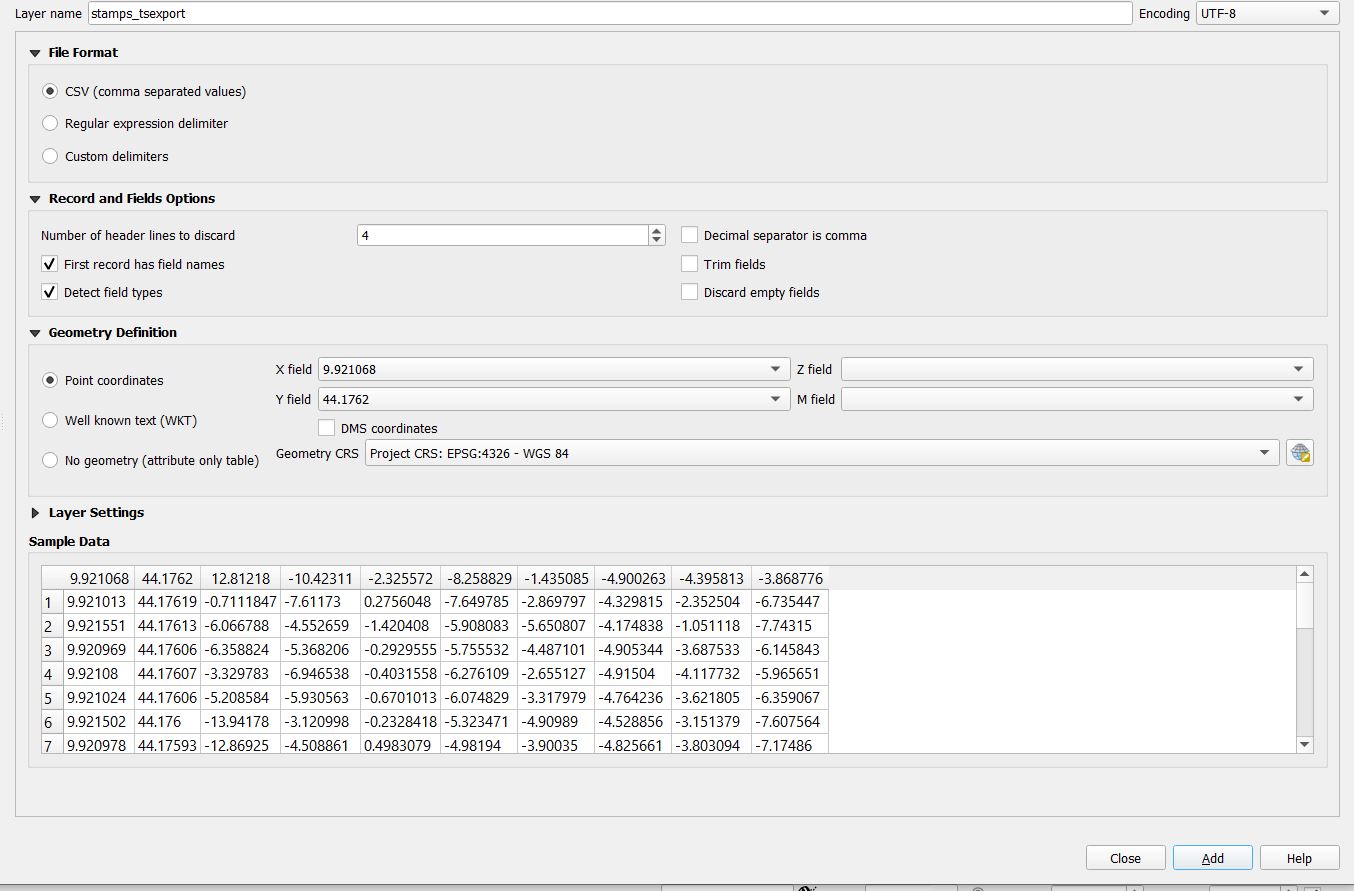
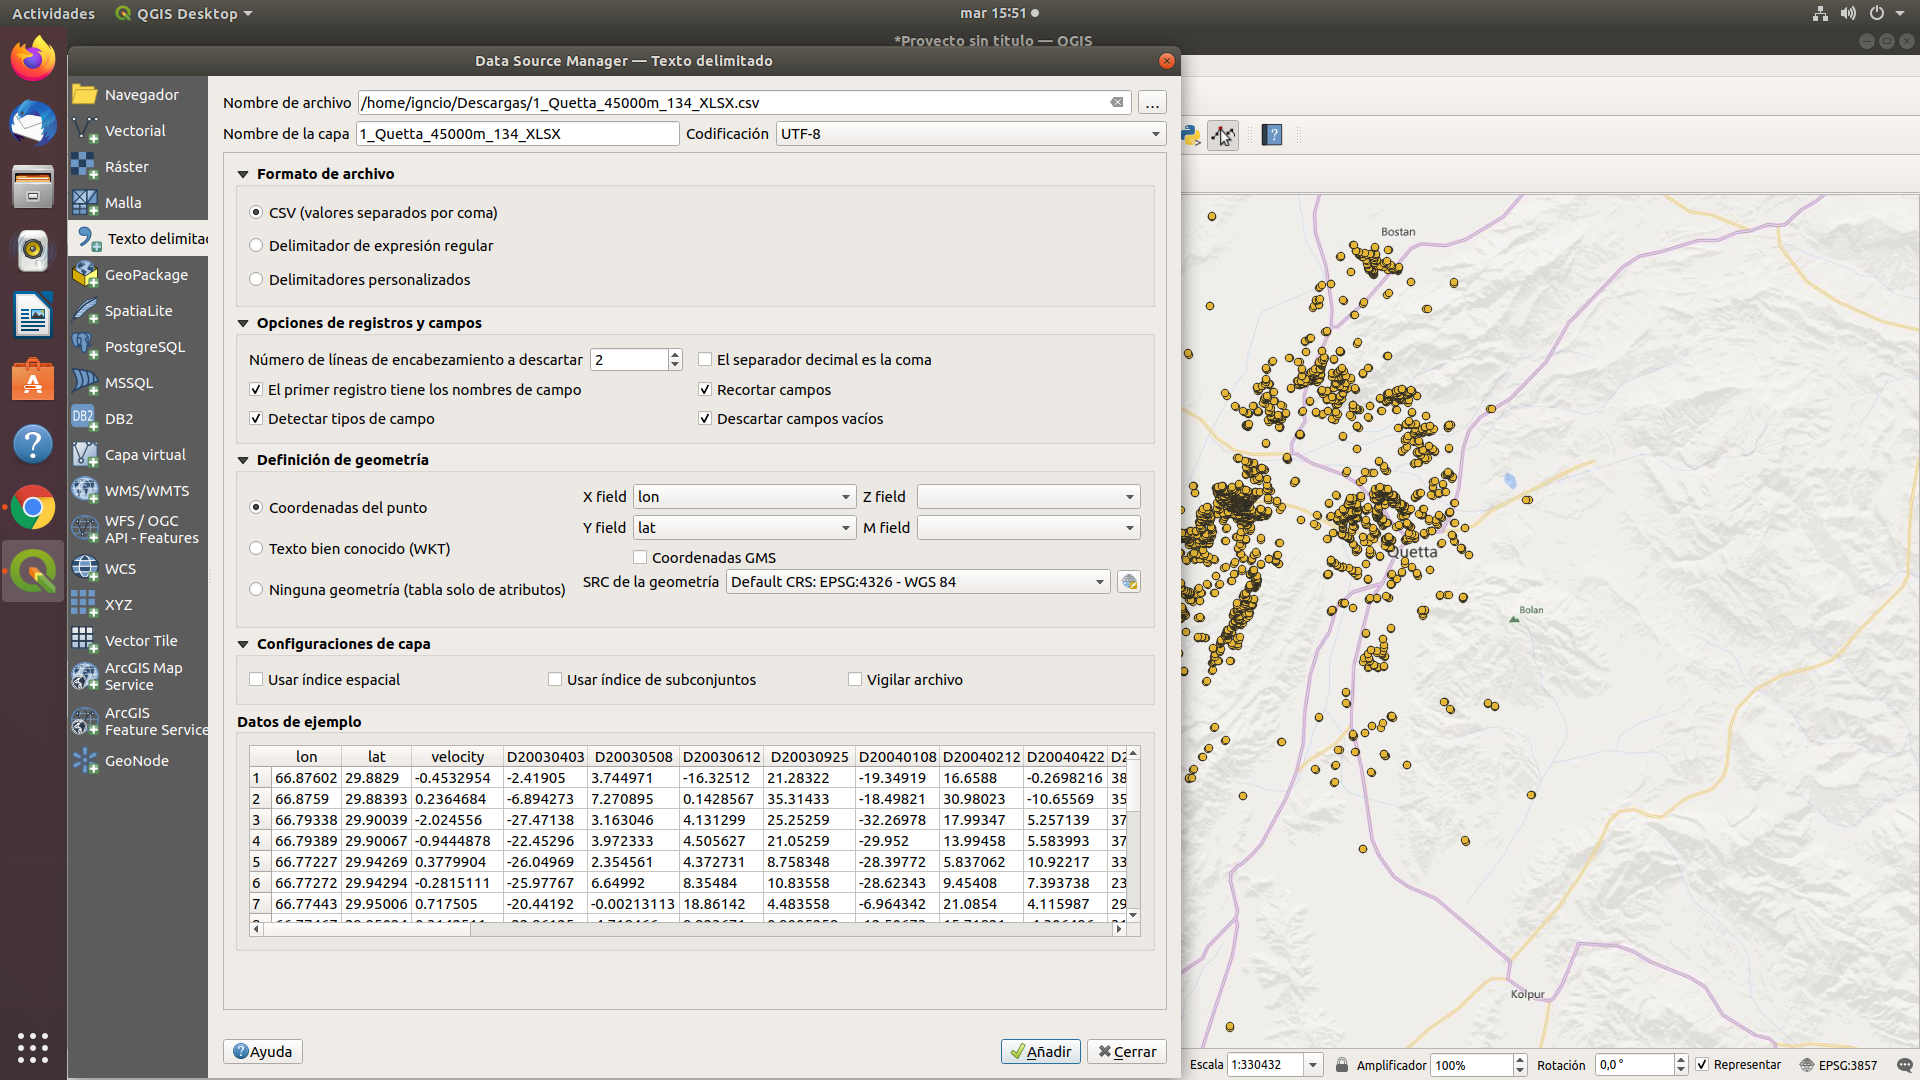
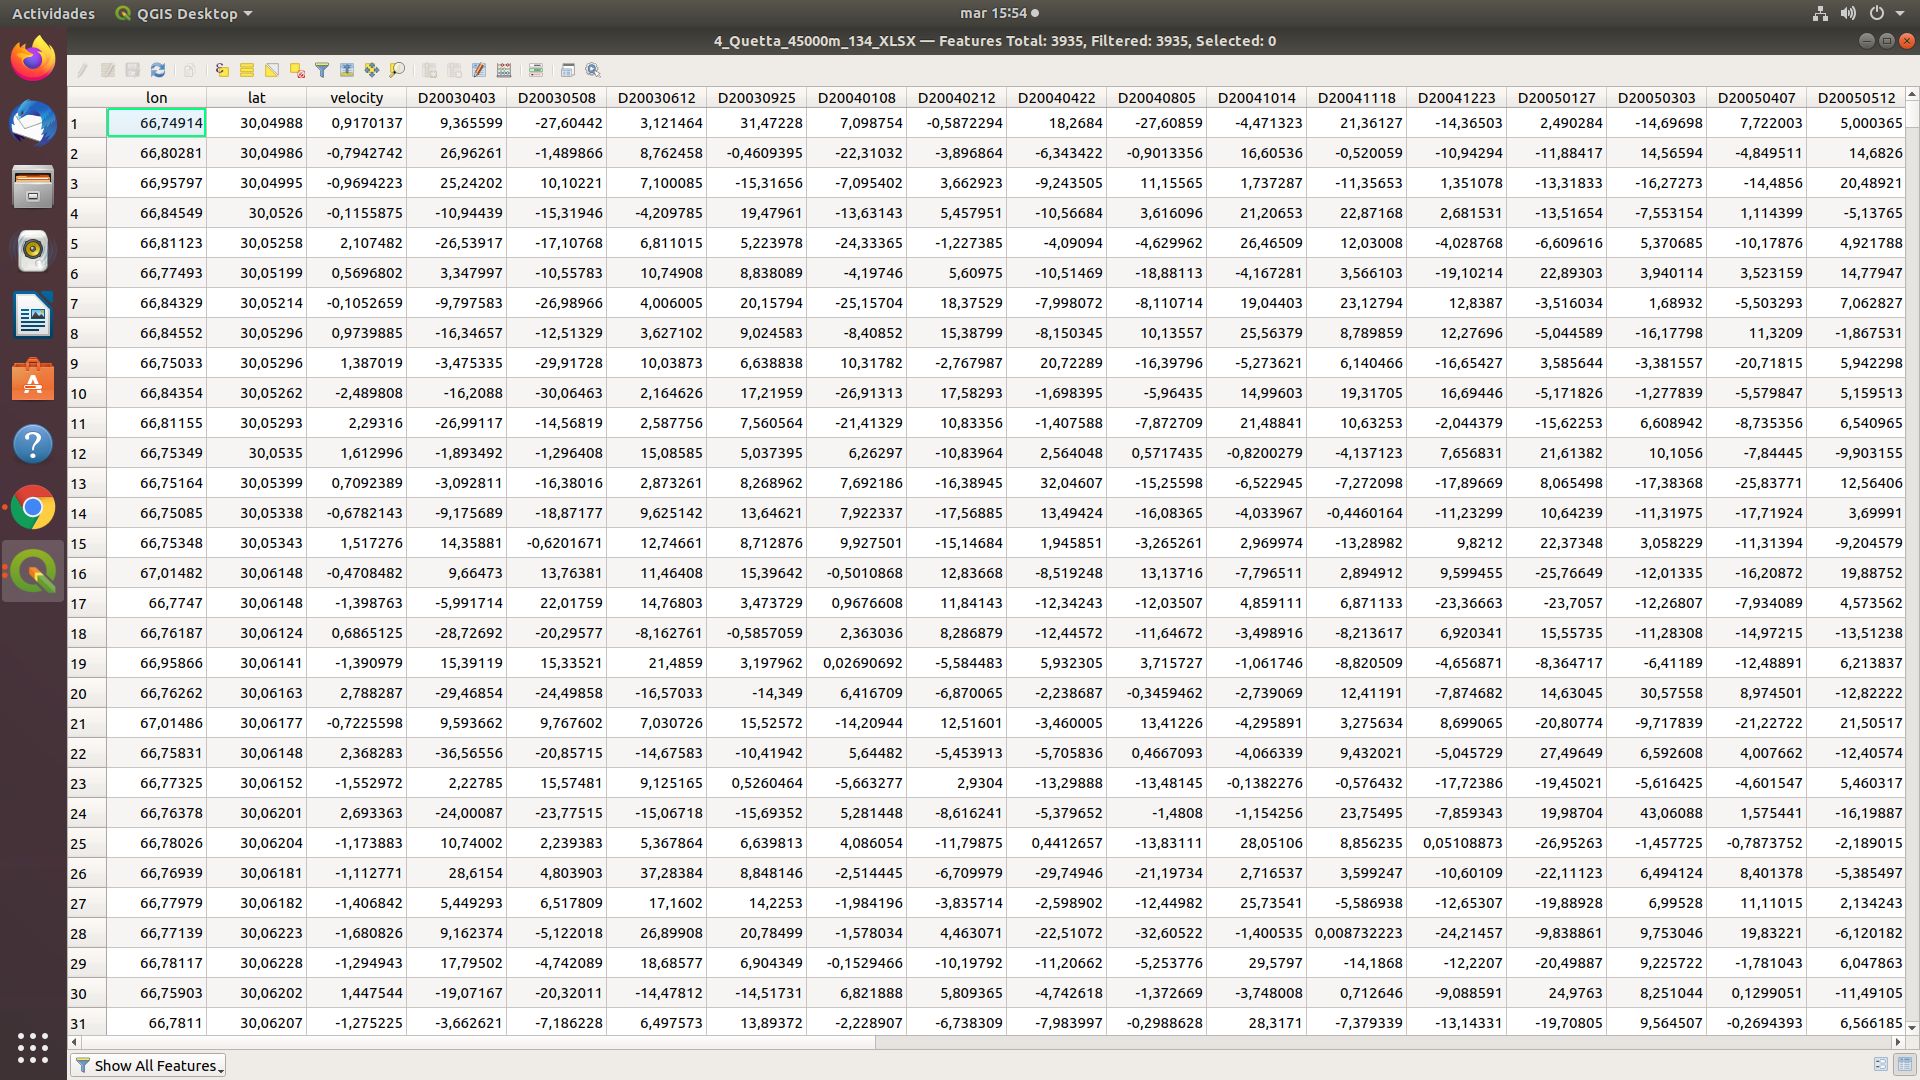
Hi, I wanted to know how do you export the data of the Stamp works in QGIS. I tried to upload the stamps_tsexport.csv from the “delimited text” option, but i only get the coordinate of points, missing the v_los mapping. This is how I do it:
Did you see this comment?
According to your screenshot, you skipped the first 4 lines. You have to adjust the file a bit, at best in Excel, as described in my post above.
thx for the reminder, I updated the manual in the git repository.
2 Likes
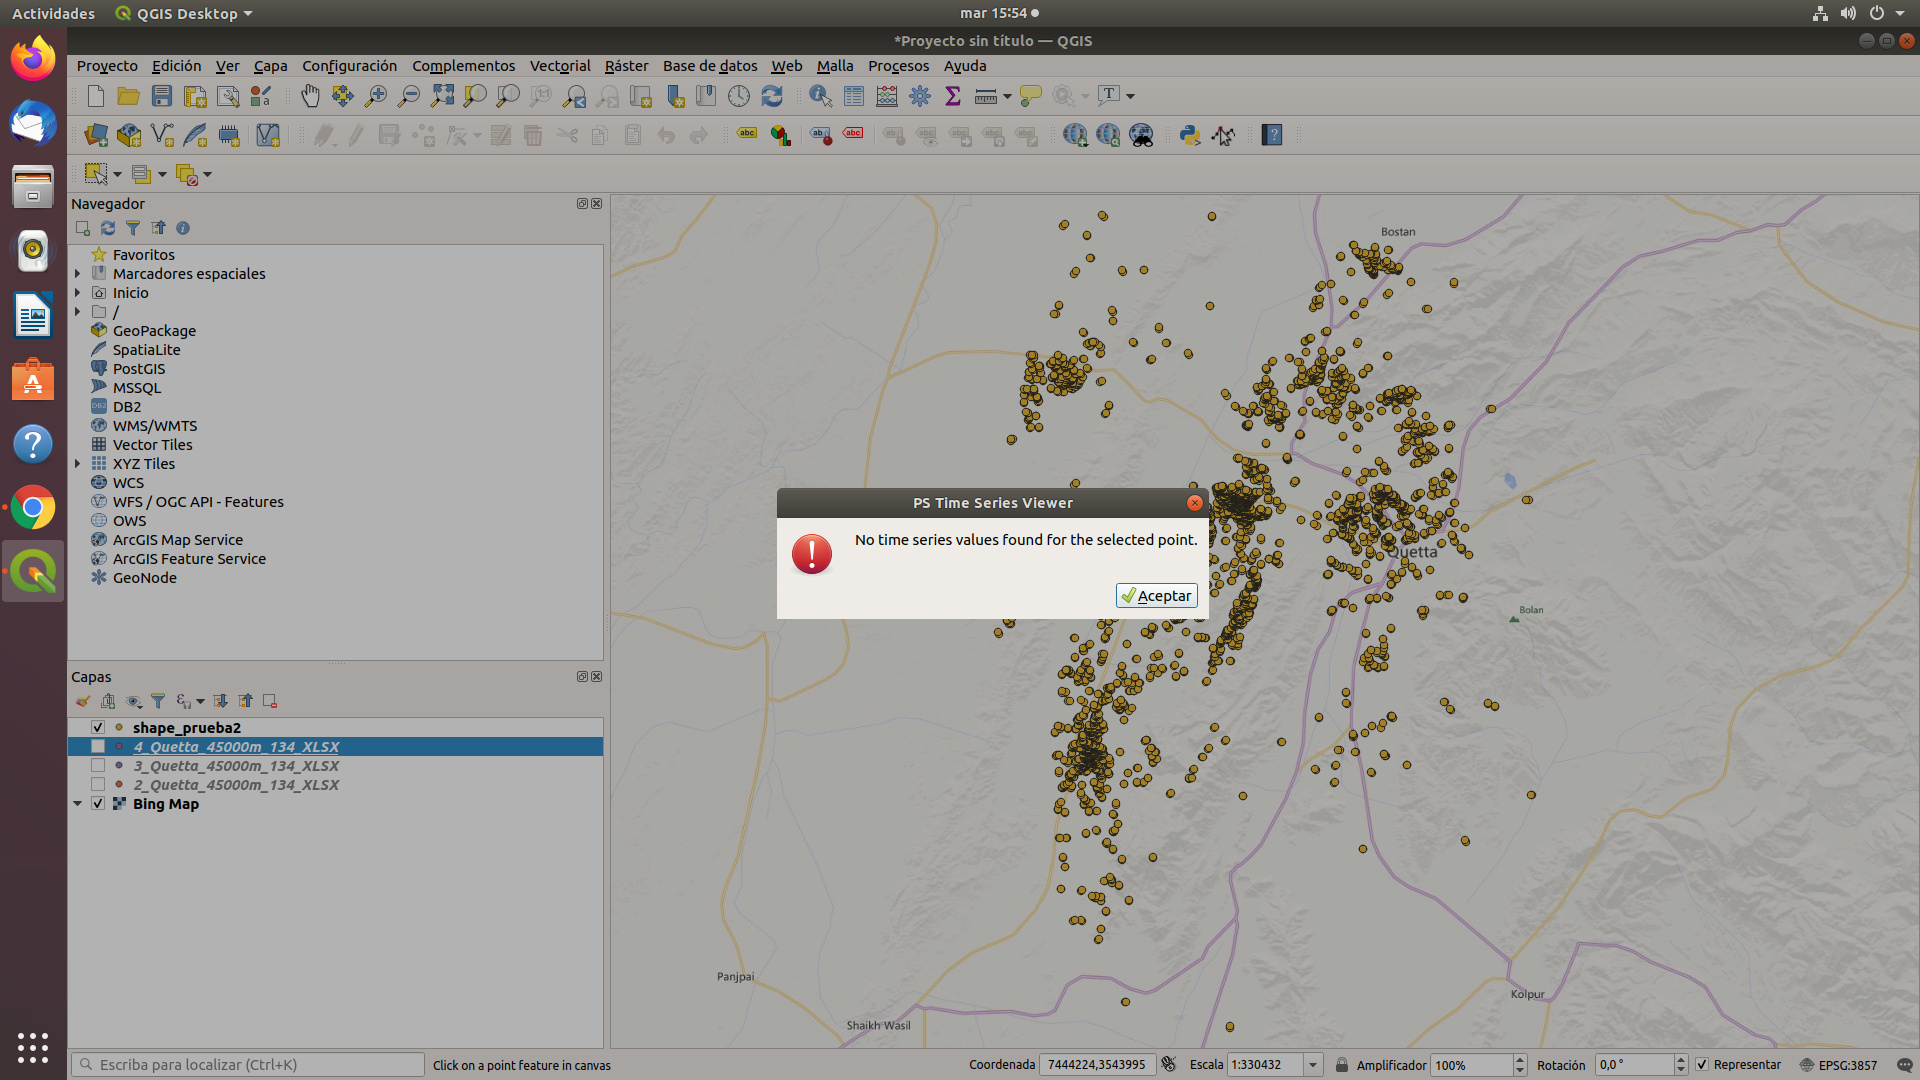
I tried again as you recommended, but it still says: no time series values found. I tried even without the first row in picture (0,0, NA, etc), doesn’t change a thing
I tried with the example of Boissano, but neither ii doesn’t work…
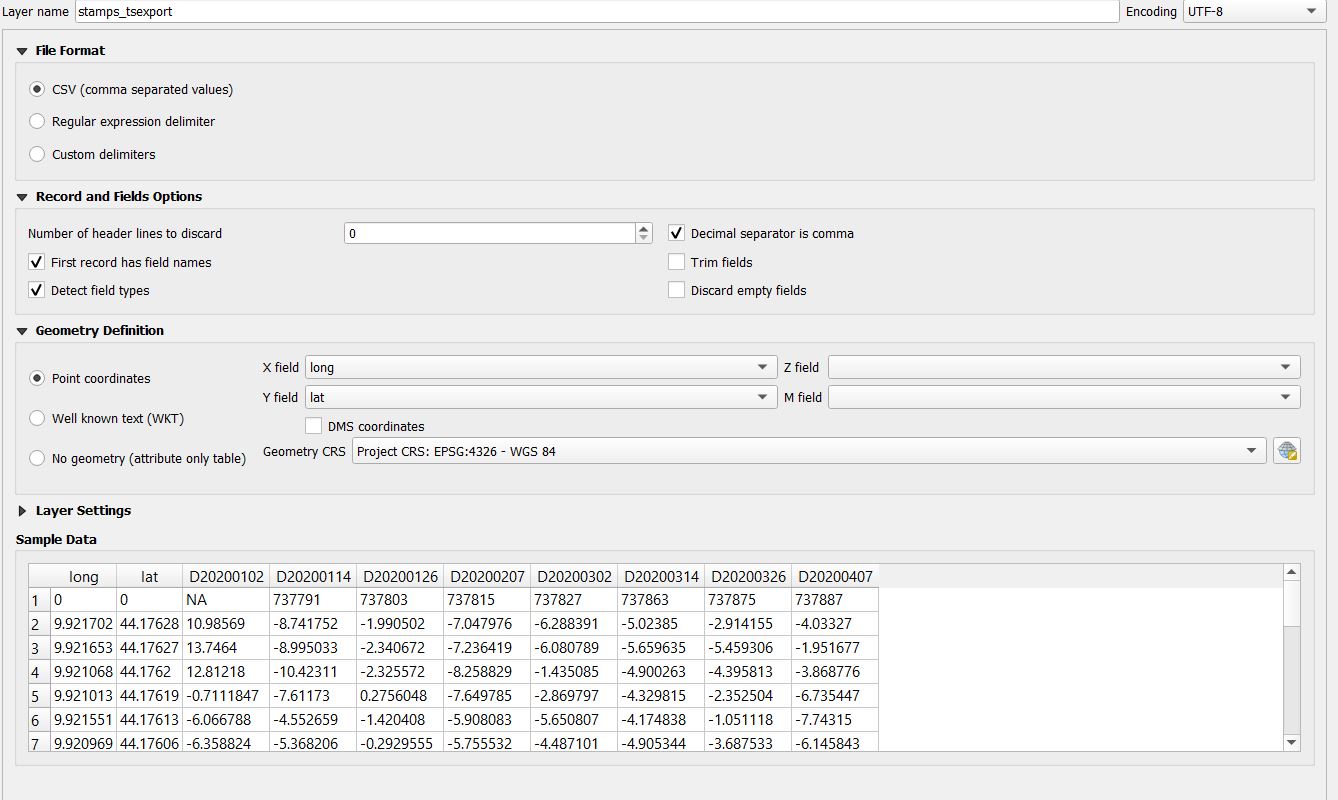
please remove “Decimal separator is comma”, because in your data decimals are separated by a point.
I did,still doesn’t work and I don’t really understand why
if not even the example dataset is taken, I expect that there’s a problem with the plugin in general.
Hi @thho @ABraun , I check csv export result and found there are different PS at the same location,
I wonder that PS points are many at the same longitude and latitude like below.
longitude latitude
139.6193 35.70552 2 -2.4 6.5 2.9 1.3 -4.2 4.6 8.1
139.6193 35.70552 -1 1.8 2.1 -4.4 -2 -4.3 -0.8 -0.5
139.6193 35.70552 4 0.8 1.3 1.5 4.9 8.7 5.7 5.6
I attached the results of Ogikubo city with ALOS-2.
How do I understand these PS points?
Are there three PS points at the same place?
I can not understand.
So I assume that 139.6193 must be 139.6193 + , something like 139.6193xxxxxx.
longitude latitude
139.6193xxxxxx 35.70552 2
139.6193xxxxxx 35.70552 -1
139.6193xxxxxx 35.70552 4
How do you think?
If so, how do I increase the digit of Longitude and Latitude ?
Thank You in advance
Best Regards
Badrul
1 Like
you are right, I also assume that there are some digits missing…right now I have not figured out if this is because of the export (but a first test made me think that its not) or simply the processing in stamps in Matlab…maybe there, matlab uses less digits to keep processing reasonable…
However, the points are very close but the accurate location is somehow obscured. What you can do is to dig into the matlab objects created by StaMPS and compare if the numbers are more accurate there, if so I can again check the export and maybe there is something I can change to make the location more accurate.
2 Likes
Thank you for your reply, @thho
Anyway I try to use this command to get more precision in Latitide on Longitude
writematrix(lonlat,‘lonlat.csv’)
lonlat.csv
export_res_1 export_res_2
138.9081573 35.70890045
138.9081879 35.70890427
Could you help me to find out where is the reference point in StaMPS to measure displacement ? I’m thinking that StaMPS must be provide a stable point as a reference point to measure displacement, but in StaMPS Processing step from stamps(1,1) until stamps(8,8) there is no step for reference point…
How can I choose the reference point in StaMPS?
Thank you in advance
Badrul
1 Like
Regards
I have the same problem as it doesn’t recognize the file as a time series.
I have also tried with the Quetta file. Here is my screenshot:
Any solution or indication what is the fault due to?
you have to define it in the parameters, I do this before I run stamps(1,1)
You can select areference areaby setting parametersreflonandreflat(for a rectangulararea) orrefcentrelonlatandrefradius(for a circular area). All plots will then be refer-enced to the mean value for this area. If not set, the reference value is the mean value for the wholearea.
have a look here https://homepages.see.leeds.ac.uk/~earahoo/stamps/StaMPS_Manual_v4.1b1.pdf and search for reference
3 Likes
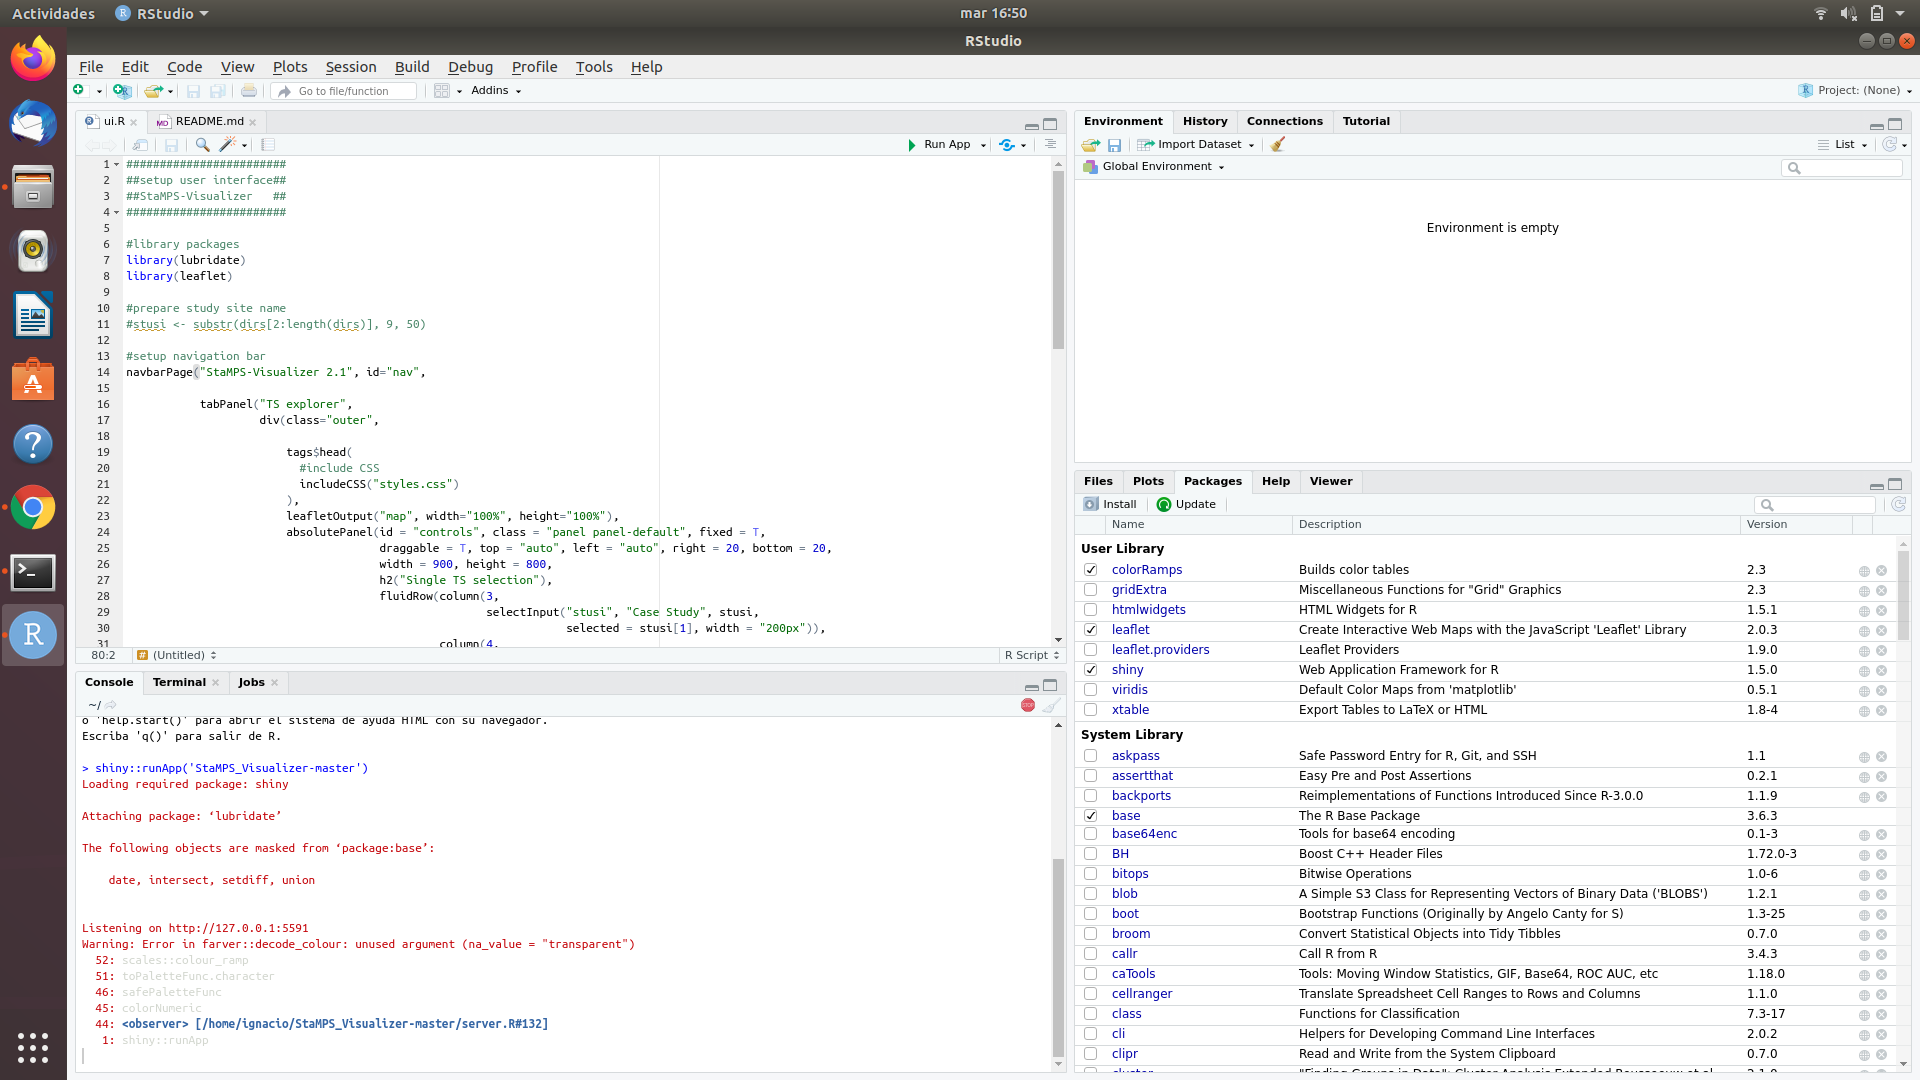
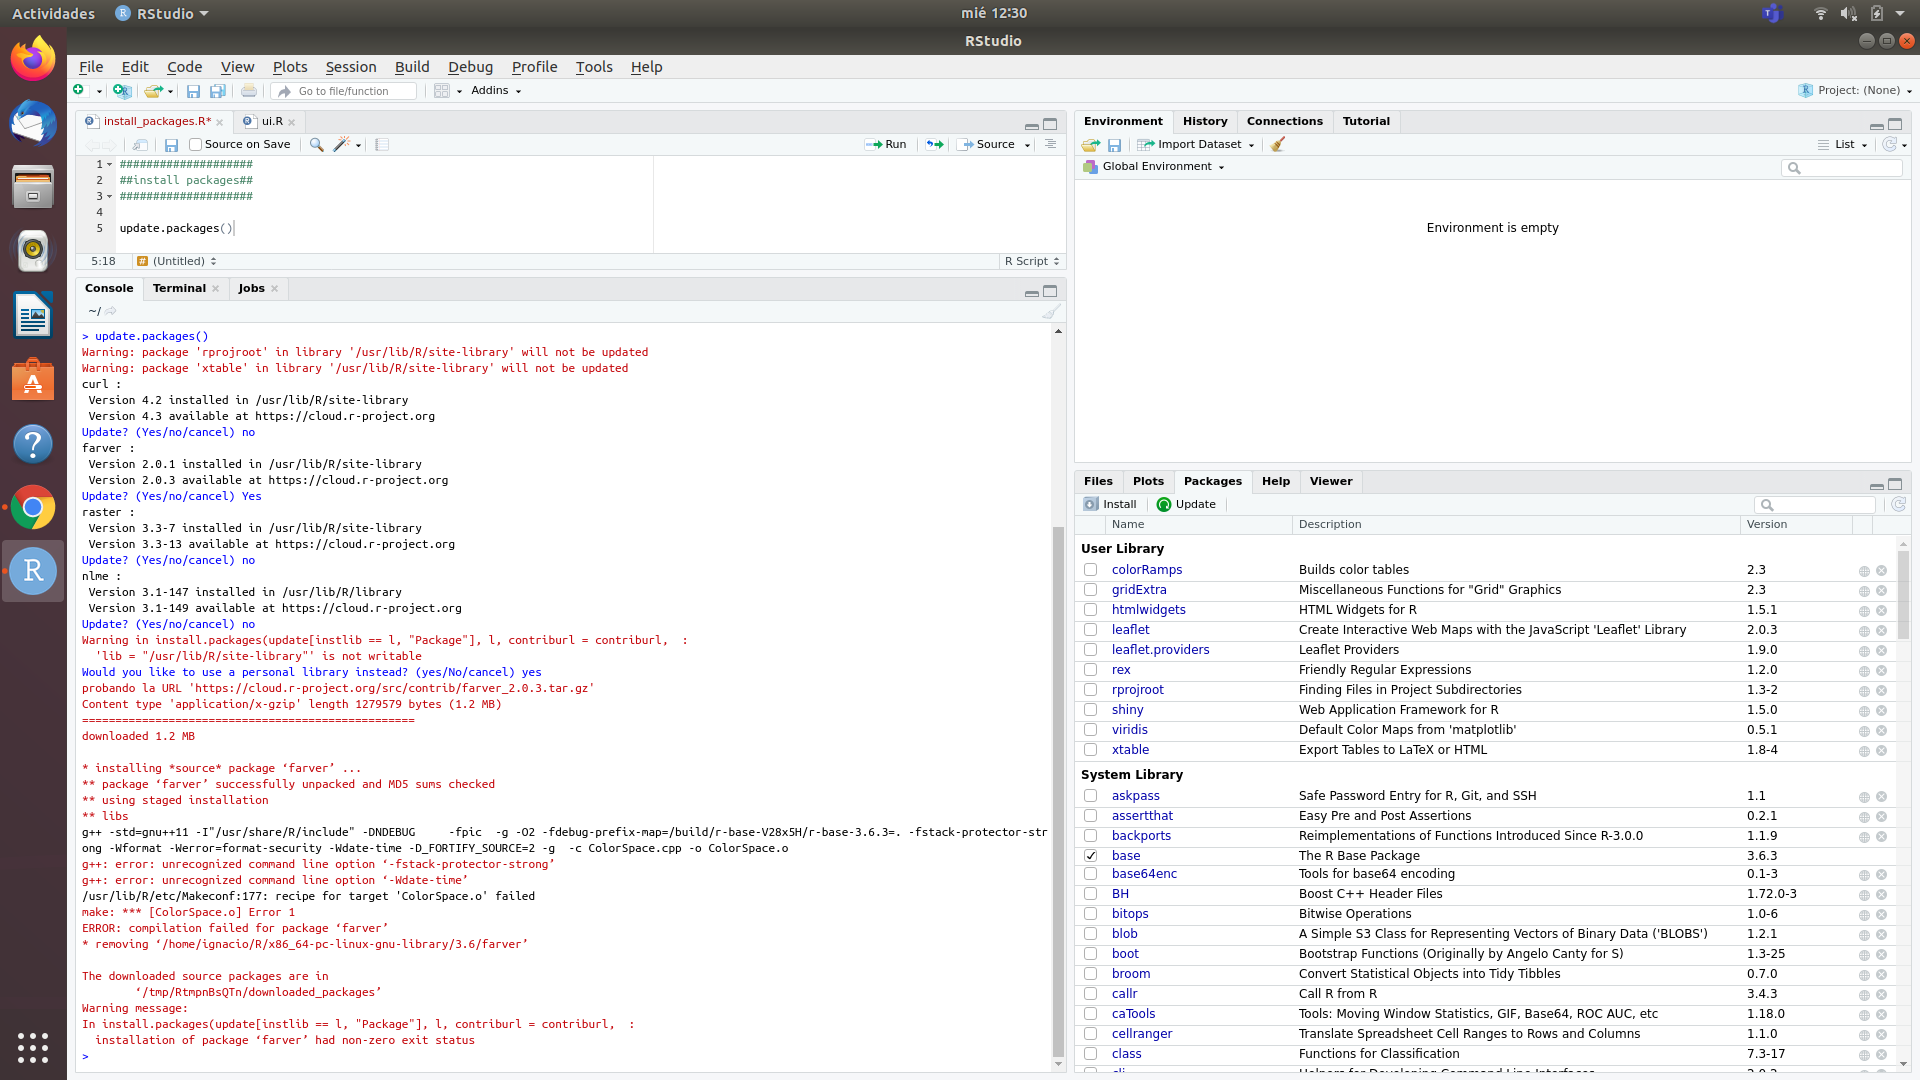
hi @nachin6789
It is about packages, I encountered this couple of weeks ago myself…if I remember right:
try reinstall colorRamps and leaflet
install.packages("colorRamps")
install.packages("leaflet")
#check for version of package farver your error-massage refers to
#it should be 2.0.3
library(farver)
session.Info()
#if farver is not up to date reinstall it by hand
install.packages(farver)
restart R Studio, try to run the app.
Should do, if not let me know.
1 Like
Thanks @thho 
sorry but I have not been able to update to the most recent farver version 2.0.3;
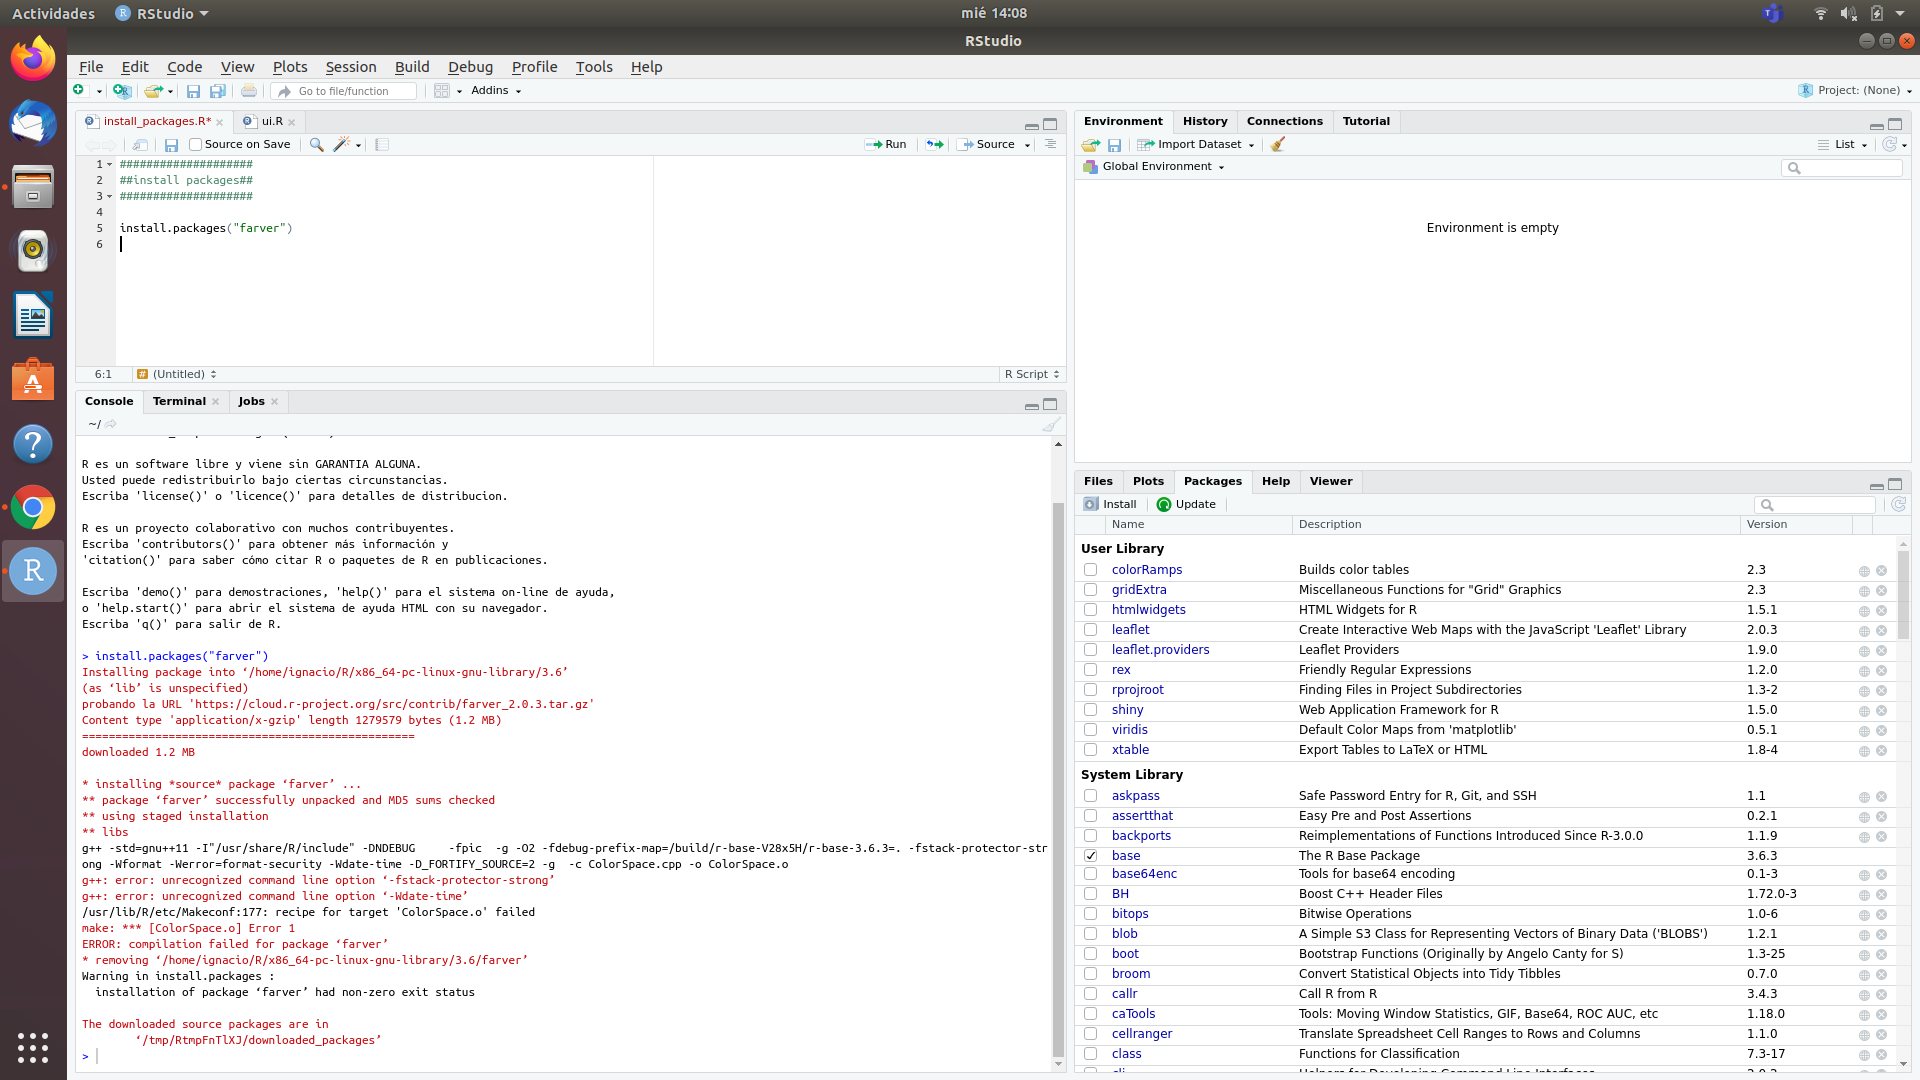
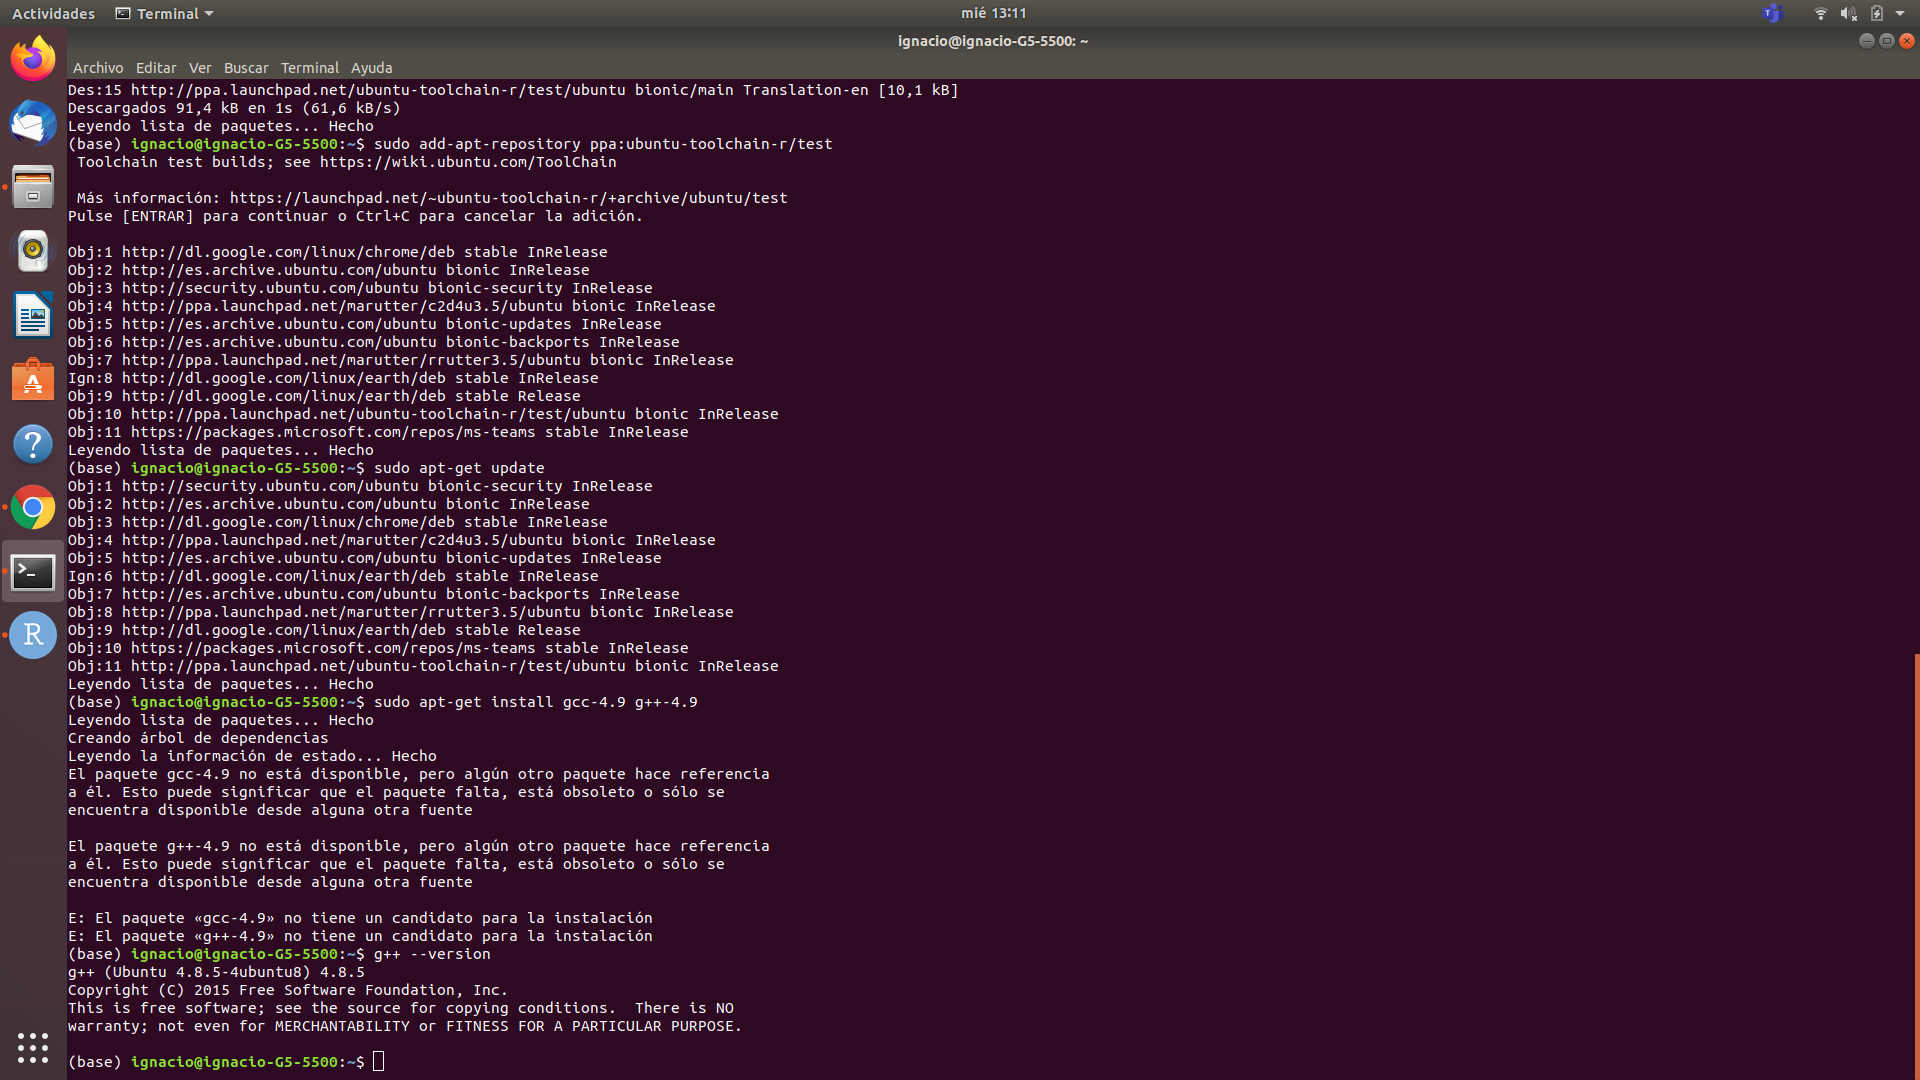
I have tried to install the gcc-4.9 and g ++ - 4.9 version but it gave me the following error:
Package gcc-4.9 is not available, but is referred to by another package.
This may mean that the package is missing, has been obsoleted, or
is only available from another source

Package g++-4.9 is not available, but is referred to by another package.
This may mean that the package is missing, has been obsoleted, or
is only available from another source

E: Package 'gcc-4.9' has no installation candidate
E: Package 'g++-4.9' has no installation candidate
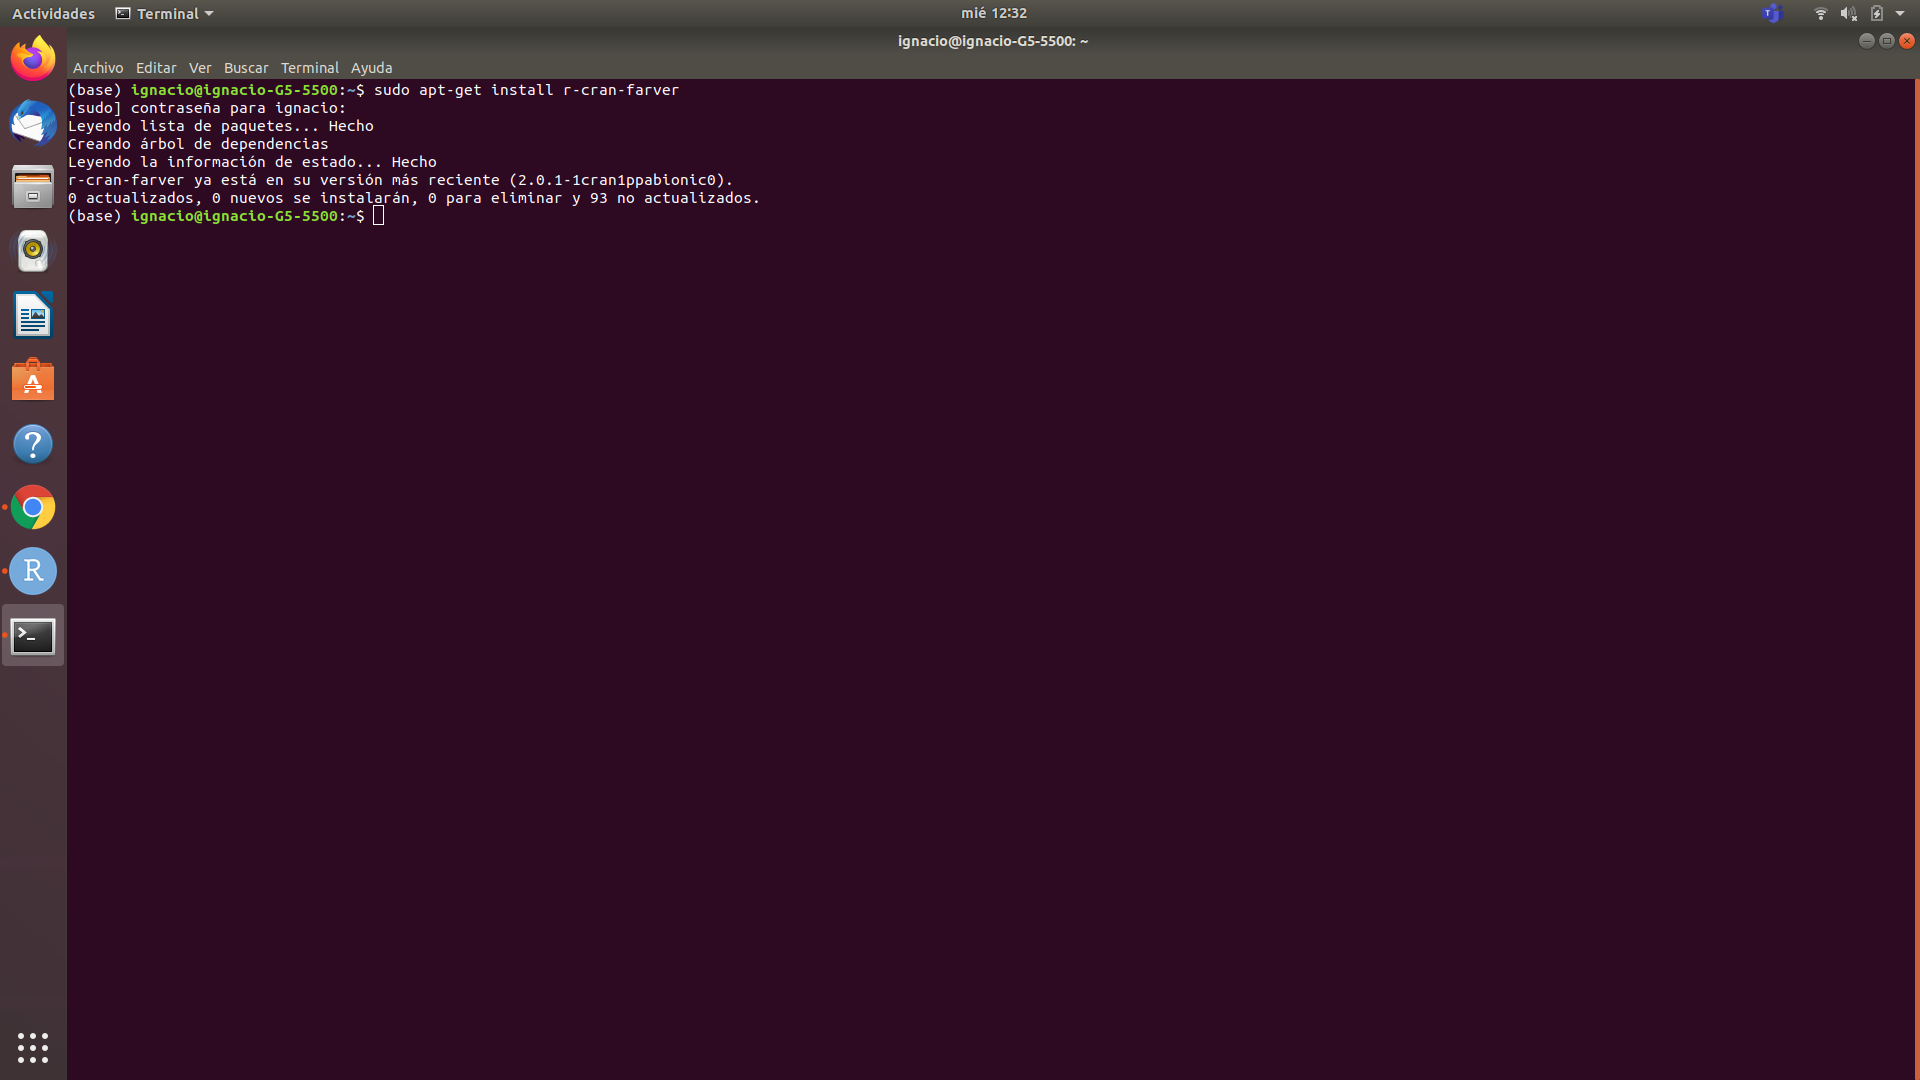
on the other hand if I try to install it through the terminal; it tells me that I already have the most recent version (2.0.1)
so at this point i’m hanging, any suggestions?
hmm for some reason I can not replicate your error…I use an Ubunut/Kubuntu 18 LTS, R Version is 3.6.3 and I can only install farver 2.0.3 not the 2.0.1 version…
I will soon upgrade to Ubuntu 20, and setup everything there fresh with the latest R and so on, I will inform you how this works out for me, maybe this is a solution also for you.