so upgrade is ready and the app works:
Ubuntu 20 LTS
R 3.6.3
I did nothing else as running the install_packages.R script. I checked that when you install leaflet, farver version 2.0.3 is automatically installed…I would recommend to try this:
library(utils)
remove.packages(leaflet)
remove.packages(farver)
#check in the package manager if they are both really uninstalled
install.packages(leaflet)
Hi, I tried your file, but it’s impossible to visualize the the Ps time series. It says: “No time series values found for the selected point” . I think it doesn’t work with the QGIS version i have installed (3.10.6-A Coruña). Is there any other way to visualize the graphs?
that didn’t work for me. I think my problem arises from the gcc-4.9 and g ++ - 4.9 versions but I don’t know how to solve this problem.
On the other hand, is there the possibility of extracting specific points that we want to analyze? instead of all the points exported in the excel file?
This question is because in my excel file I have about 4 thousand points and the viewer only allows the visualization-comparison of the first 900 points
thanks for reporting the issue with the gcc and or g++ version, on my system (standard installtion of Ubuntu 20 LTS) i get these outputs:
thho@kuburock:~$ dpkg --list | grep compiler
ii  g++                                                         4:9.3.0-1ubuntu2                            amd64        GNU C++ compiler
ii  g++-9                                                       9.3.0-10ubuntu2                             amd64        GNU C++ compiler
ii  gcc                                                         4:9.3.0-1ubuntu2                            amd64        GNU C compiler
ii  gcc-9                                                       9.3.0-10ubuntu2                             amd64        GNU C compiler
ii  gfortran                                                    4:9.3.0-1ubuntu2                            amd64        GNU Fortran 95 compiler
ii  gfortran-9                                                  9.3.0-10ubuntu2                             amd64        GNU Fortran compiler
ii  libllvm10:amd64                                             1:10.0.0-4ubuntu1                           amd64        Modular compiler and toolchain technologies, runtime library
ii  libllvm10:i386                                              1:10.0.0-4ubuntu1                           i386         Modular compiler and toolchain technologies, runtime library
ii  libllvm9:amd64                                              1:9.0.1-12                                  amd64        Modular compiler and toolchain technologies, runtime library
ii  libparams-validationcompiler-perl                           0.30-1                                      all          module to build an optimized subroutine parameter validator
ii  libxkbcommon0:amd64                                         0.10.0-1                                    amd64        library interface to the XKB compiler - shared library
For me it looks like gcc and g++ is the same on our systems. Anyway, have you tried to make a full new installation of R +RStudio, with the latest version i found it pretty straight forward:
## R and RStudio
sudo apt update
sudo apt -y install r-base gdebi-core

#download the Rstudio *.deb package from the official Rstudio websit
cd Downloads
sudo gdebi rstudio-1.2.5019-amd64.deb
Regarding your question how to subset points after exporting the csv, check this script, where roi.kml are your polygons of the locations you want to extract the points you are interested in.:
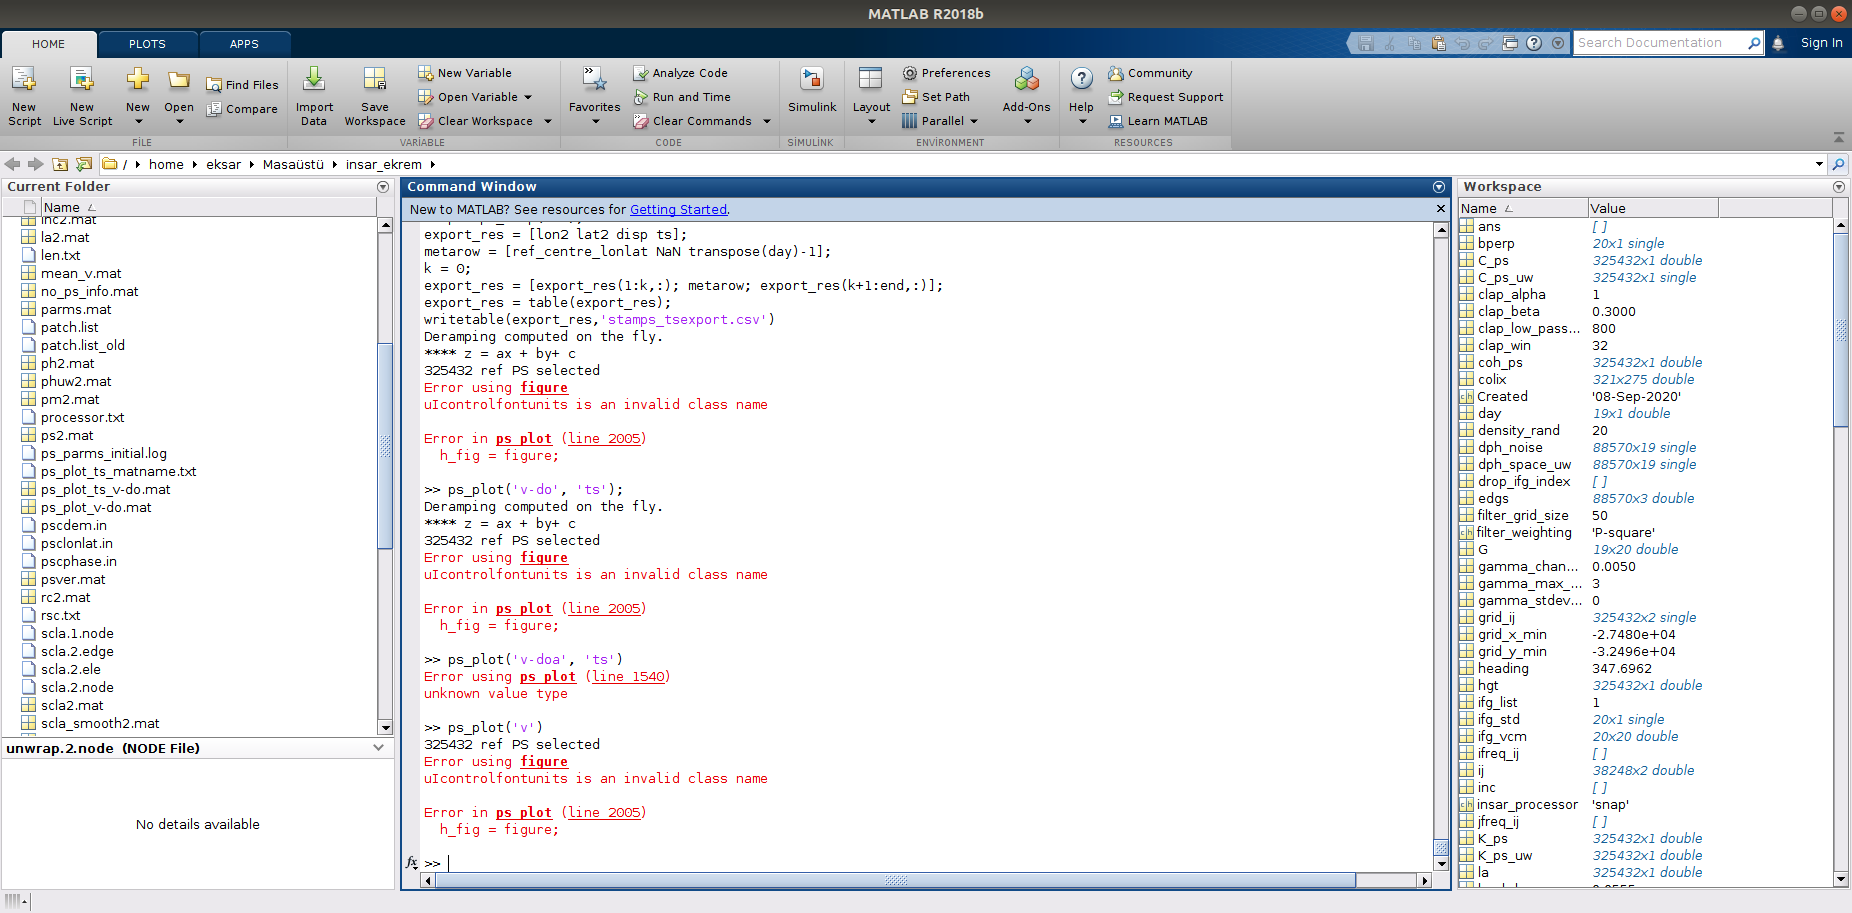
Hi, I have performed the SNAP-STAMPS steps. But in the ps_plot part, I get an error in the form of invalid clasname. Although I did research that much, I could not find my own problem anywhere.
Hello. I see that SNAP work with the default WGS 84. So, in the results after StaMPs process we can visualize the final result with RStudio program with the same WGS 84. I noticed that the world view is from ESRI. I tried to open the PSI in the QGIS program , using as world view Google Hybrid. I noticed that some structures are shifted in respect to the first map, and this way the PSI points are not on the same spot of the structure as in the Rstudio program (obviously). So on which one I have to rely do identify the precise PSI points?
@ledi_04 good question, would like to pull @ABraun into this discussion.
As I see it: StaMPS works with WGS84 even when SNAP uses the ellipsoid corrected (EGM96), the CRS of the SNAP-StaMPS Export is plain WGS84 in lon/lat, hence the exported values of StaMPS/Matlab the R Visualizer is based on is also WGS84.
Furthermore, The R visualizer uses leaflet, it states:
The Leaflet package expects all point, line, and shape data to be specified in latitude and longitude using WGS 84 (a.k.a. EPSG:4326). By default, when displaying this data it projects everything to EPSG:3857 and expects that any map tiles are also displayed in EPSG:3857.
Hence the reprojection of the PS points to match the ESRI tiles which use the EPSG:3857 is done. I am sure that it works like that, since I first tried to reproject the PS points by hand to 3857 and when you pass them to leaflet like this they are totally messed up afterwards, so reprojection is happening automatically in leaflet, which makes sence.
So, I think the visualizer workflow is fine from its reprojection behaviour. Only thing that I am not totally sure is IF StaMPS really exports plain WGS84 (can you confirm this @ABraun?)
However, that would not change the differences in R visualizer and QGIS…Still I do not know which precise CRS you use in QGIS, would be interesting to know the EPSG code. What I think is happening:
You use a slightly different CRS in QGIS as the EPSG:3857 leaflet uses. Therefore the PS point input file with a WGS84 CRS defined is on the fly reprojected to your base map. Since we know that we miss a few digits in the end of our lon/lat information, because they are somewhere lost during the StaMPS processing (this is an open question where and why) it is possible that two different reprojections of the WGS84 PS points to match the base maps in Qgis and the Visualizer end up with two slightly different results…in the end both are “correct” since mathematically there is no other chance to get a more precise result.
My explanation so far
ALSO: think about the the difference, is the difference more than ~5 m? If not it is in all cases in sub pixel range and therefore in my opinion within our range of spatial uncertainty due to the sensor resolution
I tried different EPSG:3857 and EPSG:4326. when I use the ESRI tiles, nothing seems to change between the two EPSG. There is a difference only when I change to Google Hybrid Tile. I’m sure that this difference (which is less than 5 m) is given from the tile resolution as well (Google Hybrid does have a higher resolution). I can tolerate this difference for my work, but I have to be sure, that at least the PS point on the ESRI tile shows the deformation of that exact point ( of course considering the error tollerance). Anyway, thank you for your explanation, it made the concept clearer to me
about the basemap shift: @thho which basemap is used in your script?
@ledi_04 Do you use the QuickMapServices plugin in QGIS? Depending on the location on the earth I noticed considerable differences between the Google, Bing and ESRI Satellite basemaps.It is often worth to compare which of them is most suitable at a location.
once you have done the transformation of the CSV file as explained above; I suffered the same problem but the solution is to import the CSV file to Qgis and once there you have to transform that file to shapefile; My recommendation is that once the transformation is saved, close the program and open the .shp file generated again directly from your directory with a double click
I often use the Tile+ plugin. And, yes, some places are different with respect of which tile you use. that’s why I asked, on which map does the StaMPS process rely, so this way i can choose the tiles accordingly.
Hi, I am a new entry in step forum. In these last weeks I have successfully completed the snap-StaMPS workflow for research purposes. I want to say thanks to all of you for all the advices I found here.
When I installed the “PS Time Series Viewer” QGIS plugin I had the same “no time series values found for the selected point” problem. I have solved the issue (after tryng and re-trying) in a very trivial way. I exported the data as a CSV with the tool that was provided by @thho . After that, I have made the few adjustments to the table as said @ABraun (formatting of the date and naming of the colums). Then, I have imported the .csv file with the command “add delimited text layer”. Finally, I have exported that as an ESRI shape file. At this point the shapefile is available in the layer window and the problem “no time series values found for the selected point” is arised to me. I solved this by removing the shapefile just created from the layers window and then re-add it as a new vector layer. Once do it, my problem was solved. Maybe this my experience could be useful to others.
Hello,
a question has come to my mind ( maybe very stupid). When we do write the command on matlab : ps_plot(‘v-do’, ‘ts’);
what we do have after that in the stamps_export.scv are the values of the LOS velocity in mm/ year in one column, and all the deformation in the LOS direction for every date in the rest of columns.
what if I want the vertical or horizontal displacement of these points?
They refer to traditional DInSAR approaches, so with PS you usually need results from both ascending and descending tracks and then apply some vector calculations as suggested in this paper, for example:
I see. I have to have necessarily both ascending and descending mode. So once you have finishe processing both modes, you select the same reference points. Does this mean you find if the results in ascending and descending modes have some points in common? otherwise you can’t use neither of the results if the points don’t correspond. But is this a bit unlikely to happen, meaning impossible to have the PS result with the same coordinates from ascending and descending mode?