StaMPS-Visualizer, SNAP-StaMPS Workflow

a question about it:
If I select my subset, is it affected by the selection of PS?
That is, the value of my displacements would change depending on the selected area, for example if I select an area of ​​100m2 as a subset, the displacement values ​​would be modified or remain the same as if I had not chosen any subset and will process the entire study area let’s put 500mm2

Thank you very much for all the guidance.
Regards

@nachin6789 I think you refer to the spatial subset in R right? This step is completely post processing after StaMPS in Matlab, the displacement values of the selected PS does not change.

I get it.
However, if I select a series of excel points from all those that I originally extracted from StaMPS and open them with the viewer, it gives me that error, hence my suspicions about the association with the PS set


all the points that I select have no displacement

however if I don’t edit the excel, the visualization seems to work correctly

hi @nachin6789,

it may be the way you select the points. I assume this is your workflow:

  • look for PS of interest in the complete csv with stamps visualizer, note down the PS point numbers
  • open the csv with libre calc and select all the lines with the points + the two header lines
  • save this selection as a new csv in the stusi folder of the visualizer

can you please provide a screenshot of the csv with the selected points? If you want you can blur out the alt lon information. Normally this should work.

@ABraun @thho Dears is there any method to add point data to StaMPS collected using GPS for landslide inventary mapping?

hi @endashdebru you mean within the visualizer? Not natively, it is possible by adding the layer manually in the server script but there is no option so far in the Visualizer…Since you are the third asking for it, I consider providing it in the next update

Thanks dear… i was in needs of integrating PS InSAR result with landslide inventory map…

Hi, does anyone know how is it possible to reverse the color bar? it should be done in MATLAB or R code

Hi @amirolinxa, in the server.R script, line 131 is:

colramp <- rev(matlab.like(10))

try to simply remove the rev() command like this

#colramp <- rev(matlab.like(10))
colramp <- matlab.like(10)

save and restart the app, let me know if this works or not
Cheers

2 Likes

To make it precise, how should the points look like? markers or colored points? Should they present an information when you hover over them with the mouse courser or something like that? do they have a time dimension like the PS points? please provide some more information about what you think those points should be presented :slight_smile:

1 Like

@thho the points are collected to show past landslide in the study are …they have no time dimension only shows their position

Ok, I think I will include it in a way, that markers are used which look different from the PS points, in order to make the difference obvious. Also, hence other users asked for points with a time dimension, I will make the landslide location without a time dimension (or event points) available in a dev branch of the visualizer, where you have to checkout from. But I will write a documentation about how to do this. During the next week, this will be available.

1 Like

Hi @endashdebru,

Your requested feature of adding markers with additional information to the map is ready for the Visualizer:

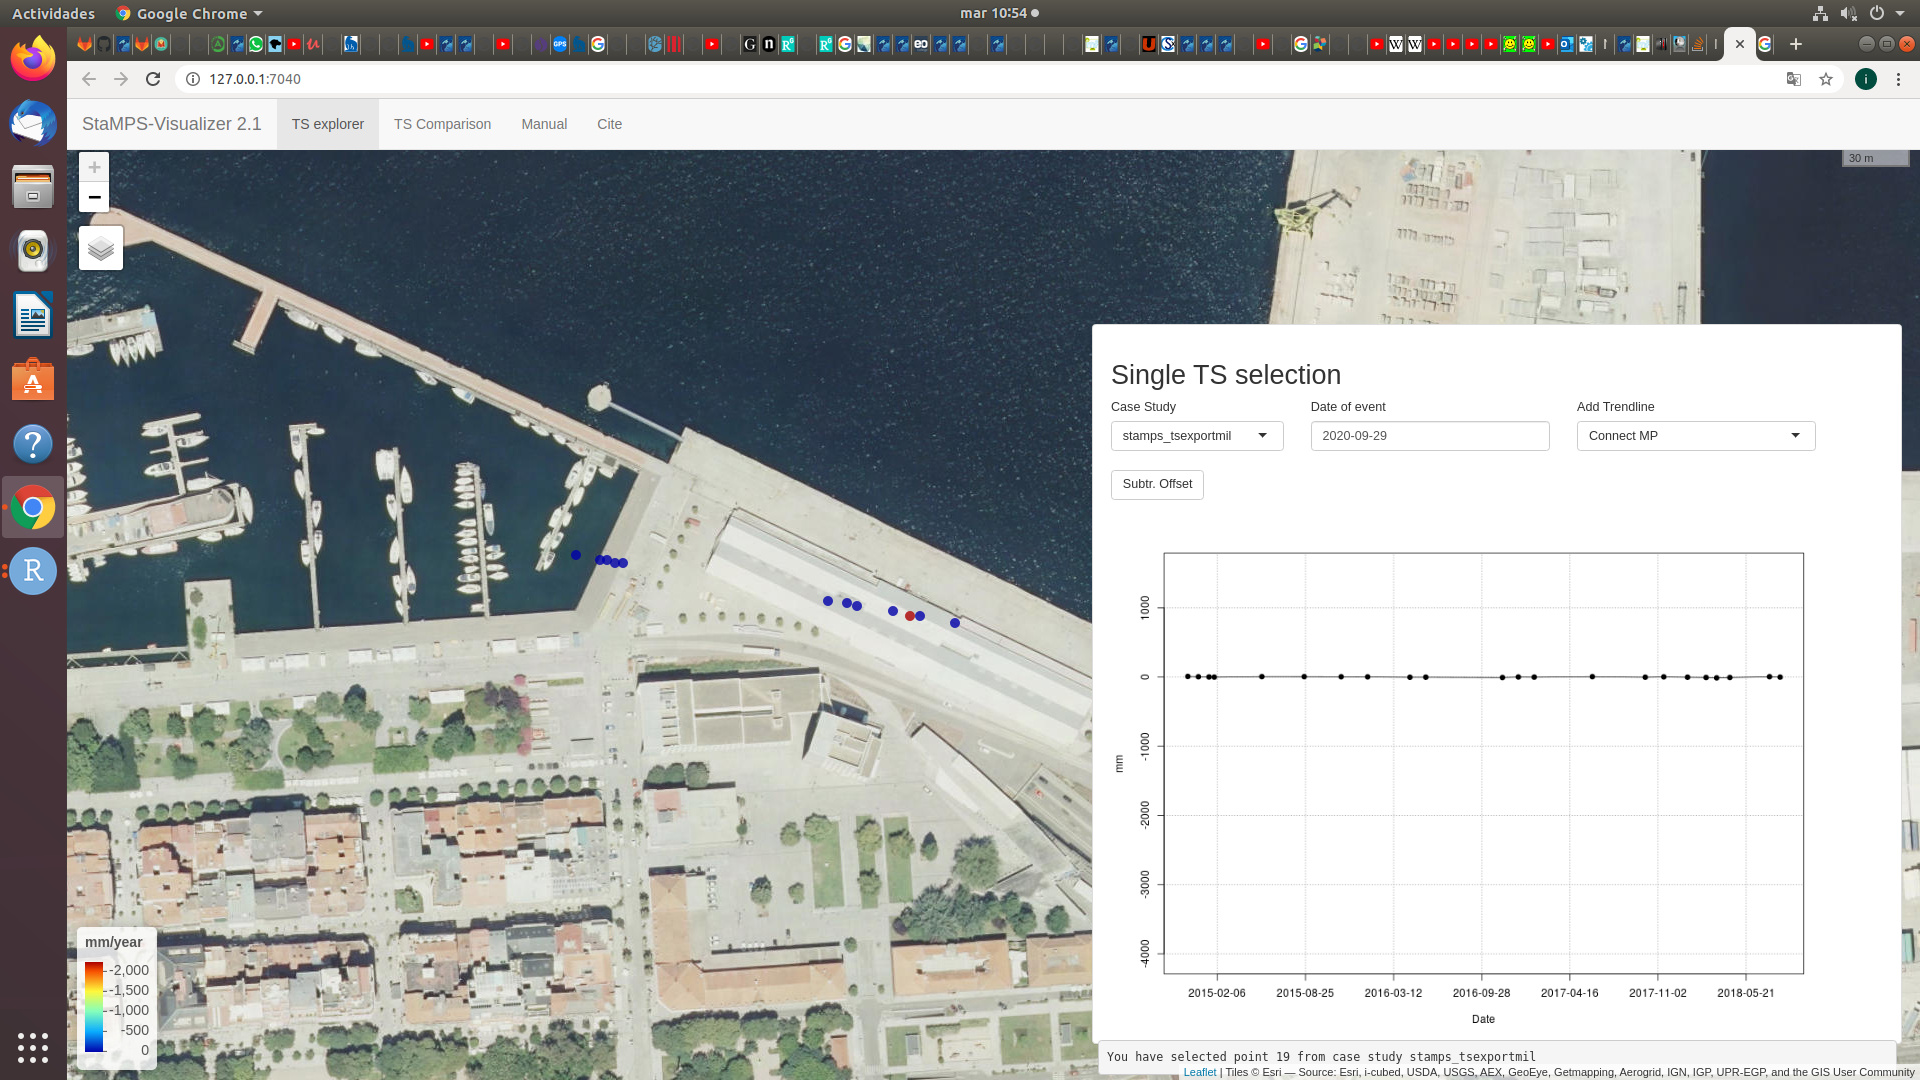
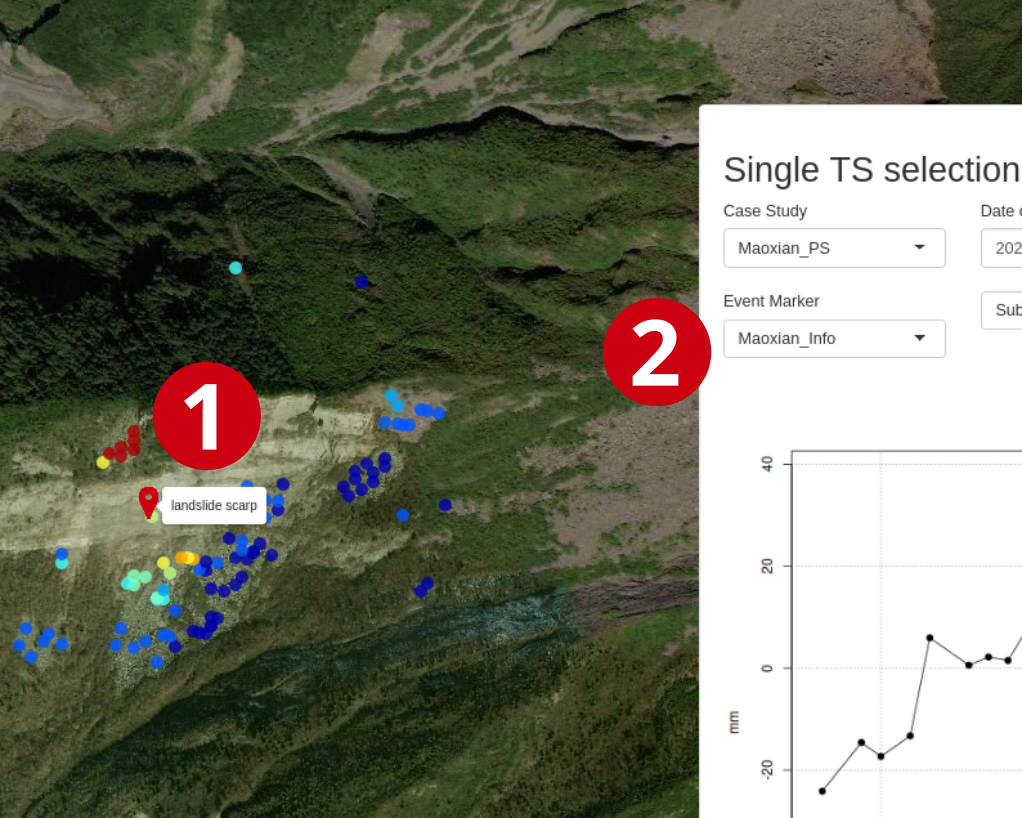
You are now able to add event marker. Such a marker is pictured at 1, it is interactive and when you hover over it with your mouse, the info text pops up.

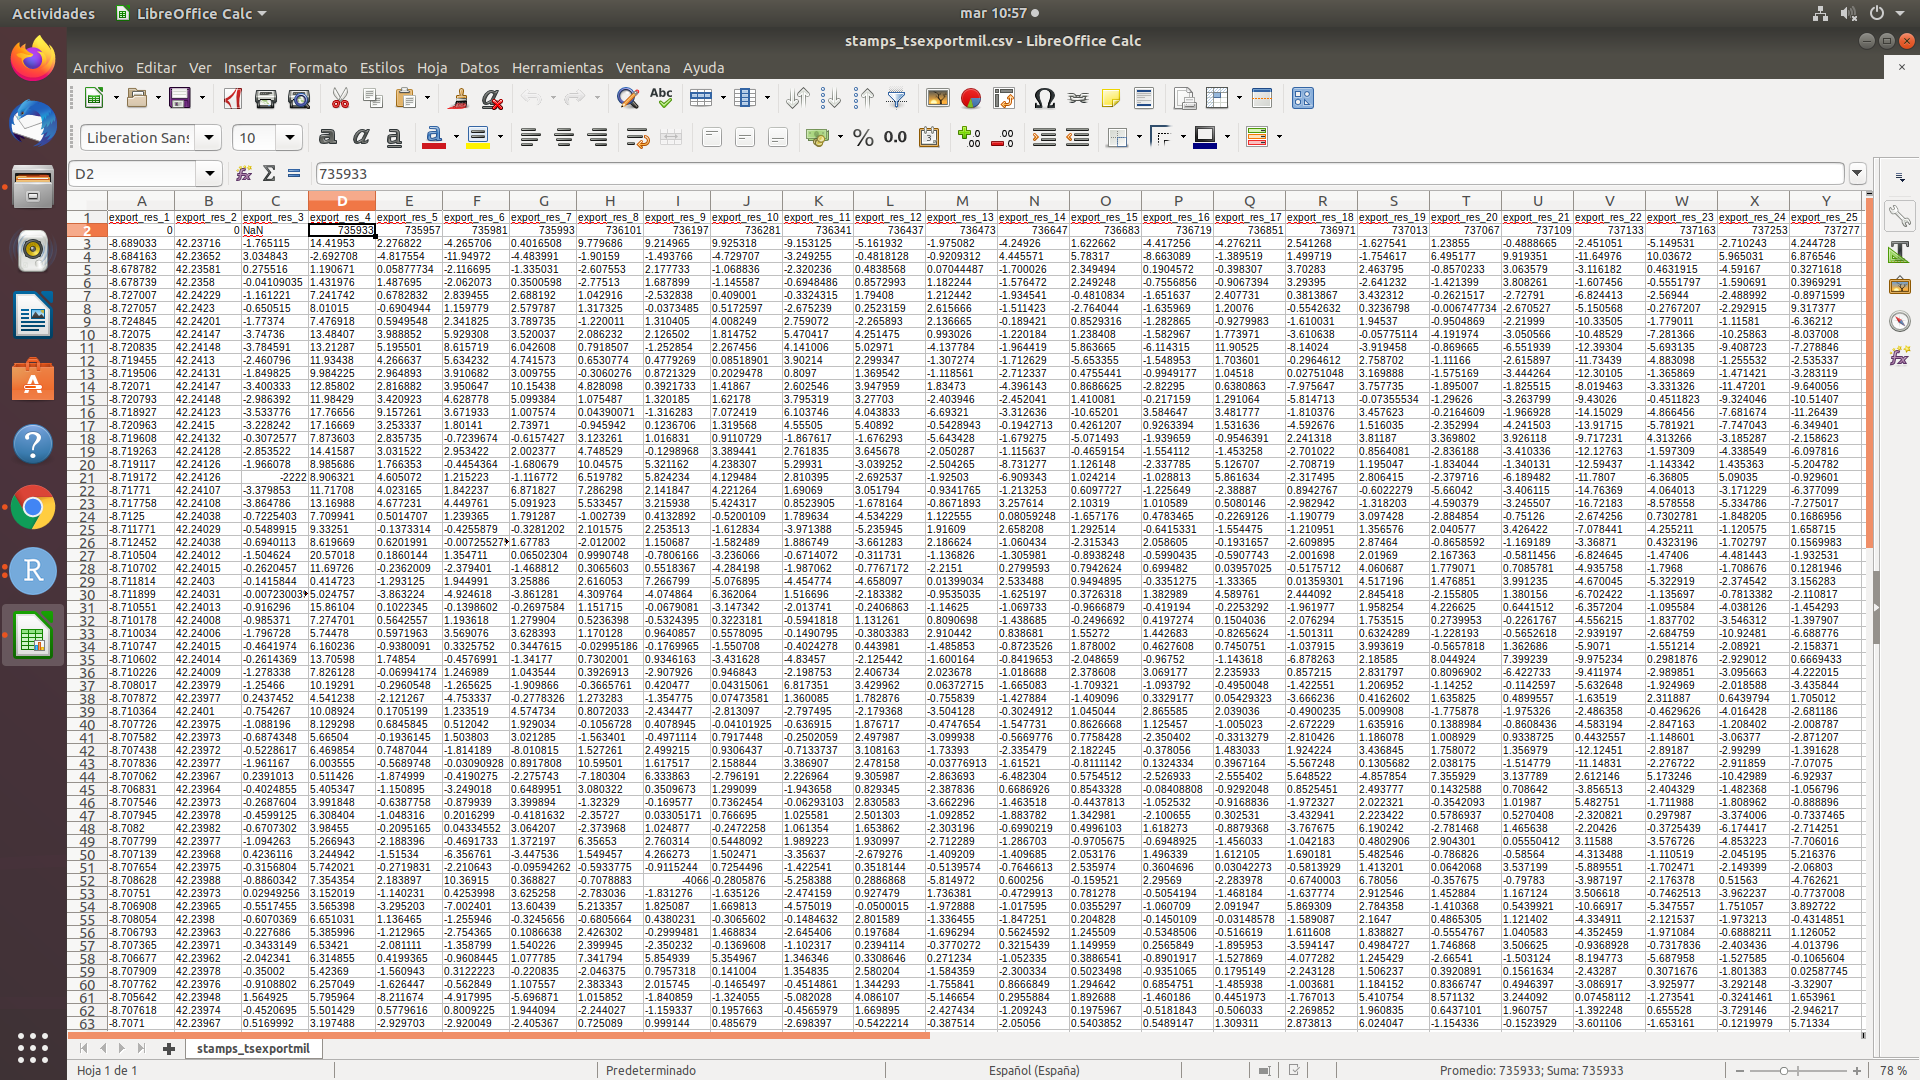
You can select your event marker in 2 the selection input. You can also define for no input (default). To ingest your own data to the app, you have to prepare a .csv file with this structure:

lon, lat, info
<WGS84_coords_in_num>,<WGS84_coords_in_num>,<info_text_as_string_or_num>

(have a look at ./event_marker/Maoxian_Info.csv in the app to see an example)

and put it in the ./envent_marker directory within the app directory (like adding a custom study site/StaMPS export)

you can add as many info points as you want in one .csv. However, keep in mind that ~500 is a limit because of rendering issues and performance of the app… so keep this number small.

caution

first this new feature is just roughly tested, hence it is not in the master branch on github, but on the 3.0-dev branch. You have two options to get the code:

git clone https://github.com/thho/StaMPS_Visualizer
cd StaMPS_Visualizer
git checkout 3.0-dev
ls
#will show you the new folders and scripts

there is no new package needed, open e.g. server.R and click “run app” in RStudio.

One thing that I recognized during first testing is, that the new event markers are clickable…but they will trigger a ps-plot of (mostly the last PS) I was not able to solve this issue quickly.

So to everybody how likes to test, give me a feedback what is good and what is bad with this new feature.

Cheers!

5 Likes

Thank you so much.

@thho, thats awesome!

@thho, thanks alot!

Dear StaMPS experts, I am using StaMPS to analyse a volcanic eruption and have a question. I have noticed PS density adjacent to the eruption site (crater floor) is greatly reduced for StaMPS processing that includes the eruption period (i.e. PS density is greater if the stack is limited to the pre-eruption period). I am wondering if the reduction in PS density likely results from temporal decorrelation due to sudden motion (eruption)? Many time series show a discontinuity close to the time of the eruption. The discontinuity commonly takes the form of a sudden drop in elevation (maximum drop of 15 mm - see below). This observed maximum value is close to the theoretical detection limit of Sentinel-1 C-band InSAR (14 mm for 12 day revisit) (Crosetto et al., 2016, Czikhardt et al., 2017), so I am wondering if many PS are lost because the sudden motion exceeded 15 mm? Is this a good explanation for the reduction in PS density? Has any other research noted this? Thanks for your input.

thanks @thho :pray:

stamps(2,2)

STAMPS: ########################################
STAMPS: ####### StaMPS/MTI Version 4.0b6 #######
STAMPS: ####### Beta version, Jun 2018 #######
STAMPS: ########################################

STAMPS: Will process current directory only
psver currently: 1
psver now set to: 1

STAMPS: ########################################
STAMPS: ################ Step 2 ################
STAMPS: ########################################
STAMPS: Directory is PATCH_1

PS_EST_GAMMA_QUICK: Starting
PS_EST_GAMMA_QUICK: Estimating gamma for candidate pixels
GETPARM: filter_grid_size=50
GETPARM: filter_weighting=‘P-square’
GETPARM: clap_win=32
GETPARM: clap_low_pass_wavelength=800
GETPARM: clap_alpha=1
GETPARM: clap_beta=0.3
GETPARM: max_topo_err=20
GETPARM: lambda=0.0554658
GETPARM: gamma_change_convergence=0.005
GETPARM: gamma_max_iterations=3
GETPARM: small_baseline_flag=‘n’
Found look angle file
PS_EST_GAMMA_QUICK: n_trial_wraps=0.243690
PS_EST_GAMMA_QUICK: Initialising random distribution…
PS_EST_GAMMA_QUICK: 1884150 PS candidates to process
PS_EST_GAMMA_QUICK: iteration #1
PS_EST_GAMMA_QUICK: Calculating patch phases…
Index in position 1 is invalid. Array indices must be positive integers or logical values.

Error in ps_est_gamma_quick (line 221)
ph_grid(grid_ij(i,1),grid_ij(i,2),:)=ph_grid(grid_ij(i,1),grid_ij(i,2),:)+shiftdim(ph_weight(i,:),-1);

Error in stamps (line 326)
ps_est_gamma_quick(est_gamma_parm);

please resolve this error.

Thank you.

Dear Thho,
First i selected 100m area then it created the .CSV file, but while selecting 1000m and 10000m area it is creating below error. Please tell me solution for this. Thank you

export_res = [lon2 lat2 disp disp_ts];
Error using horzcat
Dimensions of arrays being concatenated are not consistent.

These are the commands,
ps_plot(‘v-do’,‘ts’);
load parms.mat;
ps_plot(‘v-do’, -1);
load ps_plot_v-do.mat;
lon2_str = cellstr(num2str(lon2));
lat2_str = cellstr(num2str(lat2));
lonlat2_str = strcat(lon2_str, lat2_str);
lonlat_str = strcat(cellstr(num2str(lonlat(:,1))), cellstr(num2str(lonlat(:,2))));
ind = ismember(lonlat_str, lonlat2_str);
disp = ph_disp(ind);
disp_ts = ph_mm(ind,:);
export_res = [lon2 lat2 disp disp_ts];
metarow = [ref_centre_lonlat NaN transpose(day)-1];
k = 0;
export_res = [export_res(1:k,:); metarow; export_res(k+1:end,:)];
export_res = table(export_res);
writetable(export_res,‘stamps_tsexport1.csv’)