First guess: you do not use the up to date Visualizer version, there is a change in the matlab export procedure, you have to use the right export script depending if you work with StamPS 3.x or StaMPS 4.x see in the manual tab of the latest Visualizer version.
when I choose a larger radius (10000) this error is occured:

export_res = [lon2 lat2 disp disp_ts];
Error using horzcat
Dimensions of arrays being concatenated are not consistent.
please search for that error in the forum in this post, it was answered many times and is also documented in the manual tab of the Visualizer
Dear @thho,
I’m facing this error when I try to create a subset with the “troubleshooting script”. In particular on line 16.
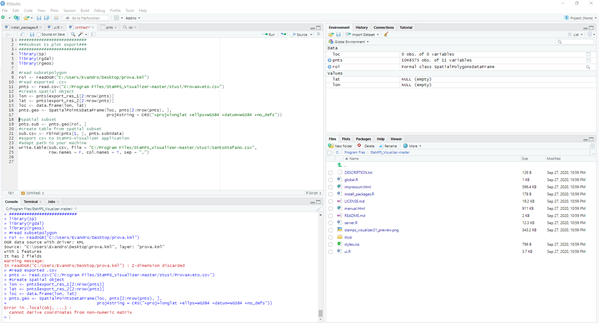
Can you help me? I’m sorry if you have already answered to this issue but i didn’t find a solution in the forum.
Thank you in advance!
hi @Evandro , can you upload the picture again? I can’t read the error, since the resolution is to coarse…when you upload an image in this forum you have to wait until it shows you 100% upload before posting the post (this is my experience)
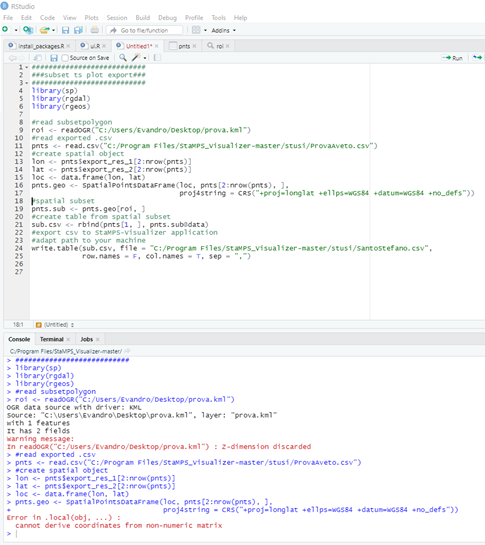
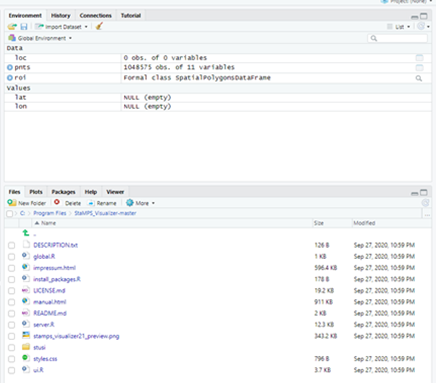
@Evandro The code looks fine to me, but in your Environment (upper right panel) you can see, that the objects lat und lon are empty. Hence, loc is empty and therefore, line 16 throws an error, which uses loc as input.
But I can not see what is wrong with you read in csv. seems fine to me on the first look,
Can you please provide the output of:
colnames(pnts)
@thho Sure, this is the outpt:
colnames(pnts)
[1] “export_res_.1” “export_res_.2” “export_res_.3” “export_res_.4” “export_res_.5” “export_res_.6” “export_res_.7”
[8] “export_res_.8” “export_res_.9” “export_res_10” “export_res_11”
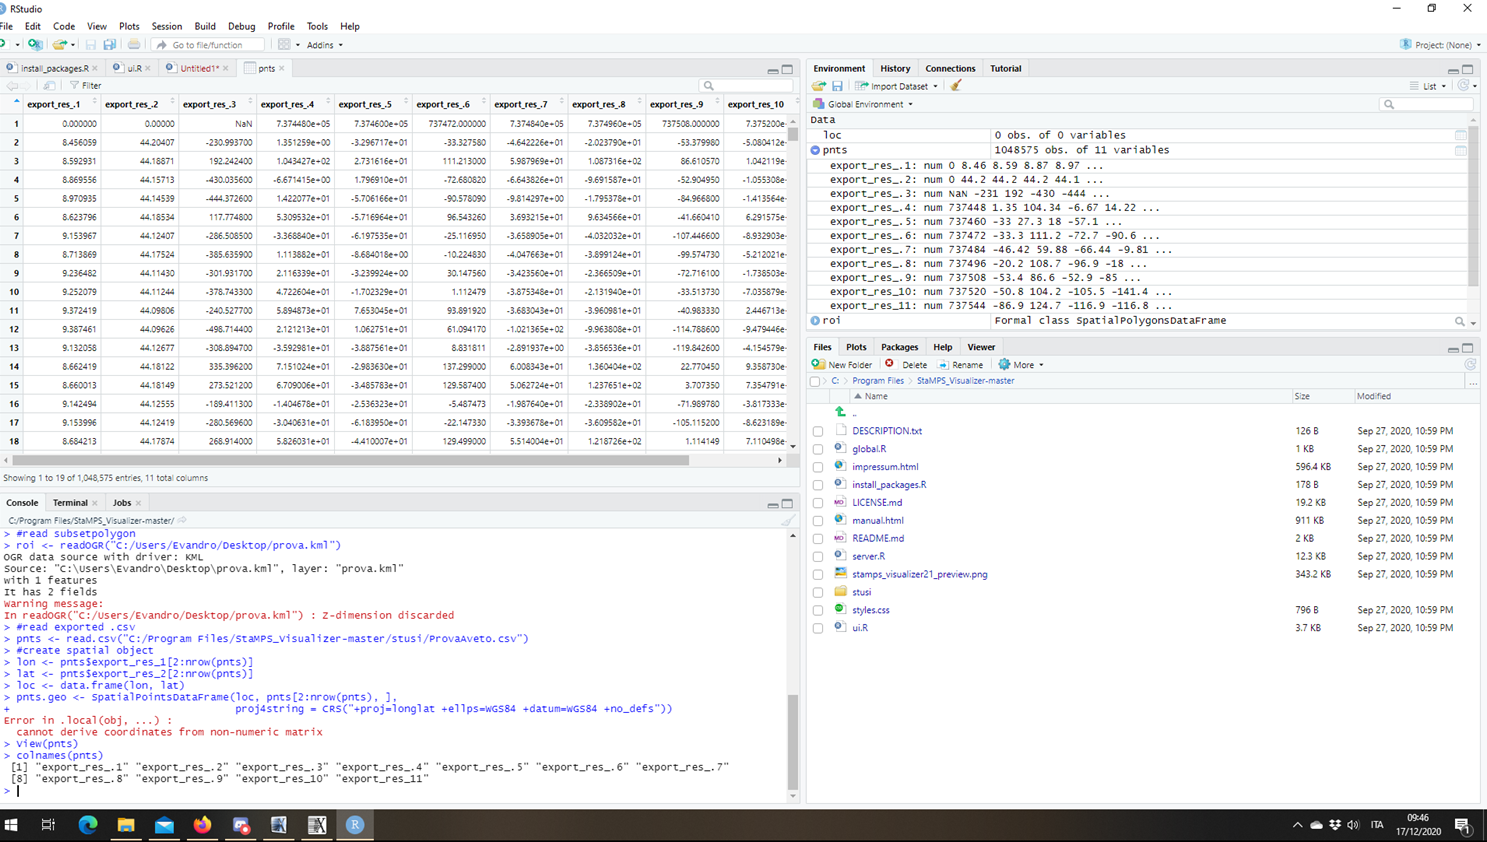
jep, ok that makes everything clear…
For some reason, your exported colnames differ from what I expected in the script:
your colnames: export_res_.1 etc.
the colnames we need in the script: export_res_1 etc.
you see the dot before the numbers, that breaks the pattern and nothing works.
I think for you it is easier to use a changed the script, use this:
###########################
###subset ts plot export###
###########################
library(sp)
library(rgdal)
library(rgeos)

#read subsetpolygon
roi <- readOGR("/home/user/studysite/roi.kml")
#read exported .csv
pnts <- read.csv("/home/user/ISNAR_master_date/stamps_tsexport.csv")
#create spatial object
lon <- pnts$export_res_.1[2:nrow(pnts)]
lat <- pnts$export_res_.2[2:nrow(pnts)]
loc <- data.frame(lon, lat)
pnts.geo <- SpatialPointsDataFrame(loc, pnts[2:nrow(pnts), ],
            proj4string = CRS("+proj=longlat +ellps=WGS84 +datum=WGS84 +no_defs"))
#spatial subset
pnts.sub <- pnts.geo[roi, ]
#create table from spatial subset
sub.csv <- rbind(pnts[1, ], pnts.sub@data)
#export csv to StaMPS-Visualizer application
#adapt path to your machine
write.table(sub.csv, file = "/home/user/stamps_visualizer/stusi/stamps_tsexport.csv",
            row.names = F, col.names = T, sep = ",")
1 Like
Done!!
Thank you very much @thho! That’s funny because a couple of months ago I had a problem in this step and I solved deleting the two dots from the script. In the meantime I have changed my pc…new pc new problems I guess!
Thanks again!
2 Likes
Dear Thho I used StaMPS 4.1b and using bunt 18.04 with Matlab 18a so what shall I so what do you recommend me in order to use visualization. Thank you in advanced stay blessed.
1 Like
Thank you Sir for your fast replay.
Ohh am still struggling by the way is that possible to send me the stamp visualization in window OS? thanks
Hi @thho,
in the manual’s troubleshooting section, there is a solution when occurs “Error using horzcat” . At this point , after I make new TS plot and select a large radius, I shall follow those steps :
load ps_plot_v-do.mat;
lon2_str = cellstr(num2str(lon2));
lat2_str = cellstr(num2str(lat2));
lonlat2_str = strcat(lon2_str, lat2_str);
lonlat_str = strcat(cellstr(num2str(lonlat(:,1))), cellstr(num2str(lonlat(:,2))));
ind = ismember(lonlat_str, lonlat2_str);
disp = ph_disp(ind);
disp_ts = ph_mm(ind,:);
and then How can I export the csv table for the use of R script
Thanks a lot.
- Be sure that you use StaMPS version 4.x and the Visualizer version 2.1
- Create a ps_plot() and select a large radius like 100000 that includes all your processed PS
- Now do this:
load parms.mat;
ps_plot(<your same own specification as before>);
load ps_plot_v-doa.mat;
lon2_str = cellstr(num2str(lon2));
lat2_str = cellstr(num2str(lat2));
lonlat2_str = strcat(lon2_str, lat2_str);

lonlat_str = strcat(cellstr(num2str(lonlat(:,1))), cellstr(num2str(lonlat(:,2))));
ind = ismember(lonlat_str, lonlat2_str);

disp = ph_disp(ind);
disp_ts = ph_mm(ind,:);
export_res = [lon2 lat2 disp disp_ts];

metarow = [ref_centre_lonlat NaN transpose(day)-1];
k = 0;
export_res = [export_res(1:k,:); metarow; export_res(k+1:end,:)];
export_res = table(export_res);
writetable(export_res,'stamps_tsexport.csv')
The last line will output a csv table from which you can continue
2 Likes
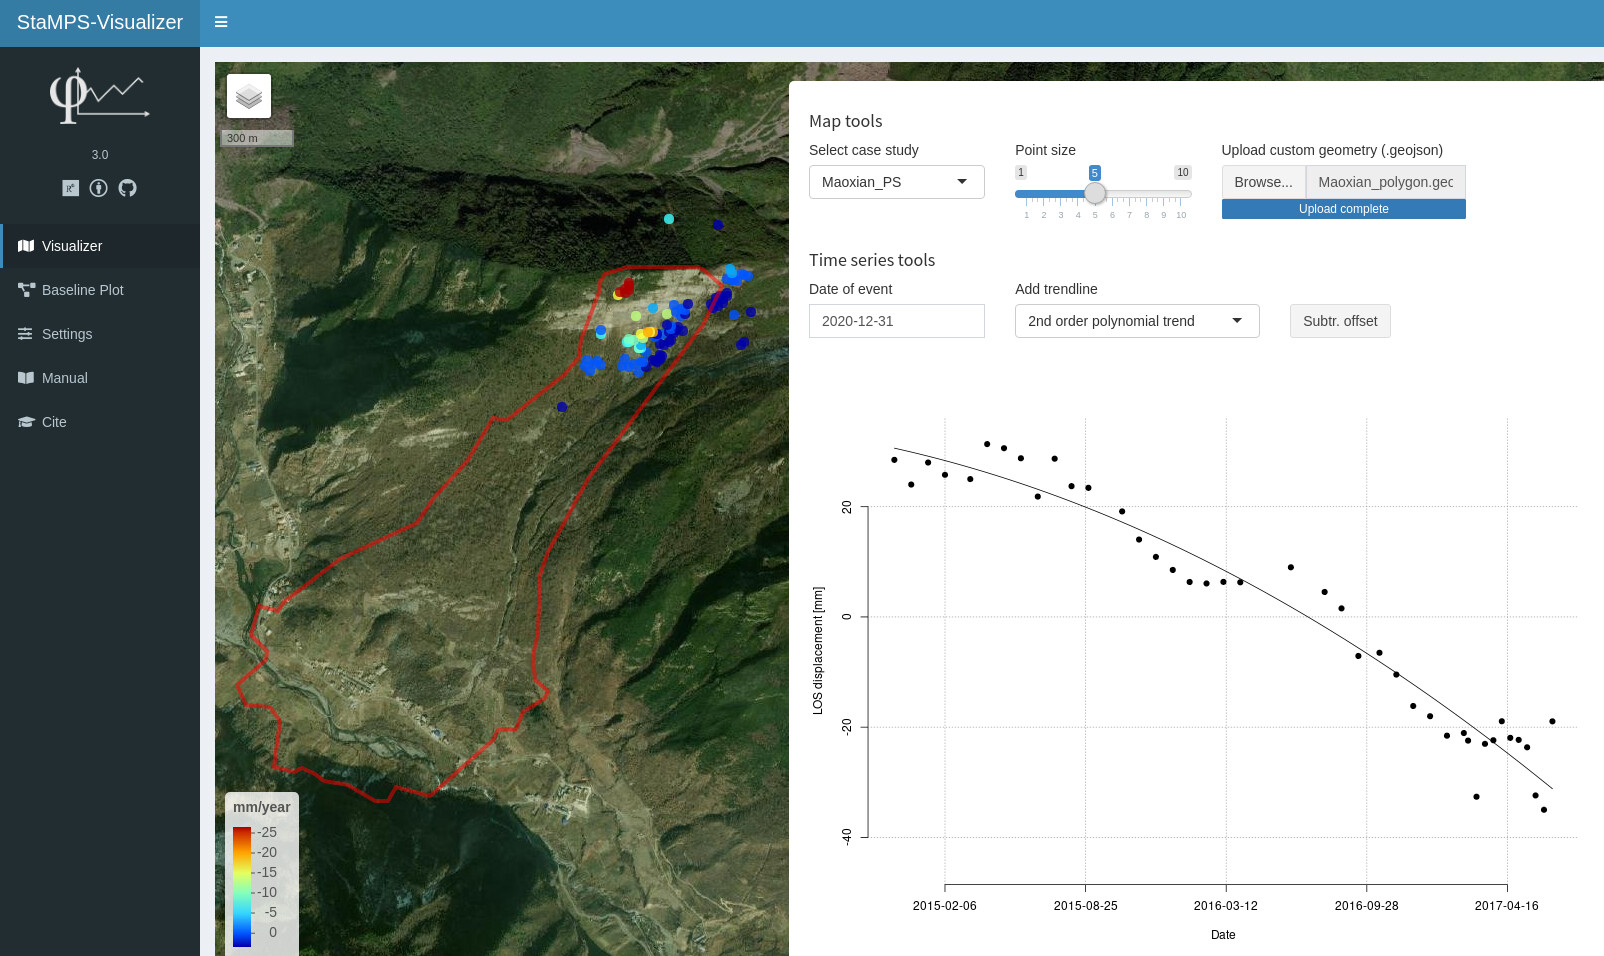
New version is released StaMPS-Visualizer 3.0
Summary what is new:
- Better installation with renv
- you can add geometreis from .geojson files
- you can change the point size (requested feature since long)
- dashboard UI looks way better

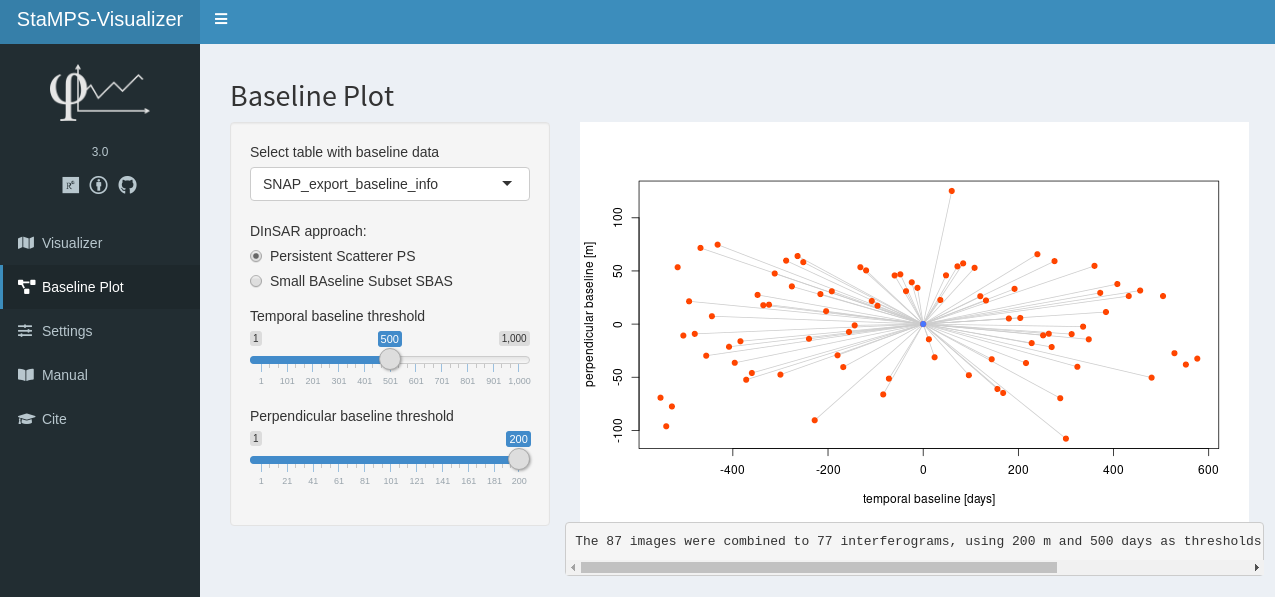
- you can create Baseline plots from SNAP coregistered stack information
- the annoying horzcat error in Matlab is solved by changing the export from StaMPS (thx to @SteffanDavies)
3 Likes