looks fantastic, congratulations!
1 Like
Thx @ABraun and thank you a lot for providing the test data I needed for devlopping this version, that helped me a lot especially to handle input study site data with lots of points:
When you put in a file with more than 50,000 points, the Visualizer will now fall back to none import and a pop up message shows up, that will tell you how you can raise the limit of 50,000 points but will also warn you of negative side effects like slower reaction of the visualizer.
Superb Sir, Thank you so much.
Dear sir,
While exporting the MATLAB figures (After completion of STAMPS (1,8)) to uncompressed TIFF format. The resolution of the TIFF image was not good. Please tell me how can I increase the image quality?
Dear thho and ABraun:
while running the StaMPS_Visulizer 3.0 in R-Studio (ubuntu 20.04) faced below error. I’m presenting the solution also.
While running the rgdal command in Rstudio below error is coming:
configure: error: gdal-config not found or not executable.
ERROR: configuration failed for package ‘rgdal’ * removing ‘/home/rakesh/R/x86_64-pc-linux-gnu-library/3.6/rgdal’
To eliminate the error please follow these below steps:
To install the latest stable version of R on Ubuntu 18.04 or above version, follow these steps:
$ sudo apt install apt-transport-https software-properties-common
$ sudo apt-key adv --keyserver keyserver.ubuntu.com --recv-keys E298A3A825C0D65DFD57CBB651716619E084DAB9
$ sudo add-apt-repository 'deb https://cloud.r-project.org/bin/linux/ubuntu bionic-cran35/'
$ sudo apt update
$ sudo apt install r-base
Then finally check the version of your R using below command.
$ R --version
It will defiantly shift to higher version.
``
Source: https://linuxize.com/post/how-to-install-r-on-ubuntu-18-04/
After upgraded the R version, run below steps.
$ gdal-config --version
If gdal is installed in your PC then, it will show the version. or else run this below command in terminal.
$ sudo apt install libgdal-dev
Once gdal installed using above command and type above command once again, then check the version details like below.
$ gdal-config --version2.2.3
Once Installation of gdal is over. Then open the R-Studio and type this command, to install the rgdal.
install.packages("rgdal")
Thank you once again thho and ABraun for your continuous support.
2 Likes
Thank you for sharing the solution
1 Like
rgdal is often a bit hard to get running propperly, good upgrading solution instead of new install.
You can also considre using the new version 3.0 from github and install with renv (see the README file in the repo)…sure it will not solve the Ubuntu apt side issues, but a apt install libgdal-dev before the package installation in R always does the trick 
1 Like
do you speak about interferograms? The Visualizer in its current version is not meant for handling TIFF.
1 Like
No sir. I’m asking about Matlab generated figures using ps_plot. How can i improve the resolution of these ps_plot(‘u-dmo’) and ps_plot(‘v’) generated figures?
Thank you.
I see, that I do not know, and since I do not have access to Matlab I can’t test, maybe someone else can help.
But some figures generated with StaMPS are by default not that fine grained. Imo, StaMPS is for signal processing and the generated figures help you to get an overview of the process and to change parameters of StaMPS in order to improve the signal processing. For high resolution result presentation or to have a deep look at very fine details, StaMPS in Matlab is not optimal, what made me to build the Visualizer in the first place, since I was interested in detailed information of single PS…
Thank you Thho,
How can i save the PS image generated by StaMPS-Visualizer in Rstudio?
Because it just showing publish option.
Sry what do you mean? Can you provide a screenshot and describe what you want to save?
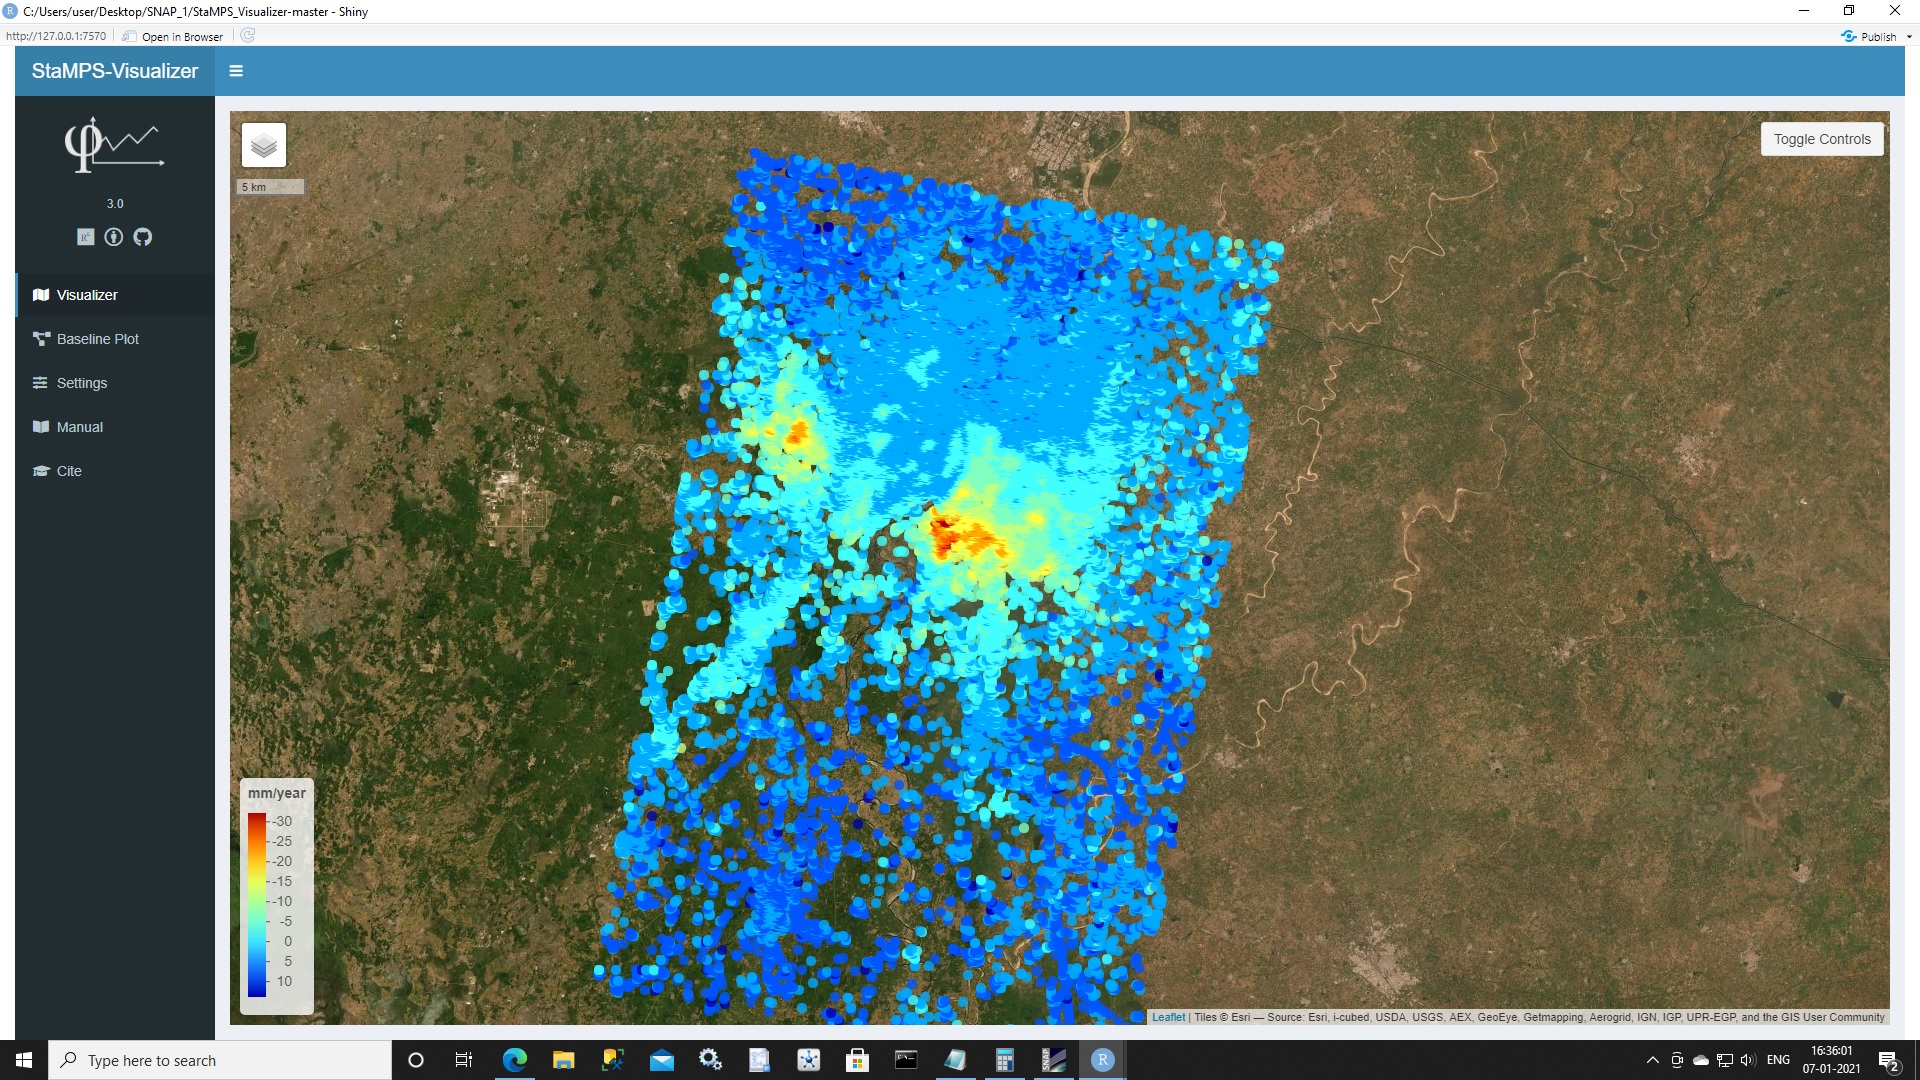
Ok, as far as I understand you want to save the map canvas with the satellite tiles and the PS point overlay, right?
Atm, I have not implemented a tool to capture this combination as an image to export, it is on the TODO list, but with a rather low priority. If you need to export it, I would do it like I did in my thesis, pages 46,47,56 and 57
- in the control panel, select the point size that fits the zoom level and density of points. In your image above, in my opinion the points a slightly to large since they overlapp
- zoom to your desired level
- take a screenshot (on ubuntu install e.g. shutter) of the visualizer window
- open an image tool like inkscape (
sudo apt install inkscapeand it is also available for Windows) and crop and clip your image until it has the layout you want to.
It is a workaround, but for me it was a good way to get nice looking figures out of the visualizer.
1 Like
Thank you Thho.
Sir, When will SBAS processing will come for SNAP2StaMPS?
Nevertheless, a major drawback of StaMPS/MTI is that no officially supported preprocessing of S-1 data with SNAP for the SBAS workflow is as yet provided.
At the moment the most officially accessible workflow to my knowledge for SBAS with S1, SNAP and StaMPS is
It is not part of the official SNAP release. So if you want to use it, I recommend to read this thread above to be aware of potential issues.
1 Like
Thank you thho.
Very nice thesis (Analysing the Capabilities and Limitations of InSAR using Sentinel-1 data for Landslide Detection and Monitoring ).
1 Like
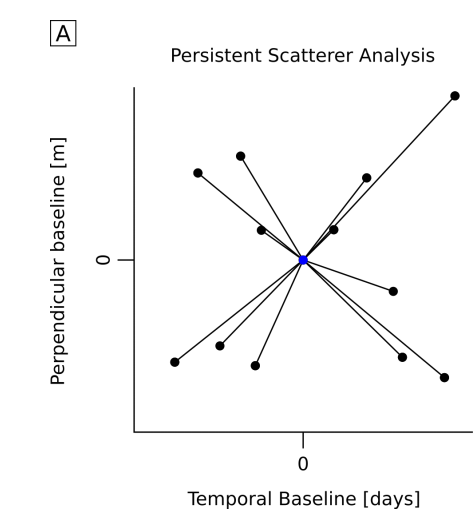
the visualizer has the tab Baseline Plot where you can creat exactly those plots, see the manual for detailed step by step walk through how to get the data out of SNAP and into the Visualizer.
1 Like