This may be a small question but I couldn’t find anything re;avent in the STAMPS manual, what does SM and SB stand for, in terms of LOS mean velocity estimation?
Best post by Thho,
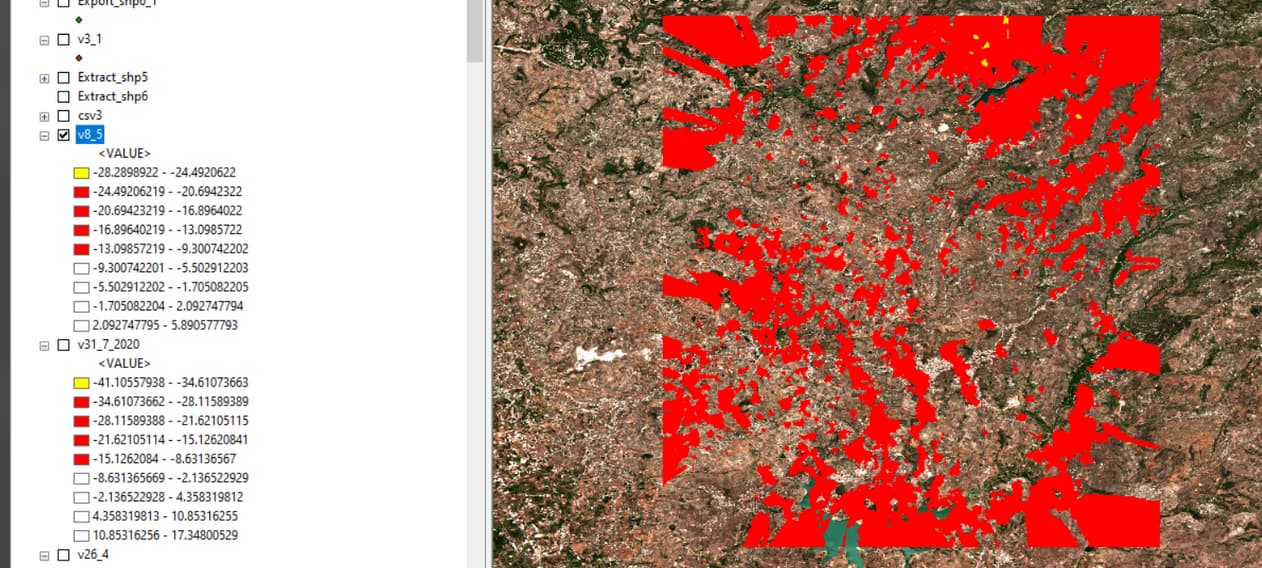
Does the sign of the estimated mean LOS velocity from a time series depend on the master image? or does this question only matter when discussing the sign of values for unwrapped interferogram between two acquisitions ? Sorry this may have been a repeated question but I find different opinions and i wanted to be sure because in my case, the removal of atmospheric contribution has reversed the sign of the estimated velocity completely in some areas, either before or after setting a reference centre
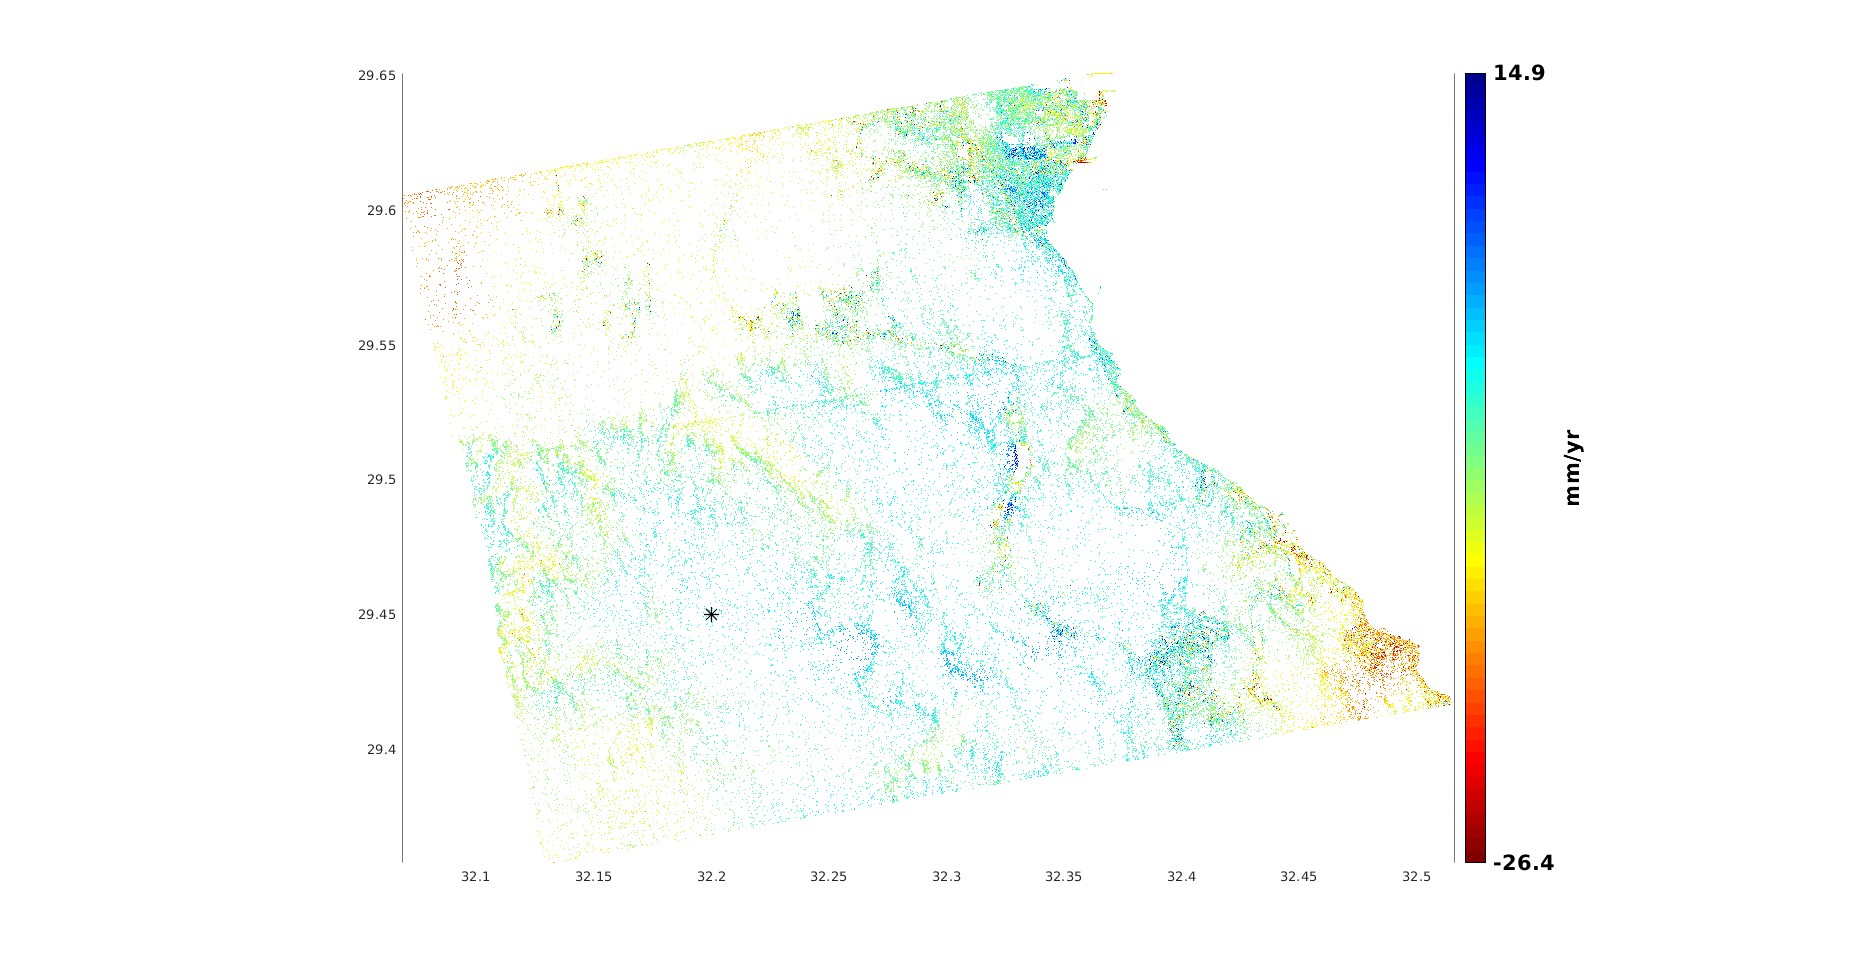
v-do (atmospheric contribution not removed)
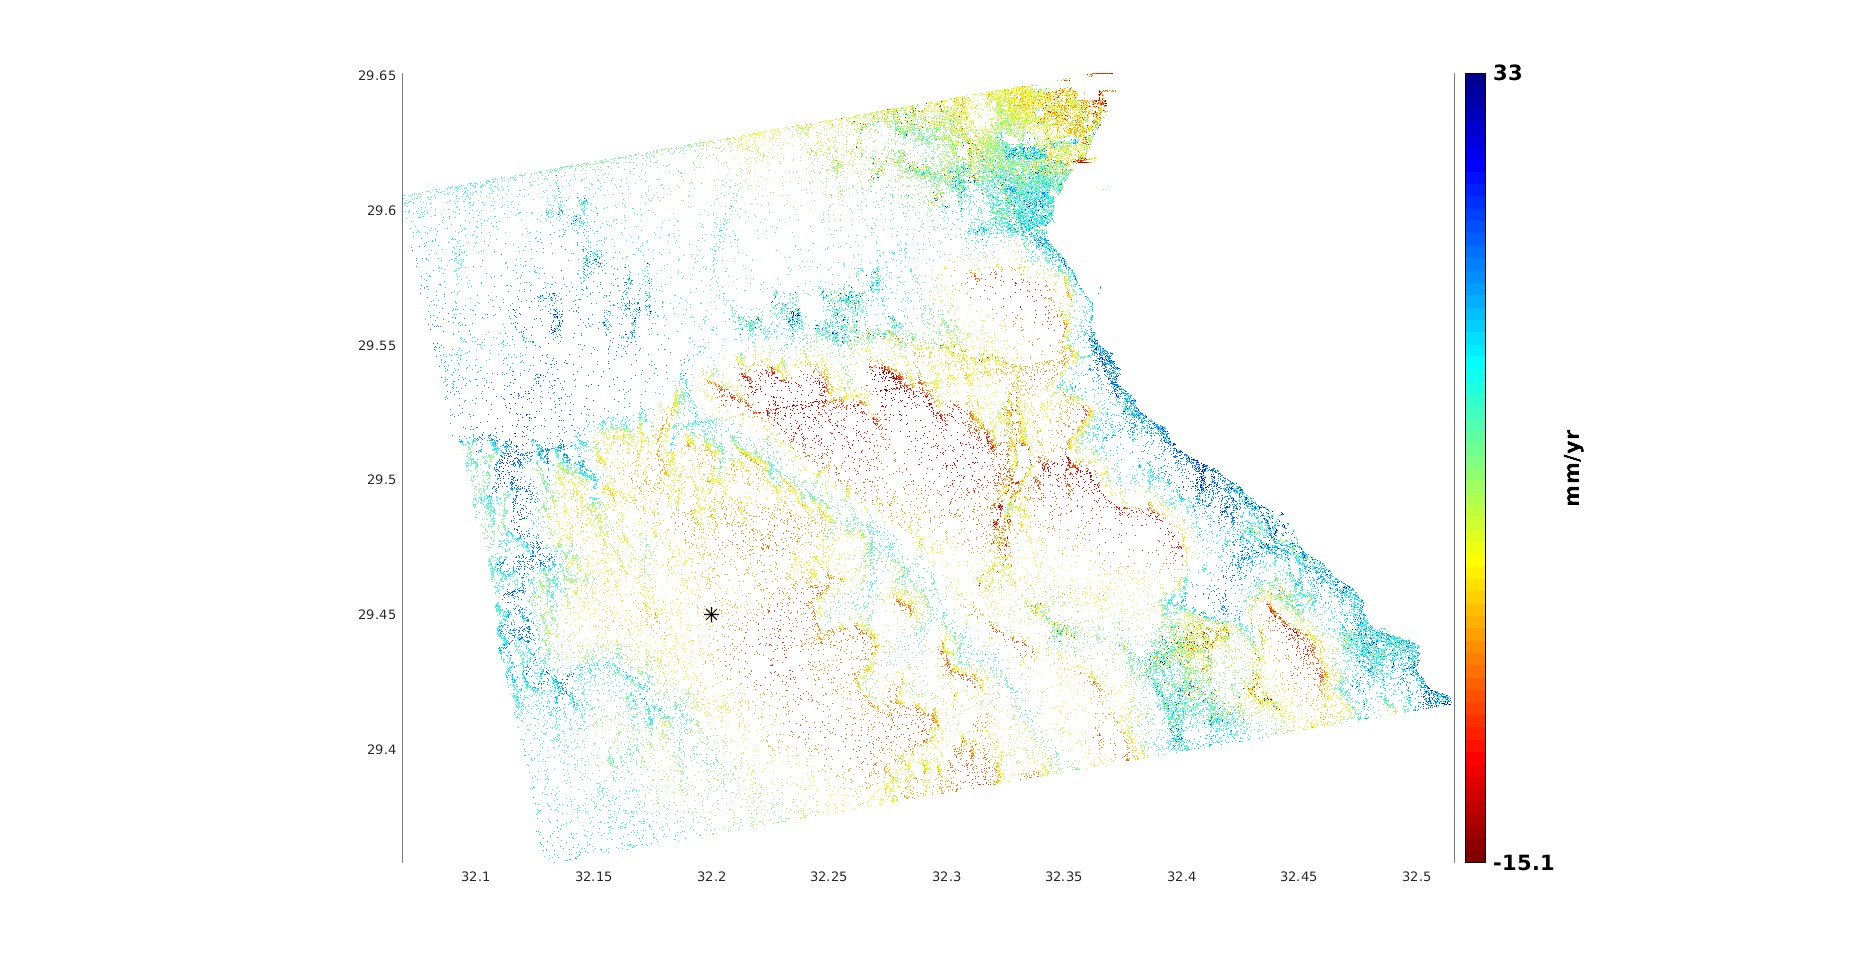
v-dao atmospheric contribution removed
Please excuse my ignorance, do you mean that([2:nrow, 4:ncol] cumulative displacement values) it is during the temporal baseline between the master image and the slave image.
another quistion please negative sign of the mean velocity refer to that displacement is away from sensor And if that is the case, why does it sometimes produce a positive cumulative displacement values Do I sum all cumulative displacement values in my case(12 cumulative displacement values) to get the total displacement to each PS point
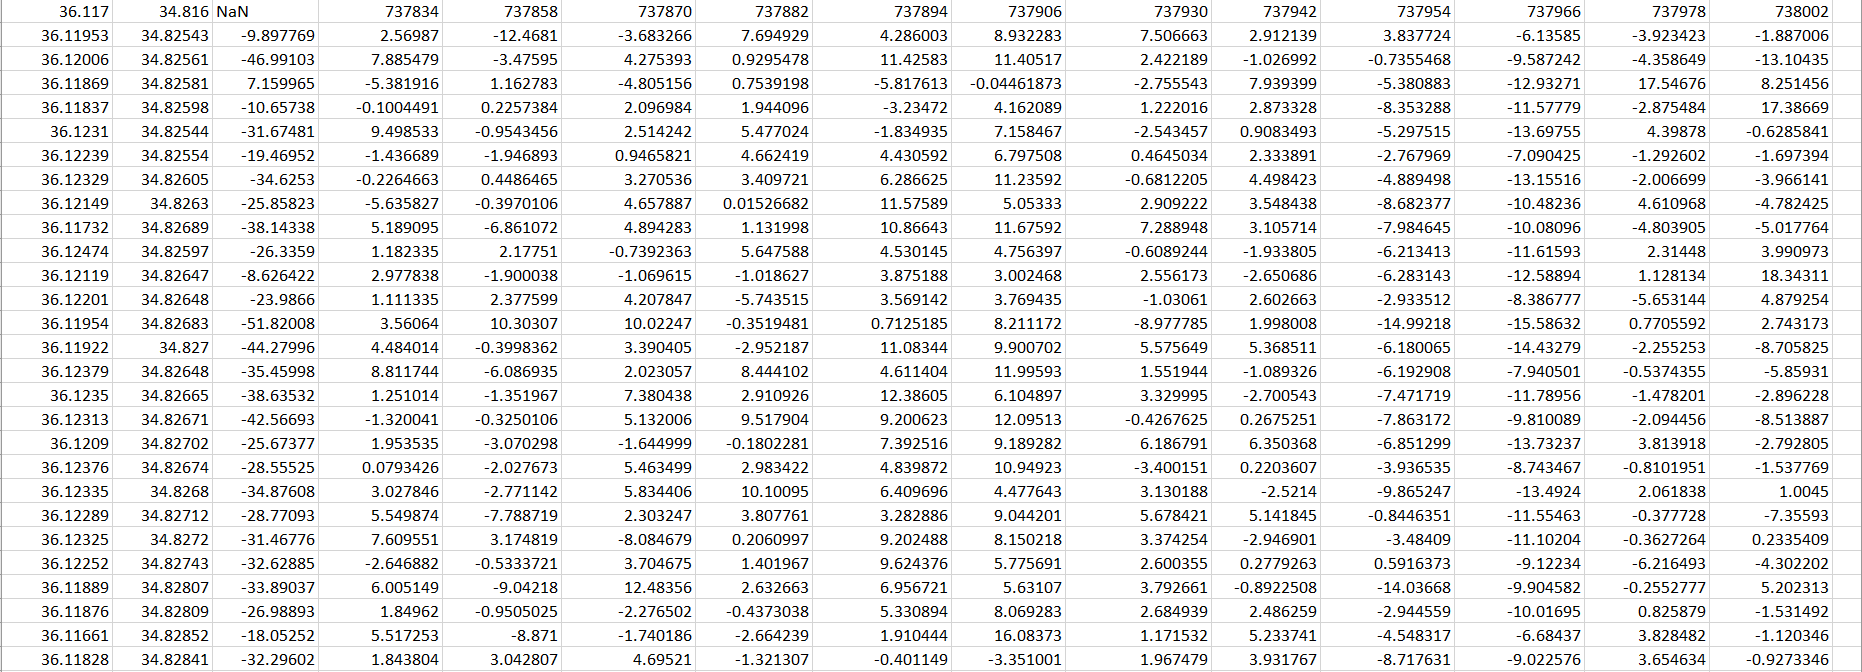
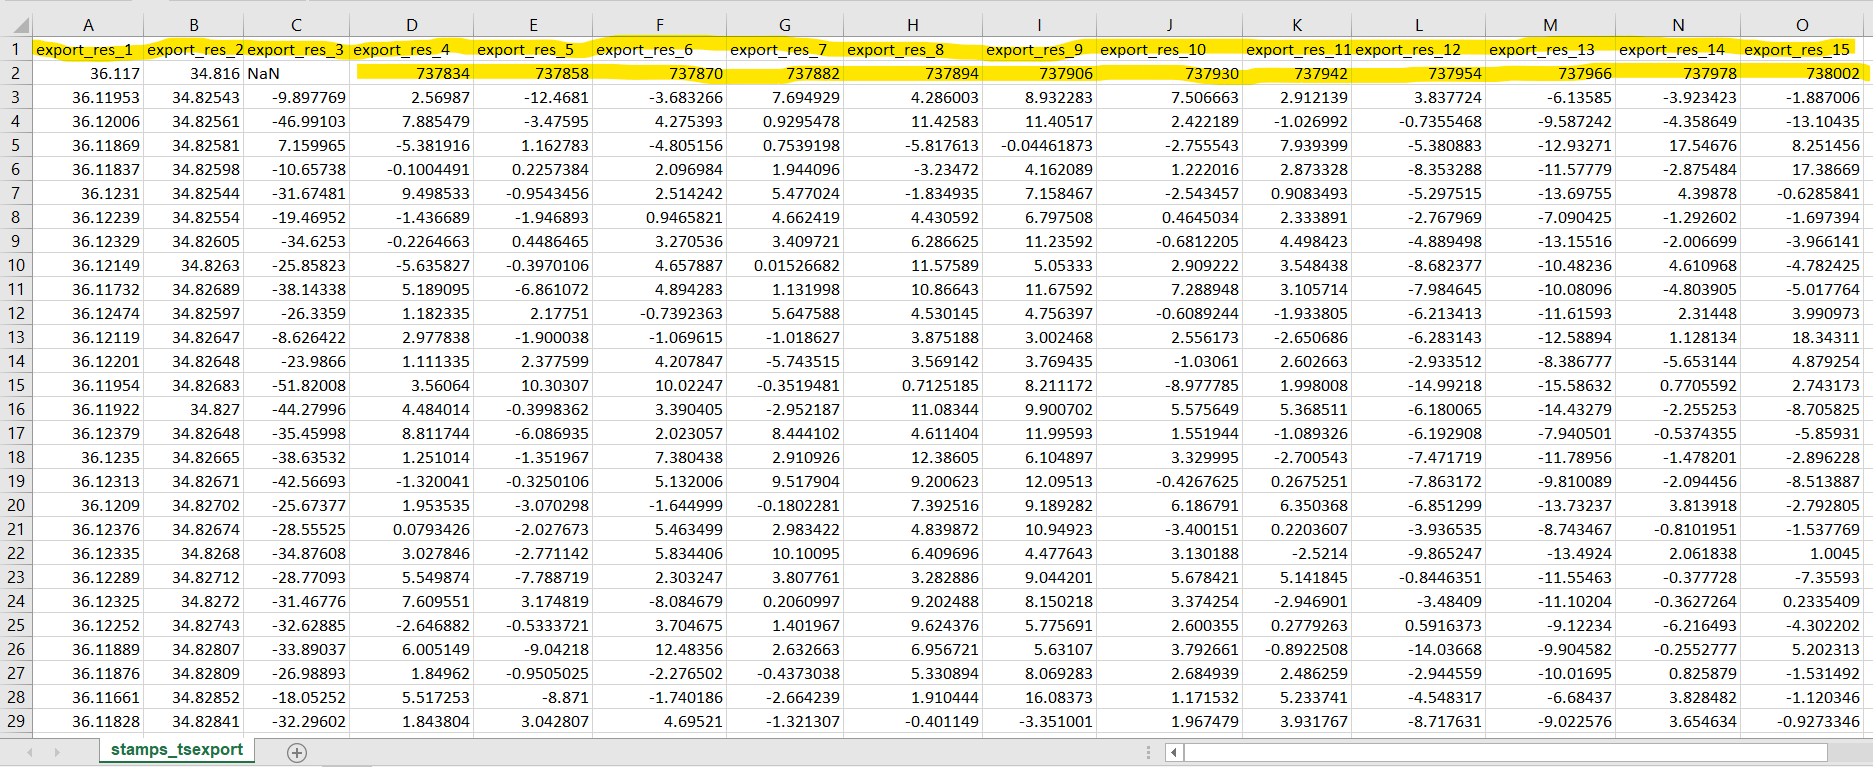
I tried Visualizer for my study area but I can not Succeed Could you examine .csv file below to help me to find the problem? Thank you.
stamps_tsexport.xlsx (31.4 KB)
Hello everyone,
I can correctly visualise the PSs in R studio, also with the right dates.
Now in excel I opened the .csv export files to do some post-processing and different plots; however, I don’t understand which date format is used. For example, 738091 it means 28/10/2020. How can I convert this format?
My best,
Othmane.
the server.R script in the repository gives some hints about it, its days since day 0 aka 01.01.0000
Very thanks @thho. Now I can convert this format ![]()
My best,
Othmane.
Dear @thho thanks for this useful explanation.
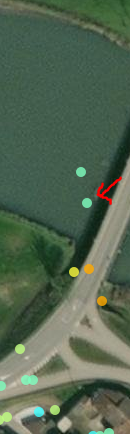
In this attempt, I processed 18 images (ascending). I had 17 interferogram. The master date is 13/06/2022. I’m trying to interpret the displacements of PSs but I have some doubts about my conventions.
Does Positive displacement imply movement away from satellite?
For instance, the second point of the timesheet is at 4 mm upper the master. However, from the master, this point move away or toward the satellite? what is the sign convention respect the satellite
In stamps manual there is only something about the phase convention:

My best,
Othmane.
Best explanation from thho, check it.
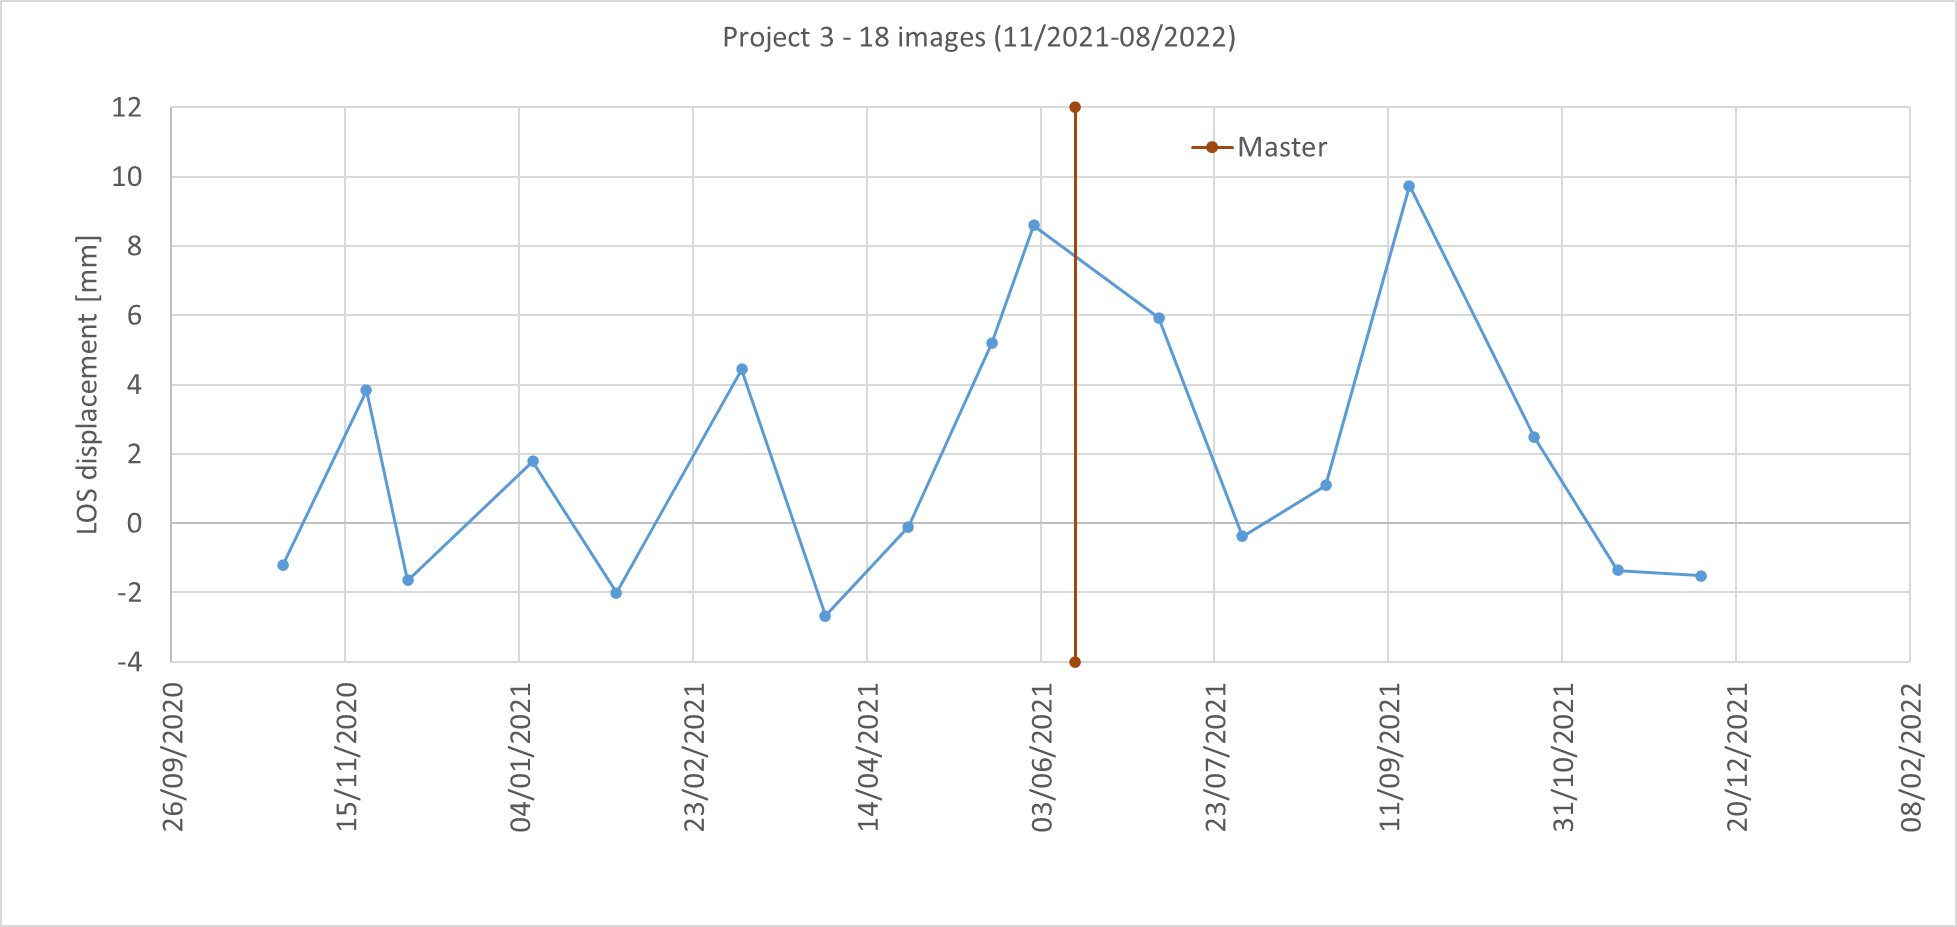
I had (vs-do)

does this mean that there is wrongs in my results… because when I calculate vertical displacements I have errors in the edges
please help
if possible, could you elaborate what spatially or temporally correlated/uncorrelated signal means?
I understand that spatial correlation means that phase of the signal is dependent on the satellite’s look angle and target in slant range, but correct me if I am wrong, the variation of atmospheric phase delay is spatially correlated, meaning that each target on the ground has a different slant range location and height with respect to the satellite’s LOS and therefore even if the atmospheric conditions in space are the same over the study area, the delay would still differ from target to target. Am I correct ?
While temporal correlation of the signal simply means the variation of phase delay with time from signals backscattered from the same target either because of the changes of targets roughness/geometry and/or because of the changes of atmospheric conditions between each acquisition even if the target’s physical properties and location with respect to the satellite’s LOS remains constant
I appreciate your time

Hi,
How can I print standard deviation results (vs-do) to csv file ?
I have successfully installed StaMPS-Visualizer and completed the whole StaMPS processing for the first time. However, I can not use StaMPS-Visulizer now as I can not pass exporting my StaMPS results.
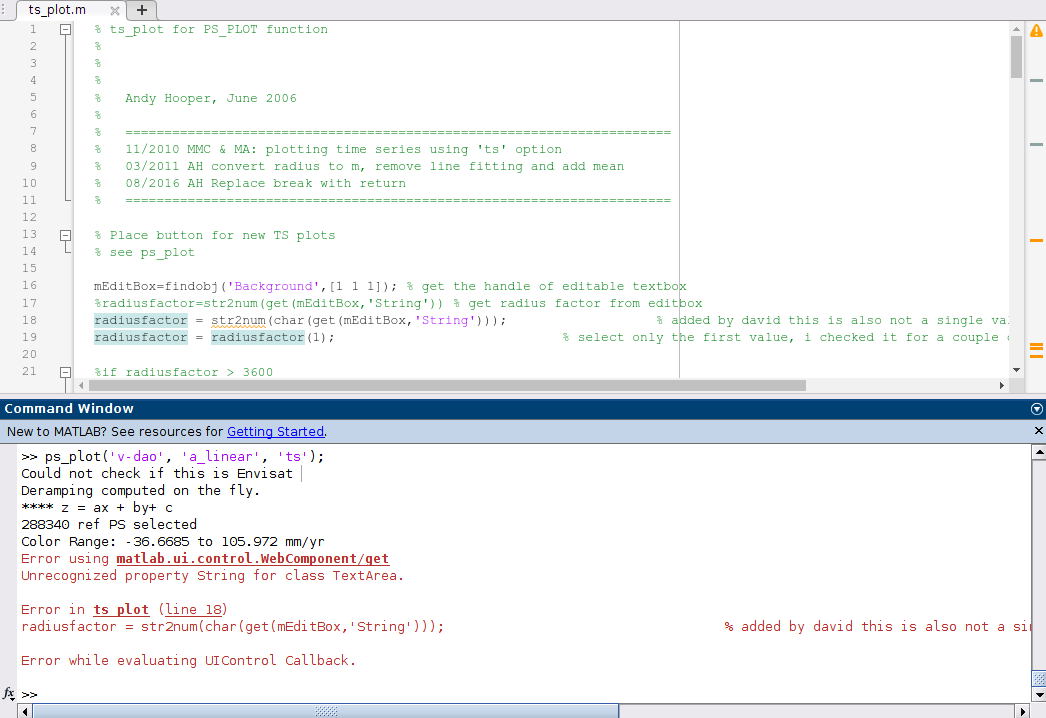
I get a persistent error after Matlab’s ps_plot(); command.
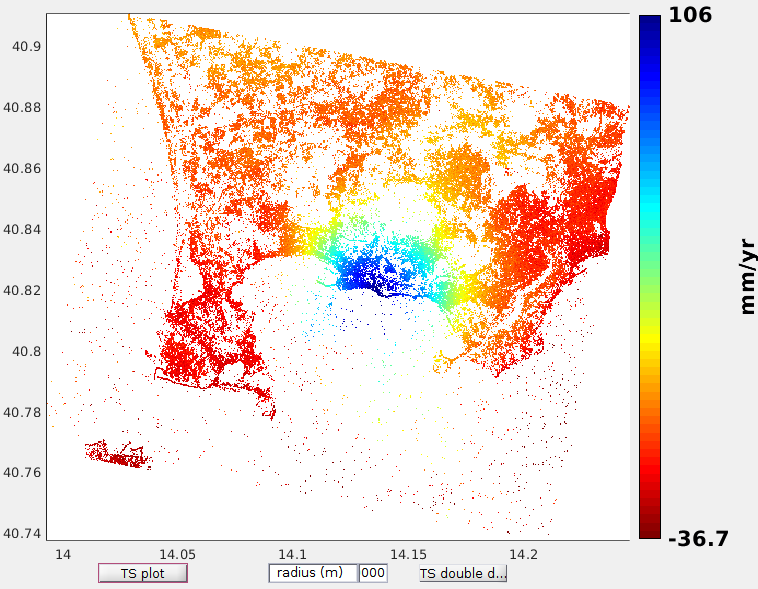
Specifically, the error happens after clicking the ‘TS plot’ button after the velocity map appears and defining a search radius of 100000 or 1000000. Please see the screenshots below.
Velocity map after running ‘ps_plot();’ command:
Error 1:
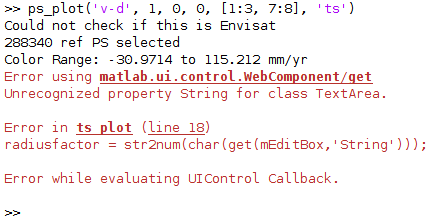
Error 2:
Plotting time series following the StaMPS manual (p.33)
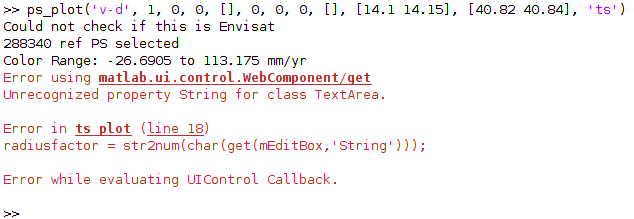
Error 3:
Plotting time series following the StaMPS manual (p.33)
I have checked this thread, and a few people, like @abity, encountered the same error. However, it seems that the error has not been resolved.
I hope the people here can assist me in resolving the error.
I am using Matlab R2022b installed in Ubuntu 20.04.5 LTS, by the way.
Thank you.
These errors may be due to Matlab changing their definition of uicontrol. I don’t have Matlab siince I retired, but Matlab documentation for uicontrol should tell you how it works in current Matlab. There are several examples you can try with your version of Matlab.
How did you know the dates?
Just check it,
1 Like
Thank you @suribabu
1 Like