@Tome: Try to install Rgal using
install.packages(“rgdal”,repos=“http://R-Forge.R-project.org”)
Thank you @erkdiwakar. It works.
Unable to run the code currently in R as it doesnt support the package rgdal.

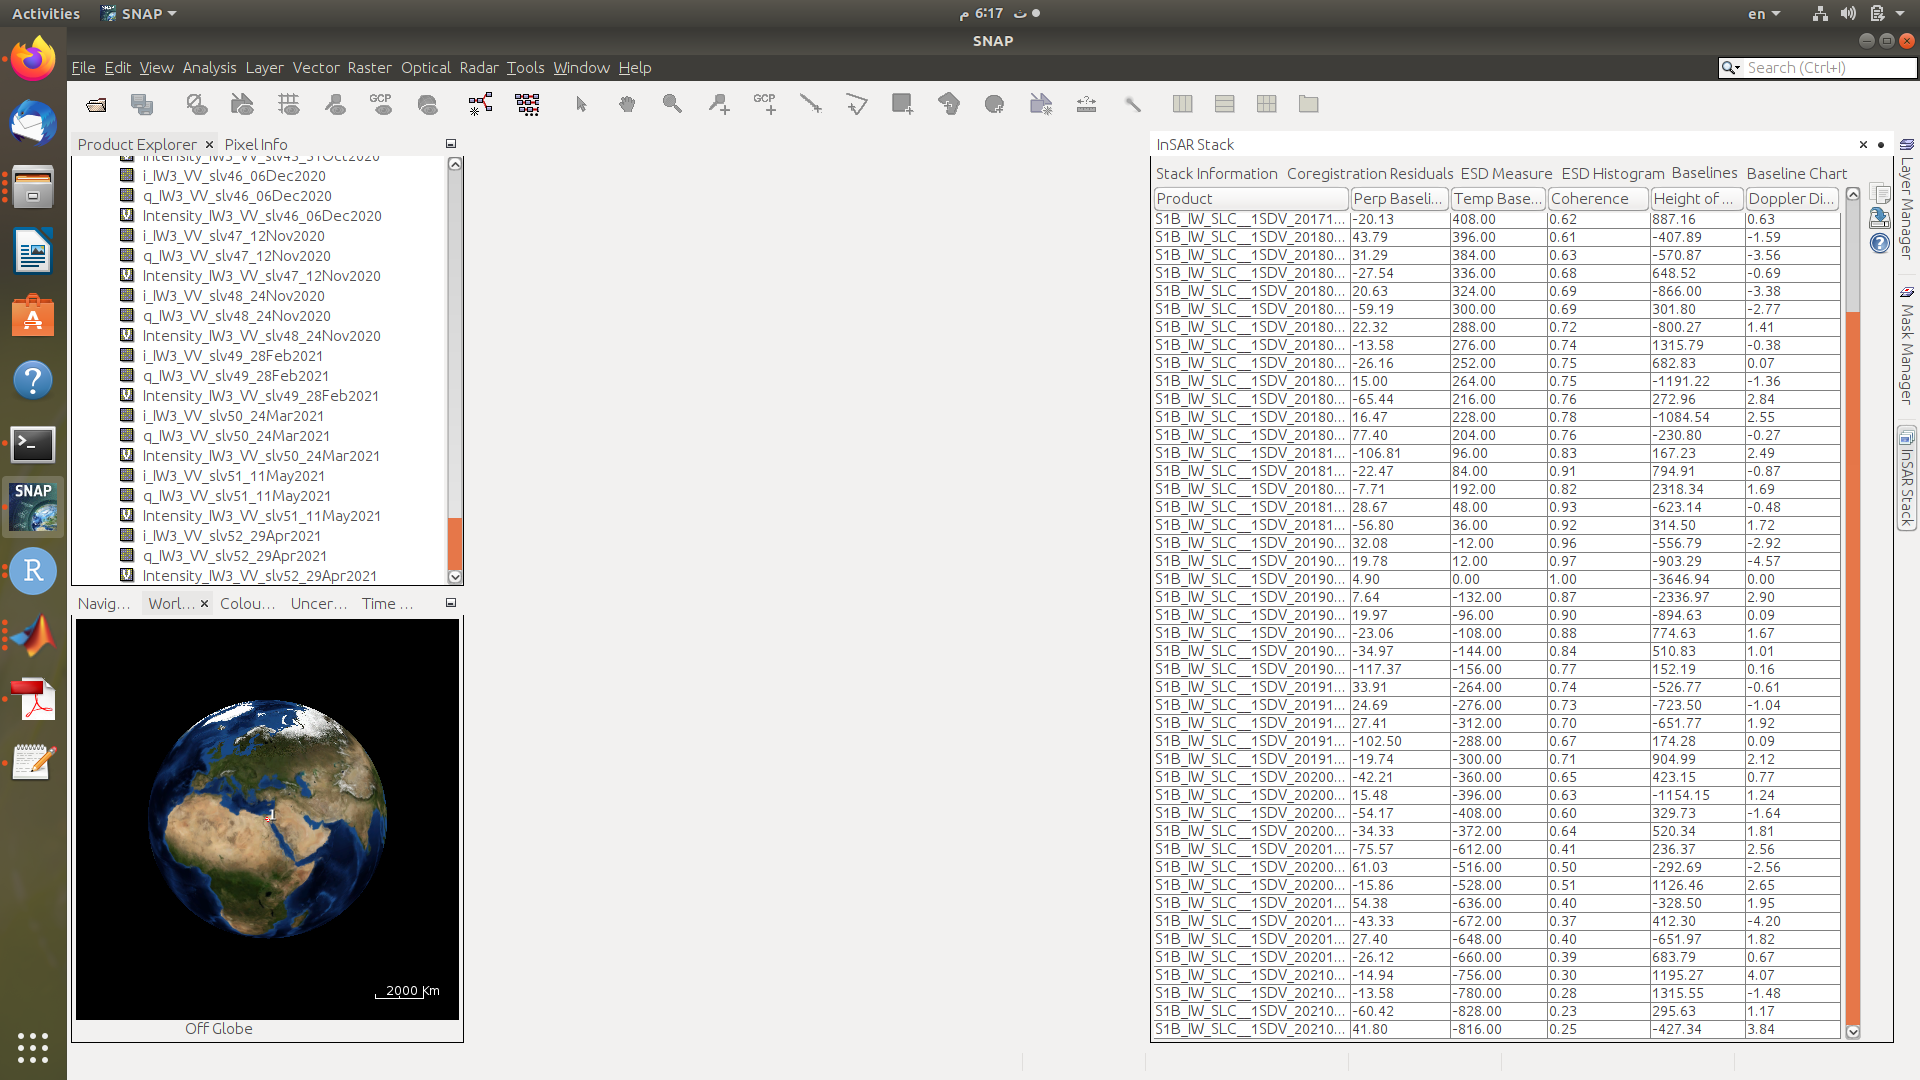
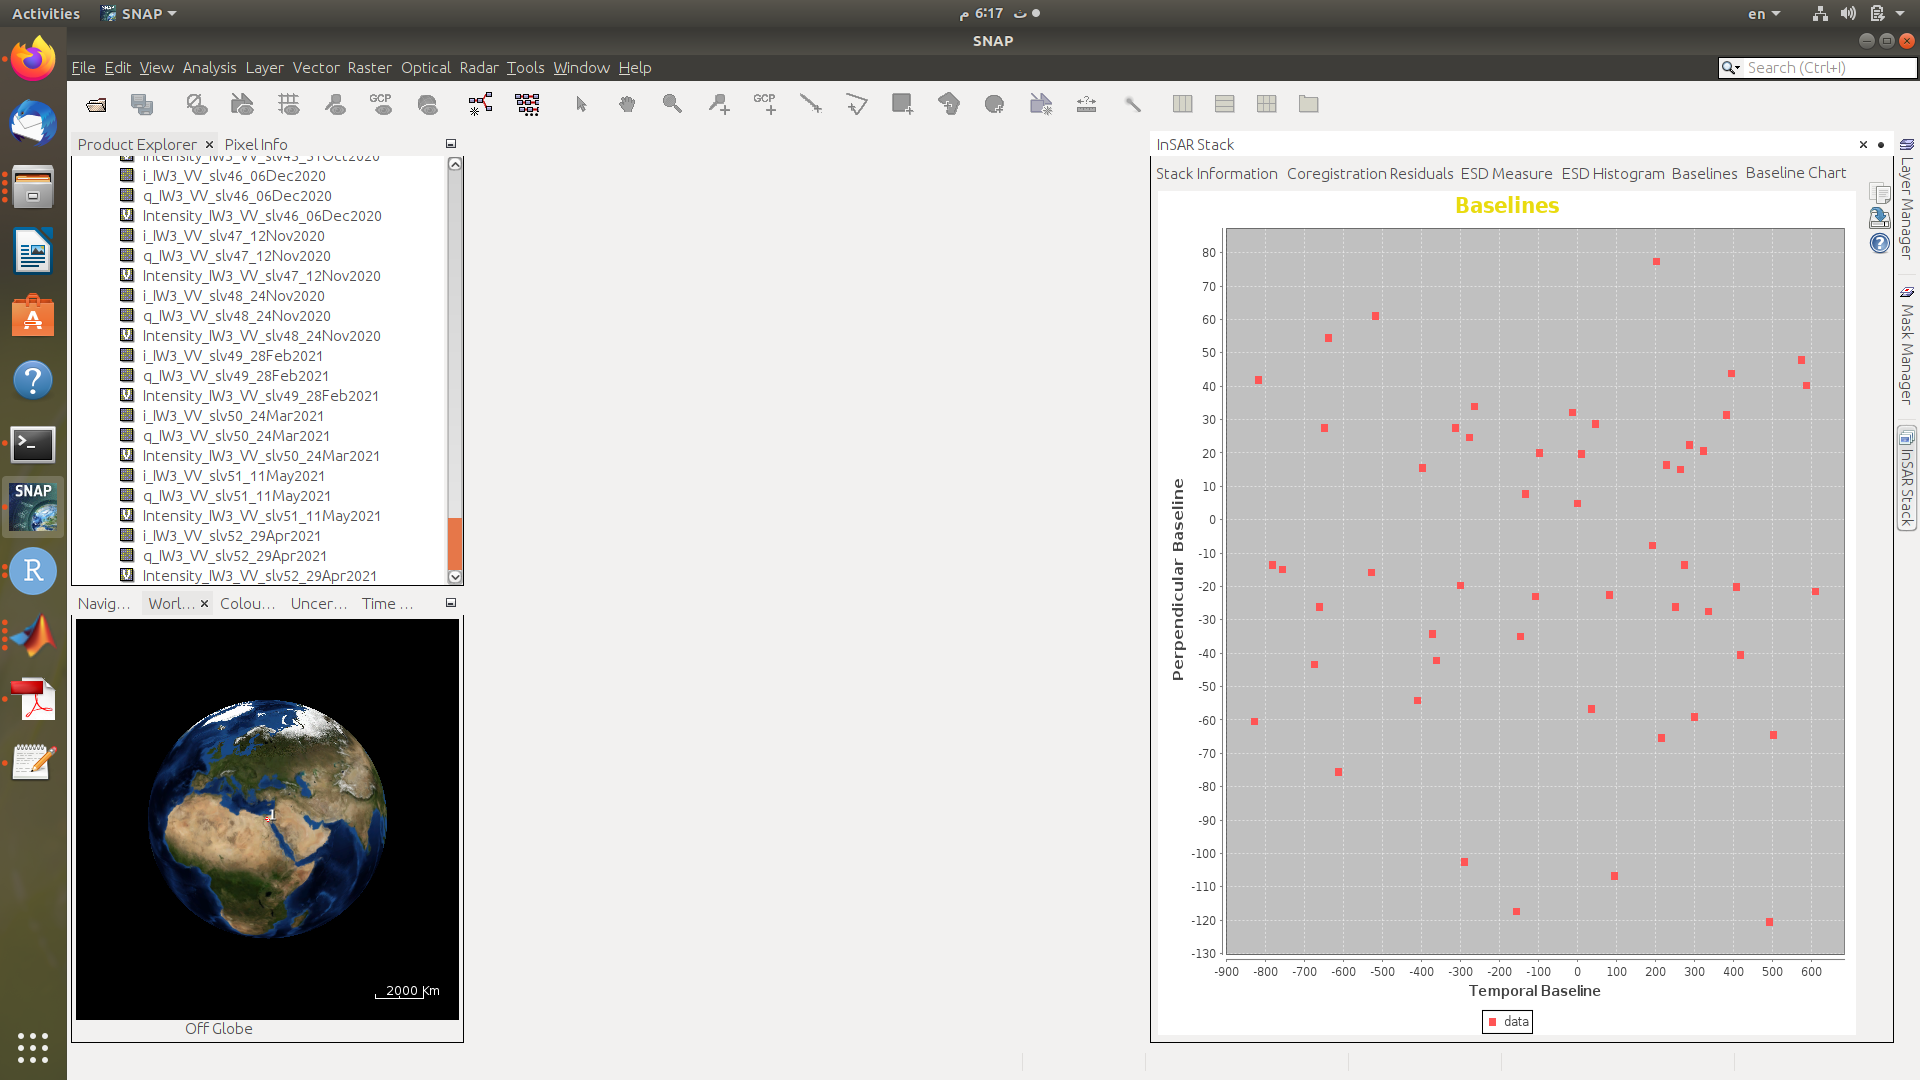
Hi @thho, @ABraun , kindly suggest a way in which the stamps-vizualizer script can be modified to export standard deviation plots as CSV inside Matlab.
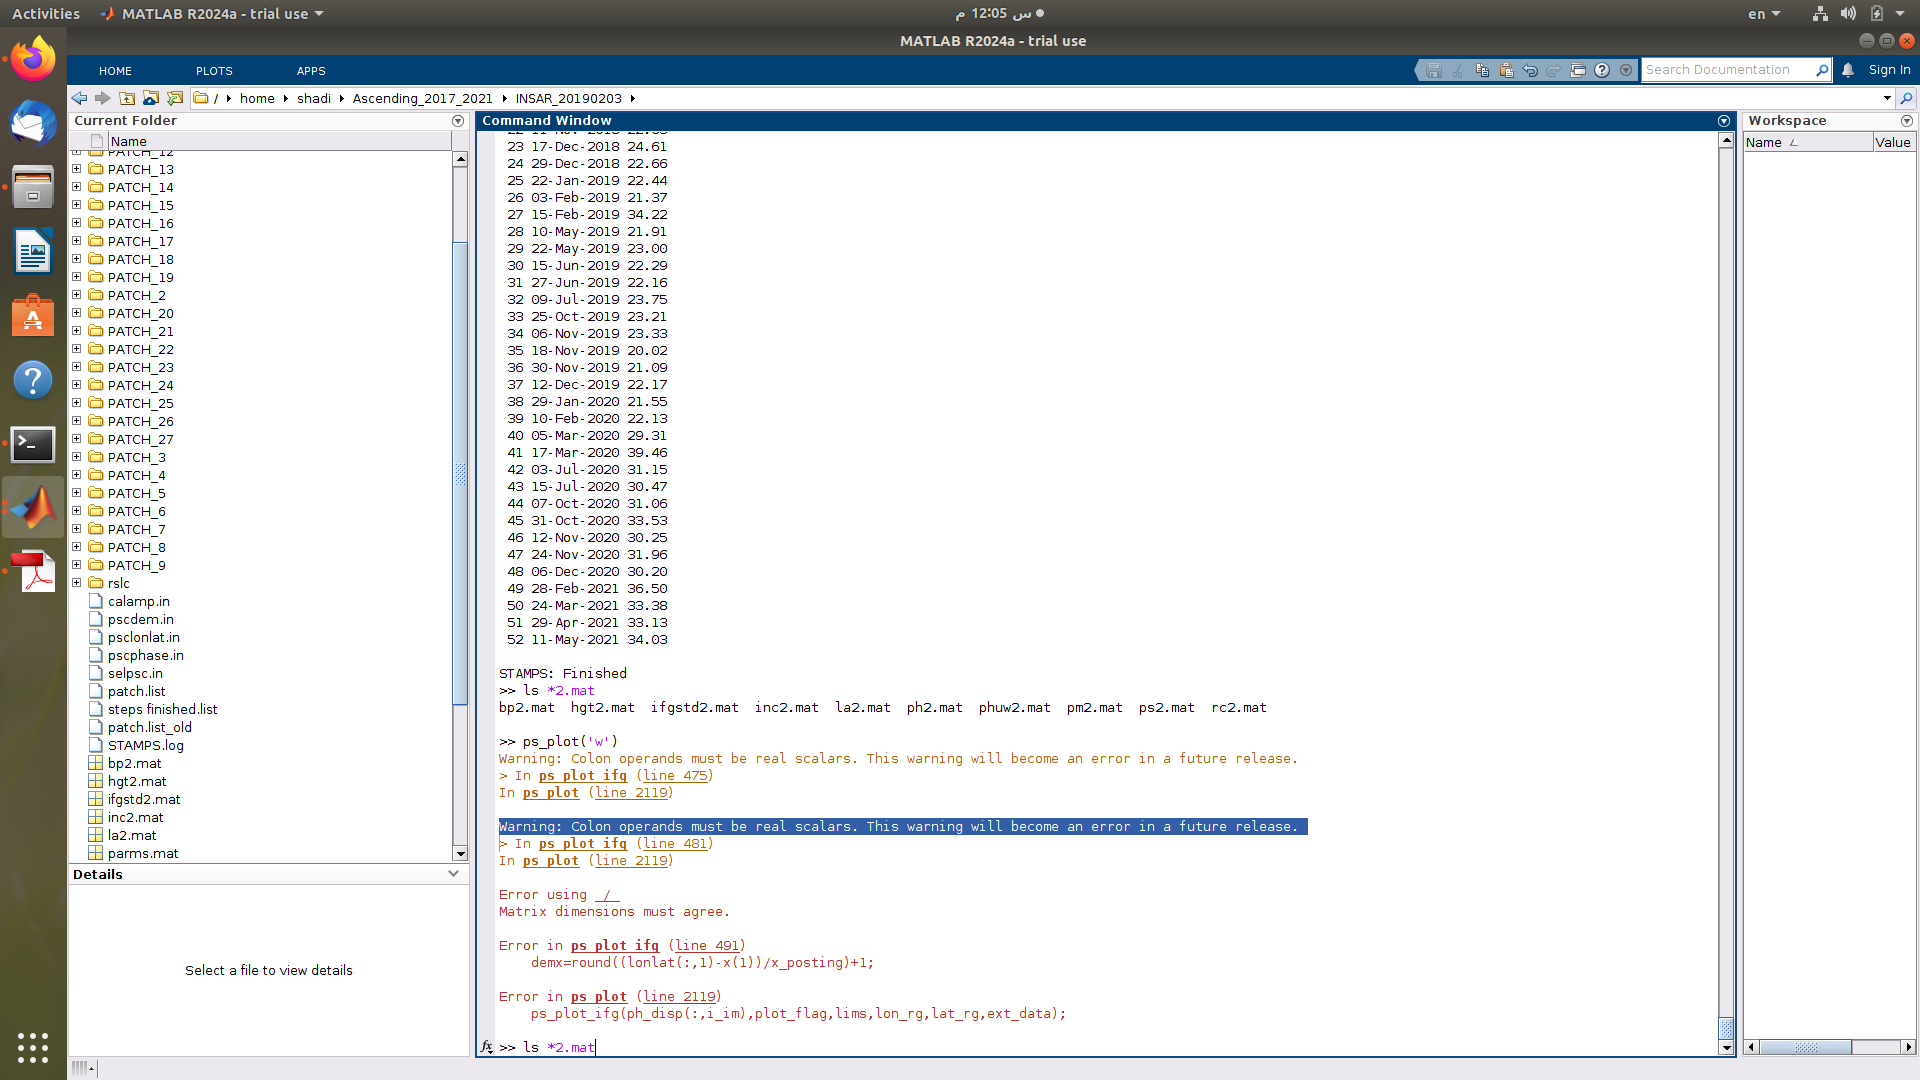
I am encountering this issue that wasn’t a problem when I was using the older matlab version. Please help
- Copy the chart to clipboard (on right side the upper icon)
- open a text editor and paste the chart
I have tried these two steps and nothing is being copied at all even though the baseline chart was properly plotted
were you able to solve this?
is there a way to export kmz files from google earth to display on Stamps visualizer? also is there a method to save high resolution images from stamps visualizer instead of taking a screenshot ? @thho
Is there a way to acquire a TS profile plot using certain point coordinates instead of randomly hovering the cross-hair over the figure produced from the ps_plot(‘v-dao’, ‘a_linear’, ‘ts’) command?
you said it is showing -15mm but where is that value in StaMPS Visualizer. I am not able to see that value in anywhere in your image.
One of my GPS site at that particular location is showing -15 mm/yr.
But i was hoping that within that window of STAmps visulizer,i will also see the slope or velocity of line. But i think it only shows you line and doesn’t display the slope value.
@mdelgado @mengdahl If you have got any ideas that would be helpful would save me from a lot of inaccuracies
Do you mean for visualising the TS? I believe that you have several options:
- using the StaMPS visualizer
- create your own code in matlab that giving a lat/lon coordinates, you find the indices of the matrices to get the time series to visualise and do your own plot
- giving a lat/lon coordinates, zoom into the ps_plot figure until you get the desired point and then click on it to visualise the ts
I must create a TS plot from a desired point in order to export a csv file that contains a number of ps points around a certain with a predetermined radius so that I can view them on STAMPS visualizer, but I must zoon into the ps_plot figure untill I reach the desired pixel. I needed a quicker approach where I can create the TS plot using a given coordinates instead of using the TS plot button.
I don’t really know how to do that
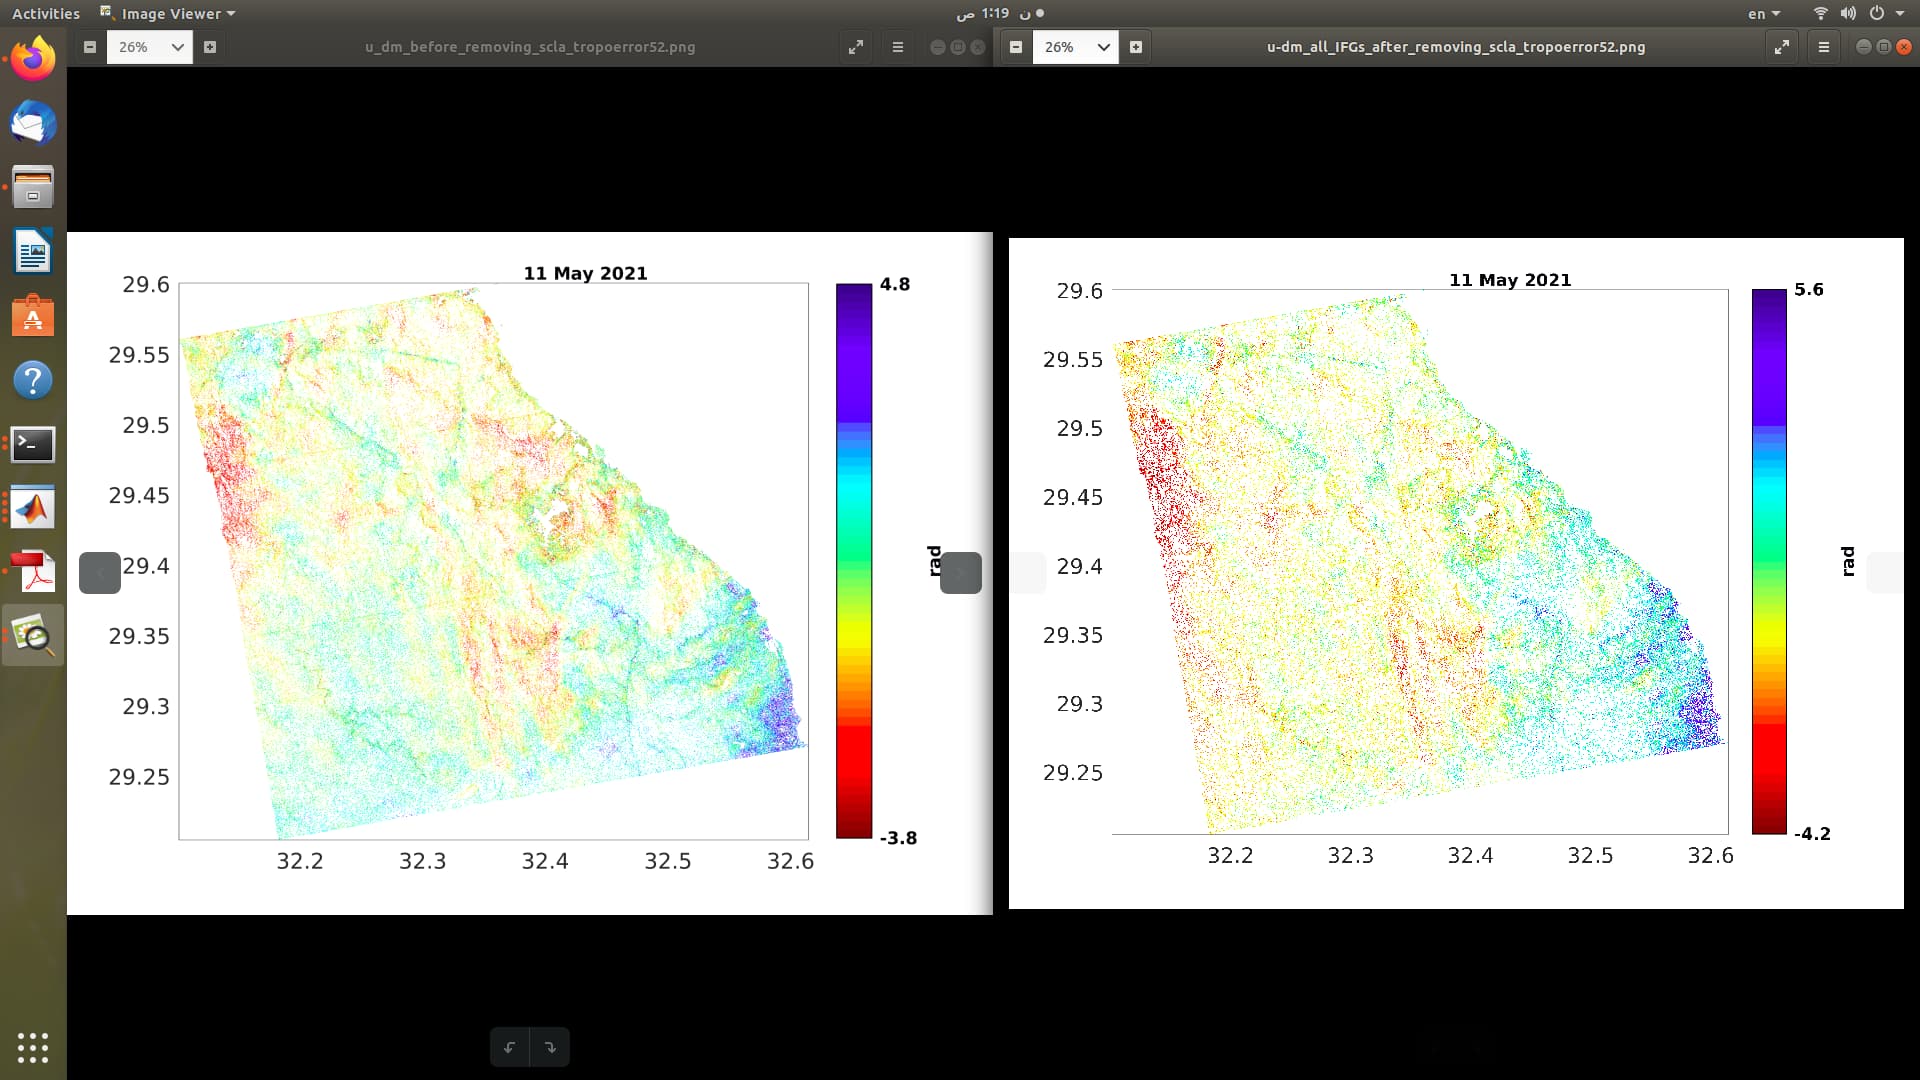
in your opinion, what would you deduce from this comparison? the right unwrapped phase is extracted after removing the spatially correlated look angle error upon rerunning stamps step 6 and 7 where the parameter “scla_deramp” was set to ‘y’ wile the left unwrapped phase was extracted directly after step 6 before estimating any scla error and thus “scla_deramp” was set to ‘n’
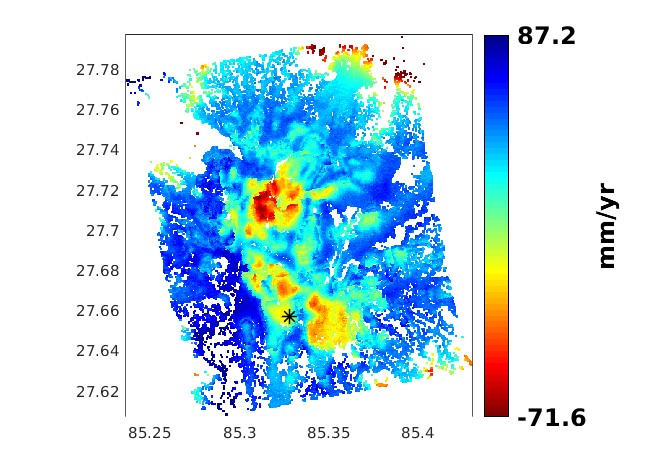
Using the command ps_plot(v-dao, a_liner), I obtained the plot which ranges from (-71.6 to 87.2) but when i generated the csv file and used function min() and max() on third column the minimum is -212.416 and maximum value is 114.9101. can anyone explain why there is such a difference ?
1 Like
Hello guys.
Does anyone know how to generate the file mv2.mat? I have tried several times, and all 7 steps and the TRAIN processing are fine, but I still don’t get this file. Also there is no problem with STaMPS Visualizer export. I need it for mean_v_std information.
Where could the problem be?
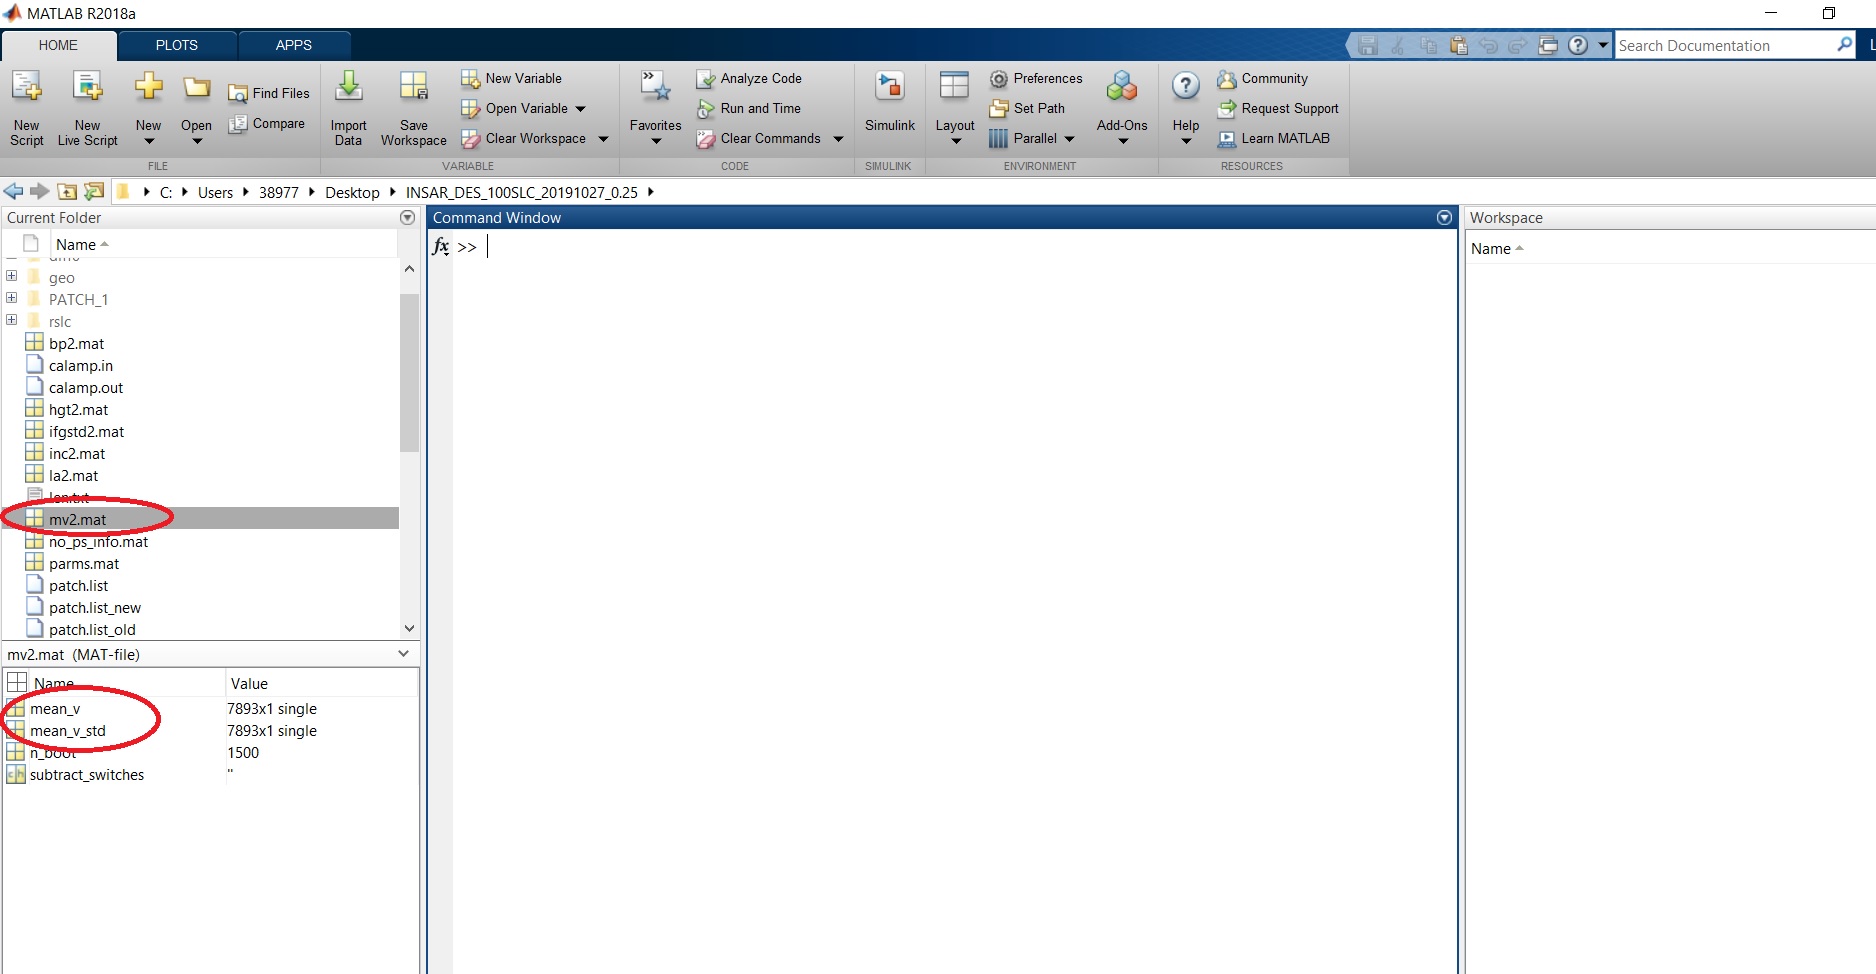
The solution is very simple ![]() . It is necessary to use the command ps_plot(‘vs’). After that it will create mv2.mat file which contain analytical value of PS standard deviations.
. It is necessary to use the command ps_plot(‘vs’). After that it will create mv2.mat file which contain analytical value of PS standard deviations.