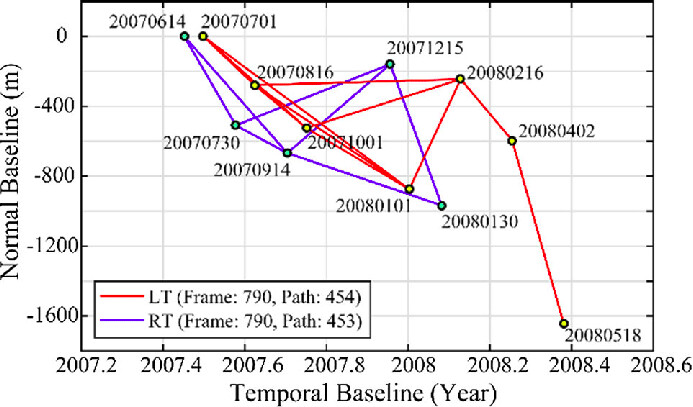
Could we show the dates of each scene and show additional information like this ? I am still not sure how but I don’t think it would really give valuable information when compared to the struggle behind creating such complex chart
I checked the Matlab source, but no longer have Matlab after retiring. The Matlab code does use centre, but the problem comes from getparm.m, which has:
function [value,parmname]=getparm(parmname,printflag)
%GETPARM get parameter value from parms.mat
%   GETPARM(PARMNAME)
%   Only enough characters of PARMNAME to make it unique need be typed
You could try using ref_cent.
Sometimes errors like this are caused by editing text files with a Windows editor. Linux uses one
“newline” character, Windows uses 2 characters. Another source of problems is Unicode “look-alike” characters. Some Unicode fonts have multiple variants for dashes and underscores (different widths).
hello mr @thho if i may ask, what’s the unit of mean velocity under that NaN column? thanks in advance!
do you know why it says rlang is not available during installing?
hello, i have problem to install shiny packages, can you help me?
may i know the result that you generate for the stamps and stamps viisualizer sir? i am lost at this part
Dear @thho and everyone,
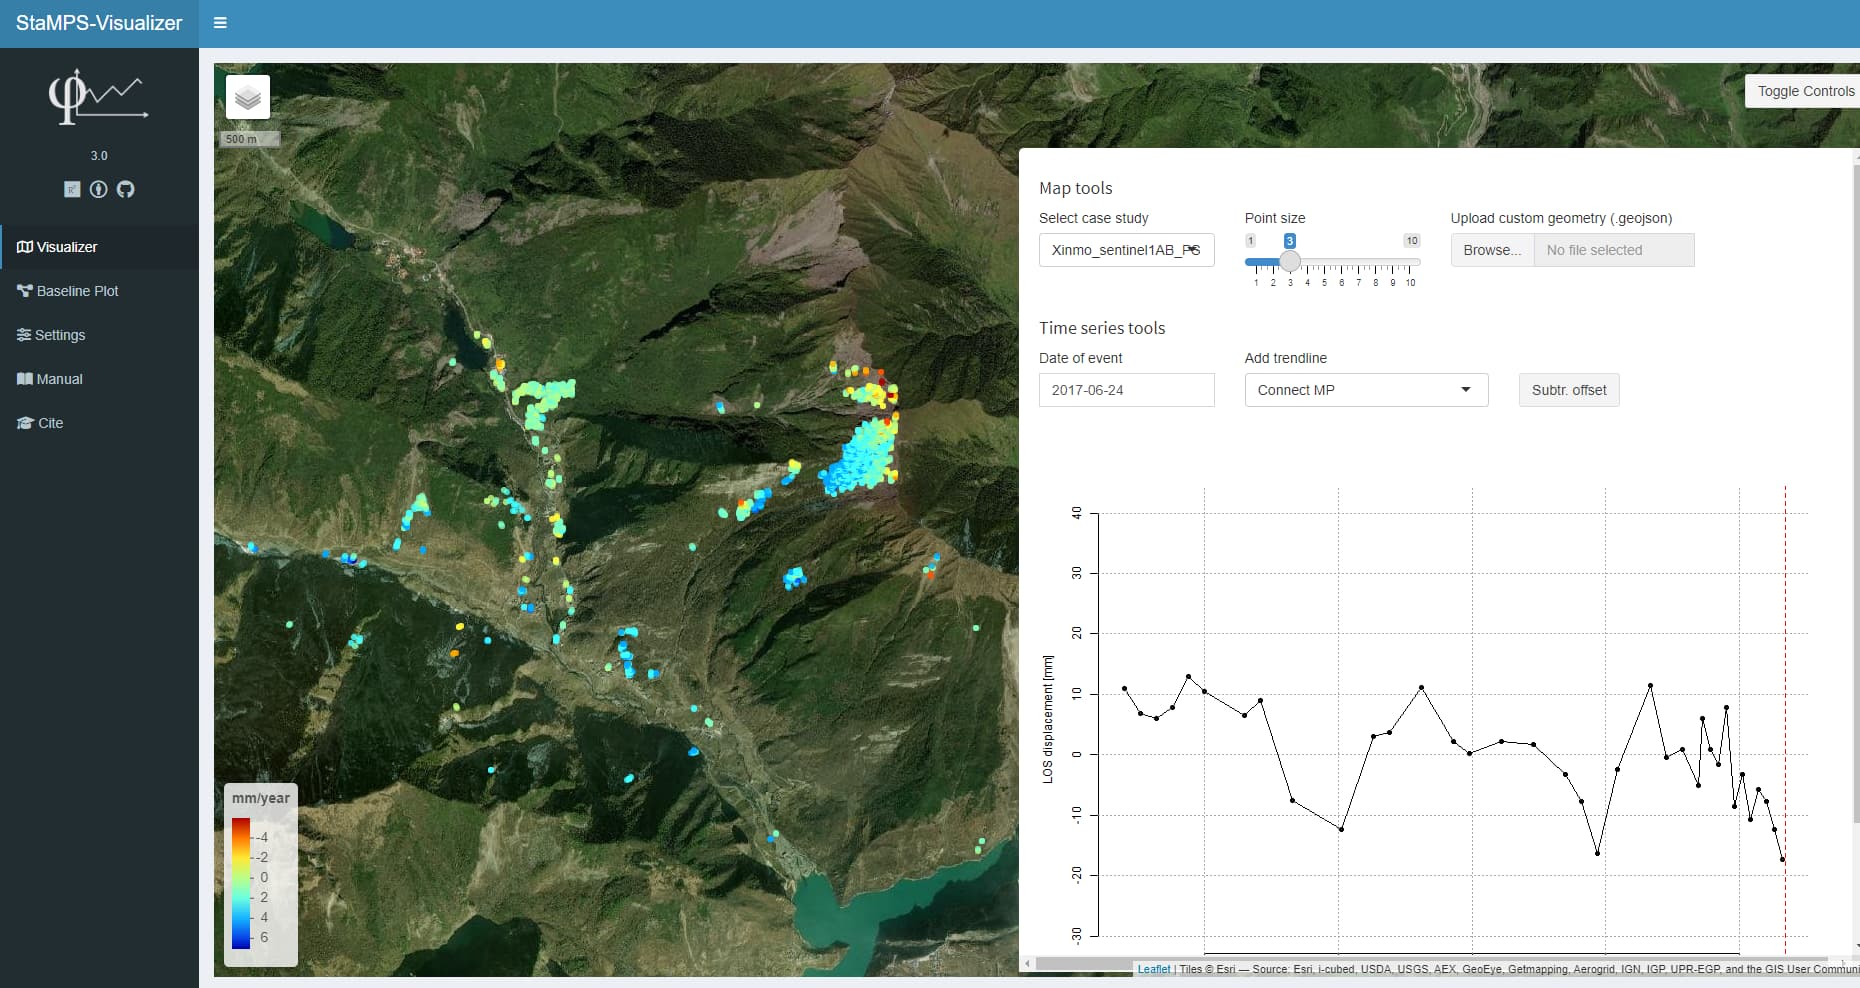
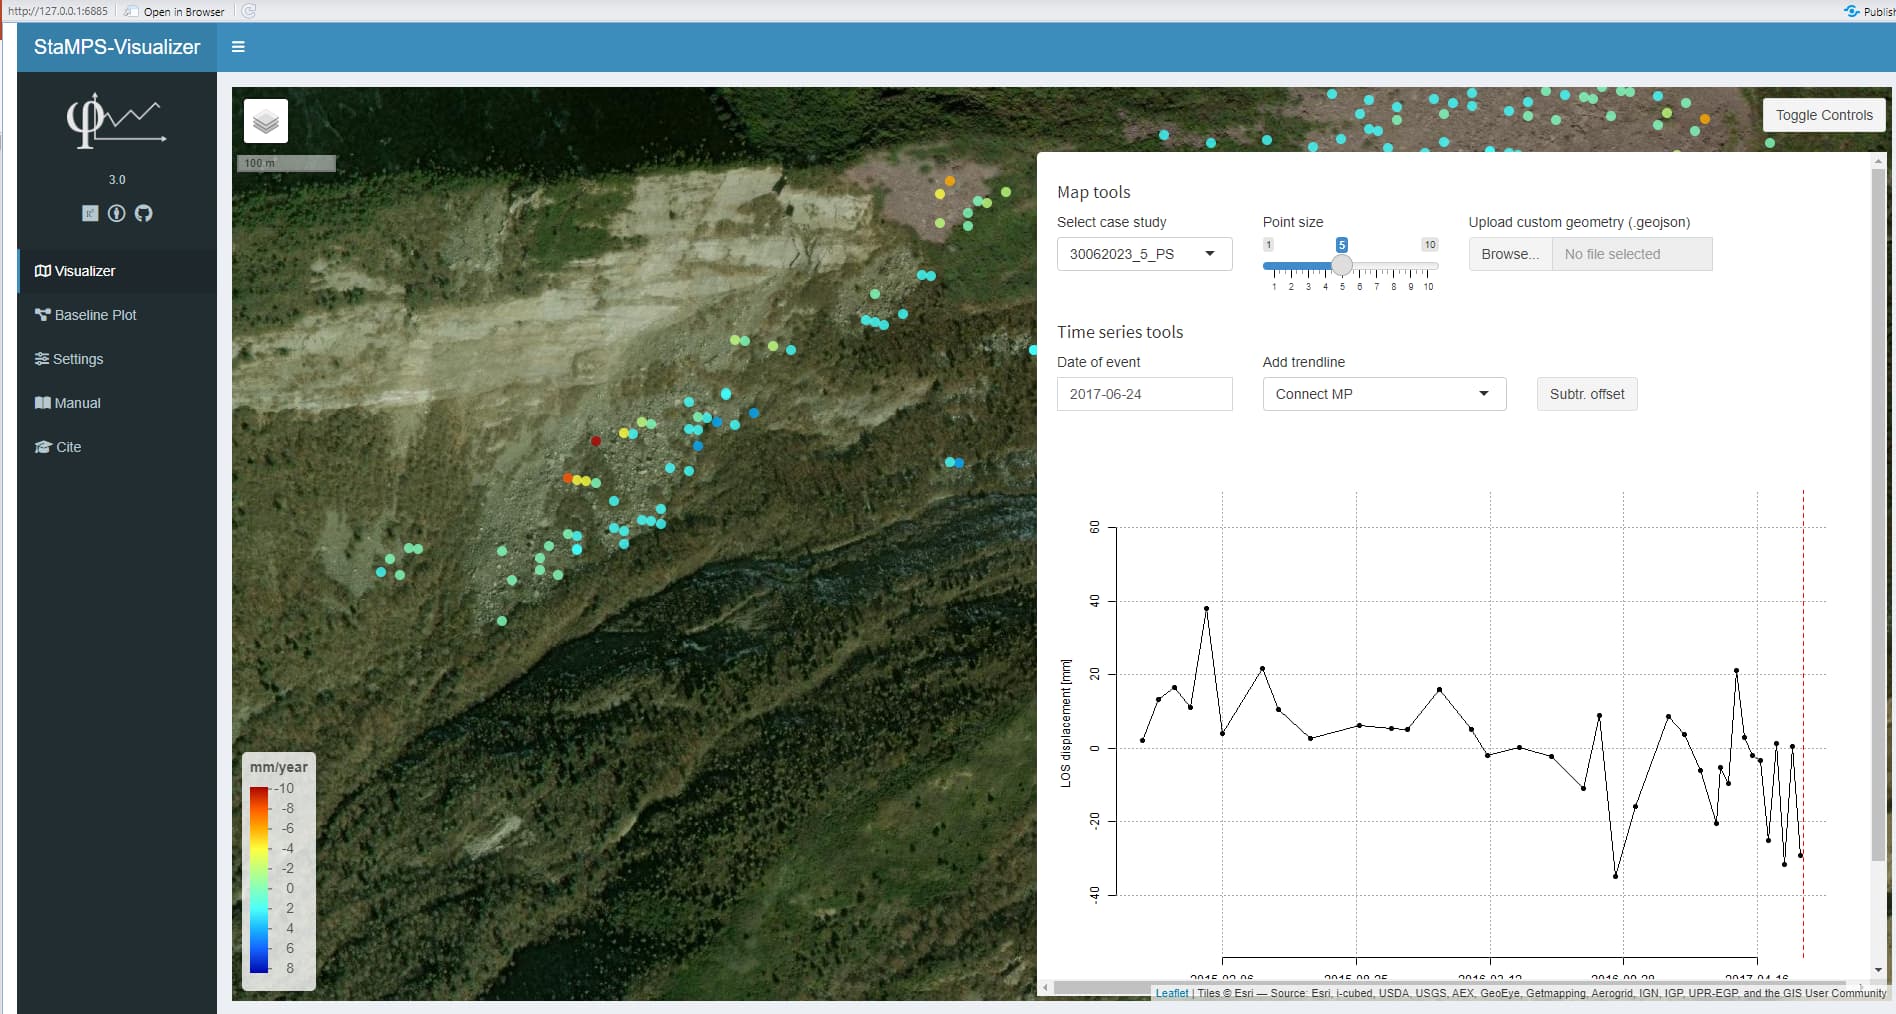
I’m trying to reproduce the result of the Maoxian landslide using 36 SAR images.
This is my PS analysis result using SNAP,snap2stamps, StaMPS, StaMPS-Visualizer. ( where I set up some parameters such as setparm(‘weed_standard_dev’, 0.5); and setparm(‘scla_deramp’, ‘y’); setparm(‘ref_centre_lonlat’,[103.64, 32.09]); setparm(‘ref_radius’,50) )
1, Can you share with me the StaMPS parameters you choose to get your results or give me advice to get better results (i.e. your example in the software: your results have a robust decline trend of displacement, while my results are very fluctuating)
2, why is the LOS displacement of all points not from zero on the first day of the analysis? (i.e. every point has different starting values of LOS displacement?)
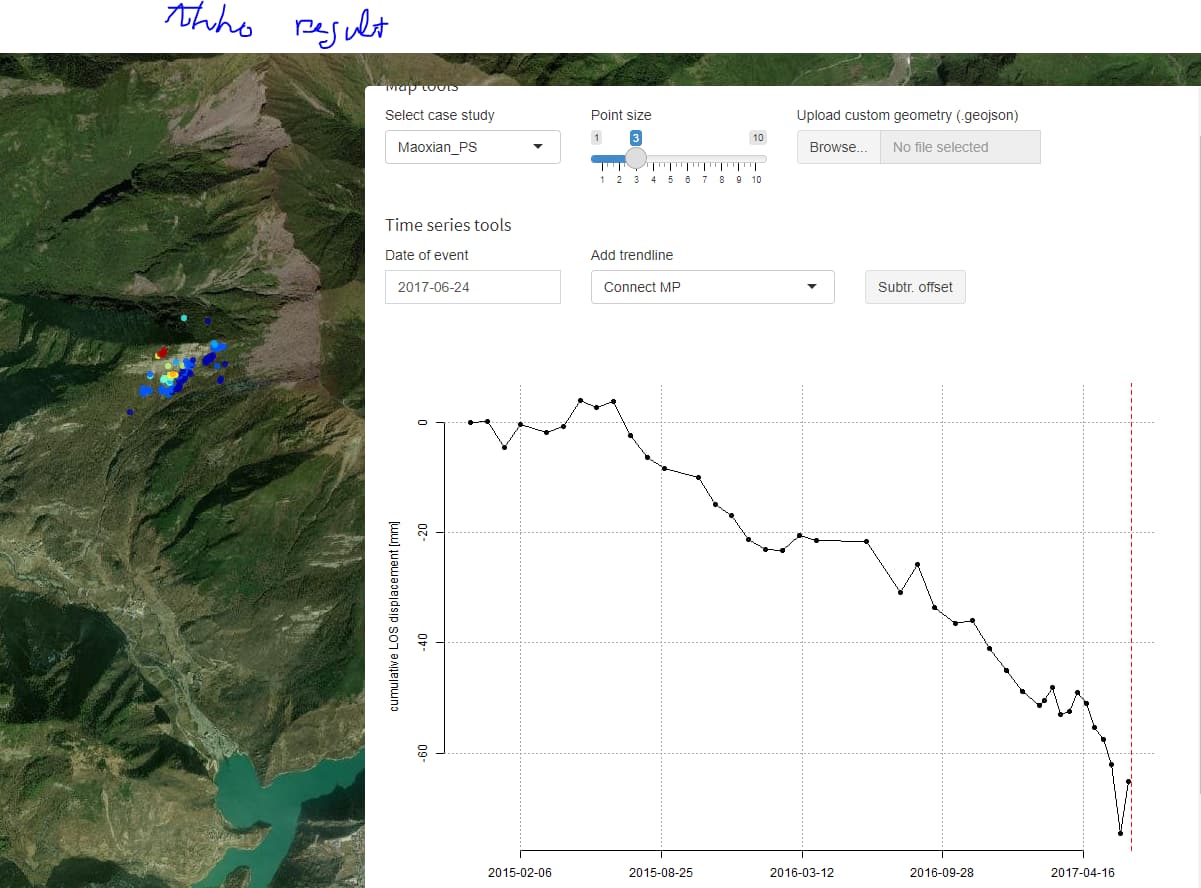
(This picture below is ttho result)
P/s: thank you so much for the beautiful and useful software.
Regards,
Tai
1 Like
P/s: I have already tried to modifed StaMPS parameters like your thesis, but still haven’t get the expected results.
setparm(‘unwrap_time_win’, 24)
setparm(‘unwrap_grid_size’, 10)
setparm(‘unwrap_gold_n_win’,8)
setparm(‘scn_time_win’,50)
What should I can do to improve the analysis?
*2, why is the LOS displacement of all points not from zero on the first day of the analysis? (i.e. every point has different starting values of LOS displacement?)
I read through all discussion, the answer can be found here.
From my understanding at the moment: The time-series plot is the relative displacement at a point over time and the different of the first day because they compare with the master day displacement.
After a lot of testing and also reading through the forum.
I may figure out there a lot of parameter can fluence to the results, but still can not to figure out how to have a “perfect trend”.
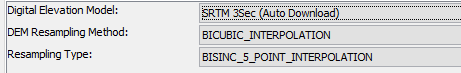
And also the interpolation method and DEM model can influence to the results.
SRTM 3Sec or SRTM 1Sec, BICUBIC or BISINC_5_POINT or BILINEAR_INTERPOLATION.
Some of them can be considering:
setparm(‘unwrap_time_win’, 24)
setparm(‘unwrap_grid_size’, 10)
setparm(‘unwrap_gold_n_win’,8)
setparm(‘scn_time_win’,50)
setparm(‘unwrap_gold_n_win’,32)
setparm(‘merge_resample_size’,4)
My other result
Finally, I found a discussion that may help to improve results.
1 Like
how to export from stamps matlab into csv format?
https://thho.shinyapps.io/StaMPS_Visualizer/
Go to manual, then run the code in Matlab.
Hello, thank you very much for your explanation. Another option could be to use the “ps_info” command directly in StaMPS. The result is the following, do you think it is equivalent to the procedure you describe? The main difference would be that one graph with dates and the other with the time line?
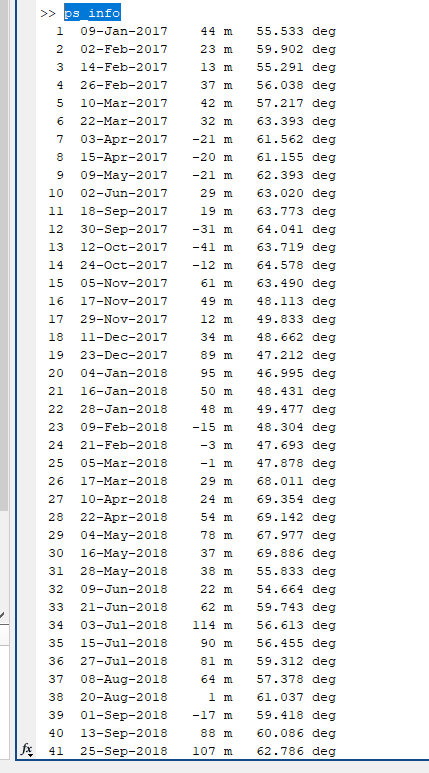
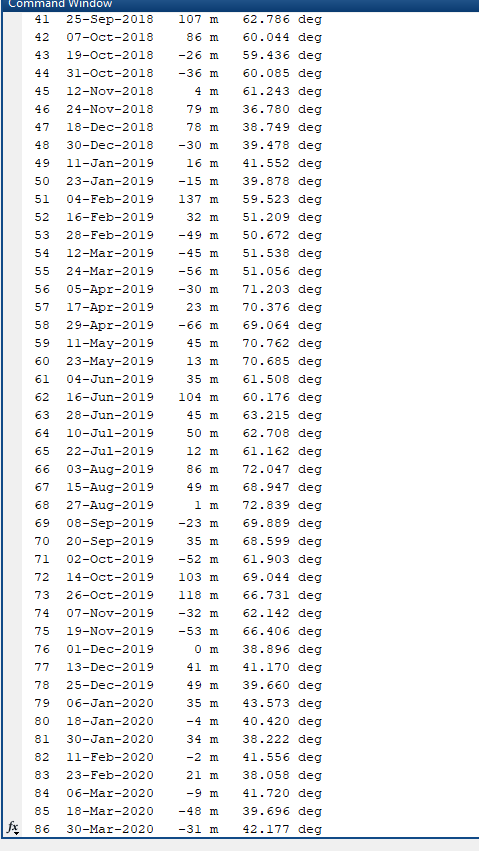
Note: The date of the master image is zero
Hello ! the ‘v-do’ I checked in matlab has a different rate range from the exported csv and shp, why? Which is accurate. Thank you for your answer
Hello @nachin6789, do you find a method to extract the coherence of each PSs? (i’m using SNAP+StaMPS workflow)
My best,
Othmane.
1 Like
Hello, does anyone can help how to select or how to count pixel density at a specific area by using stamps?
Thank you.
@thho Dear sir, I ran stamps(7,7) and ran ps_plot(‘v-dao’,‘a_gacos’,1,0,0,0,‘ts’) to get a deformation rate plot, where clear subsidence funnels can be observed, but patch montage traces can be clearly observed spatially, as shown by the red circles in the figure below.
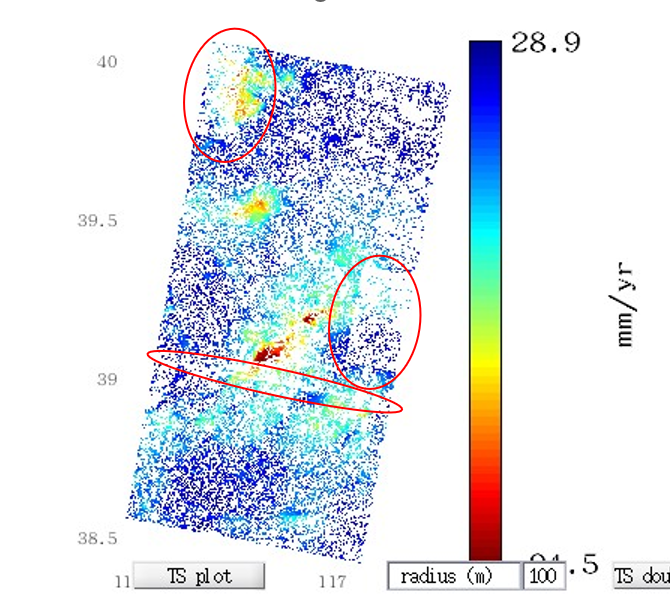
Running ps_plot(‘w’) to view the interference pairs, clear patch montage traces can also be seen in red circles, as shown below.
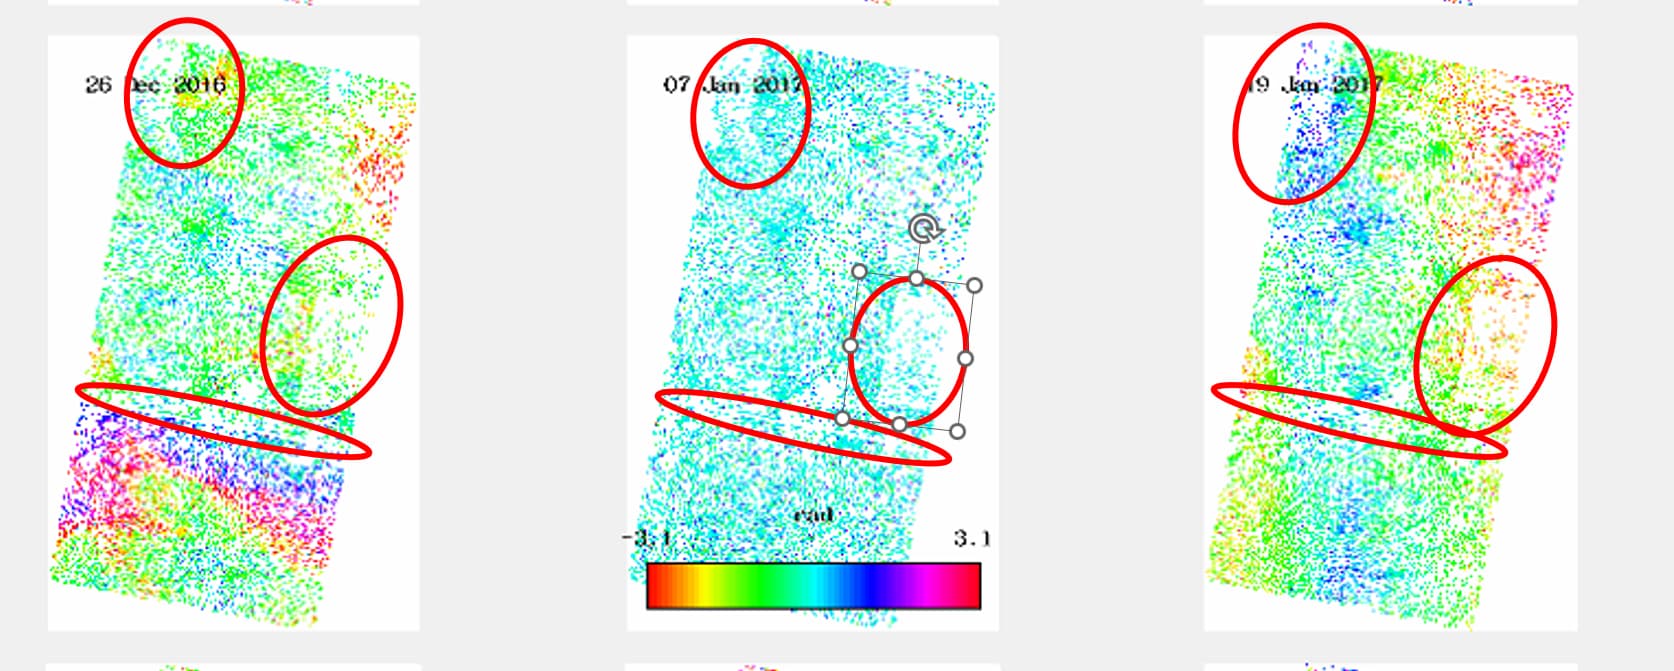
What should I do to solve this problem, thank you for your concern!
Hello, sir. I ran the following code

matlab reports an error of ‘the function or variable ‘lon2’ is not recognised’. It seems that the latitude and longitude files (lon2 and lat2) are not generated, how can I solve this problem, thank you for your attention!
@thho : Dear Sir, I am trying to run StaMPS Visualizer. I am using window 11 and R 4.3.2 version and R-studio 2023.12.1. I followed the steps as mentioned in [GitHub - thho/StaMPS_Visualizer: Shiny application to visualize DInSAR results processed by StaMPS/MTI]. The following the screenshot of my execution.
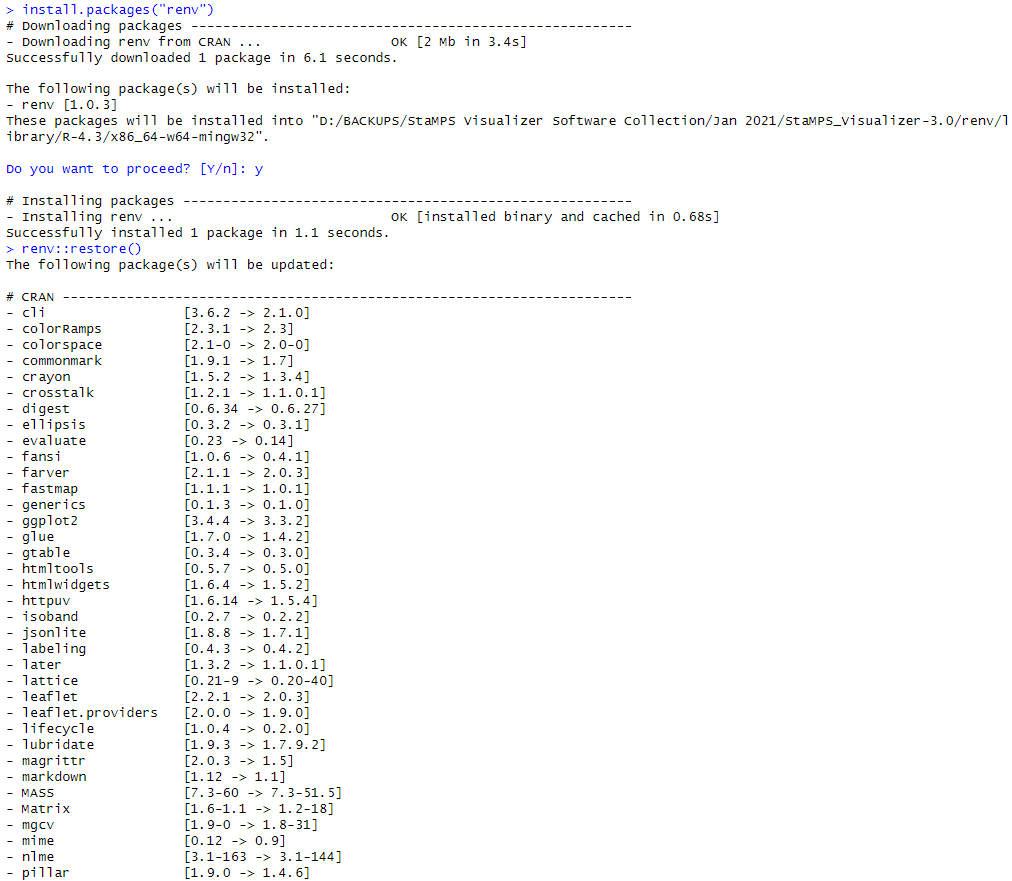
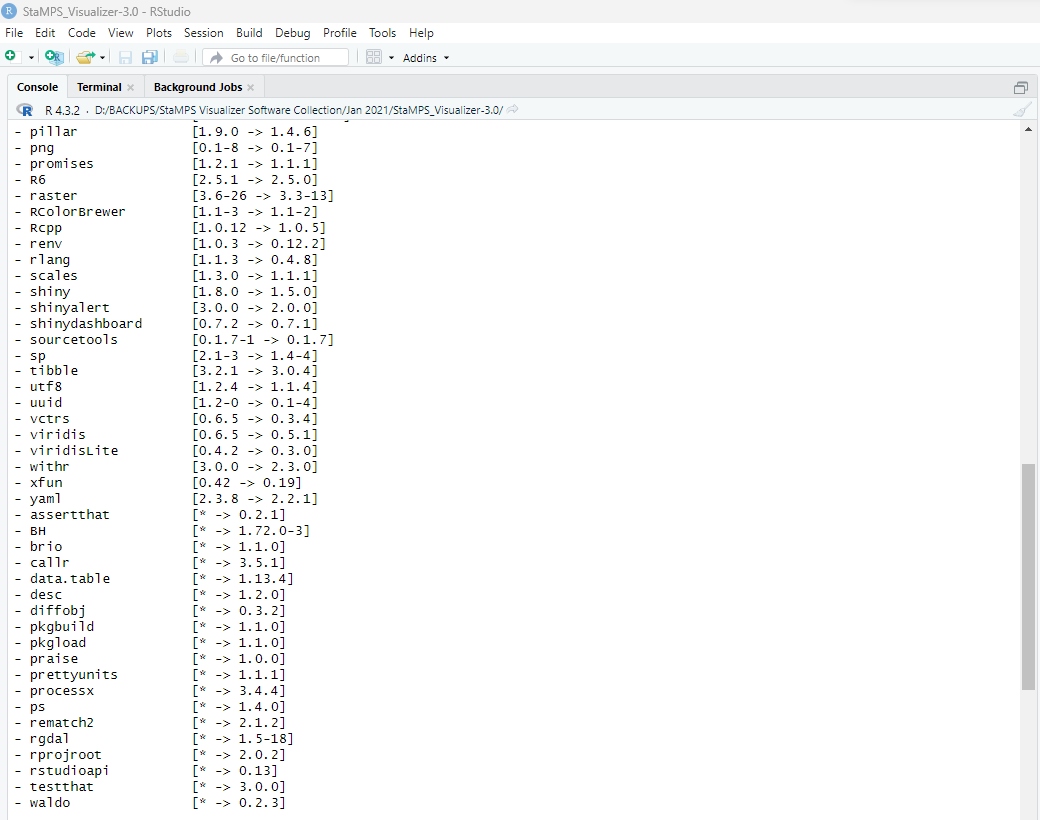
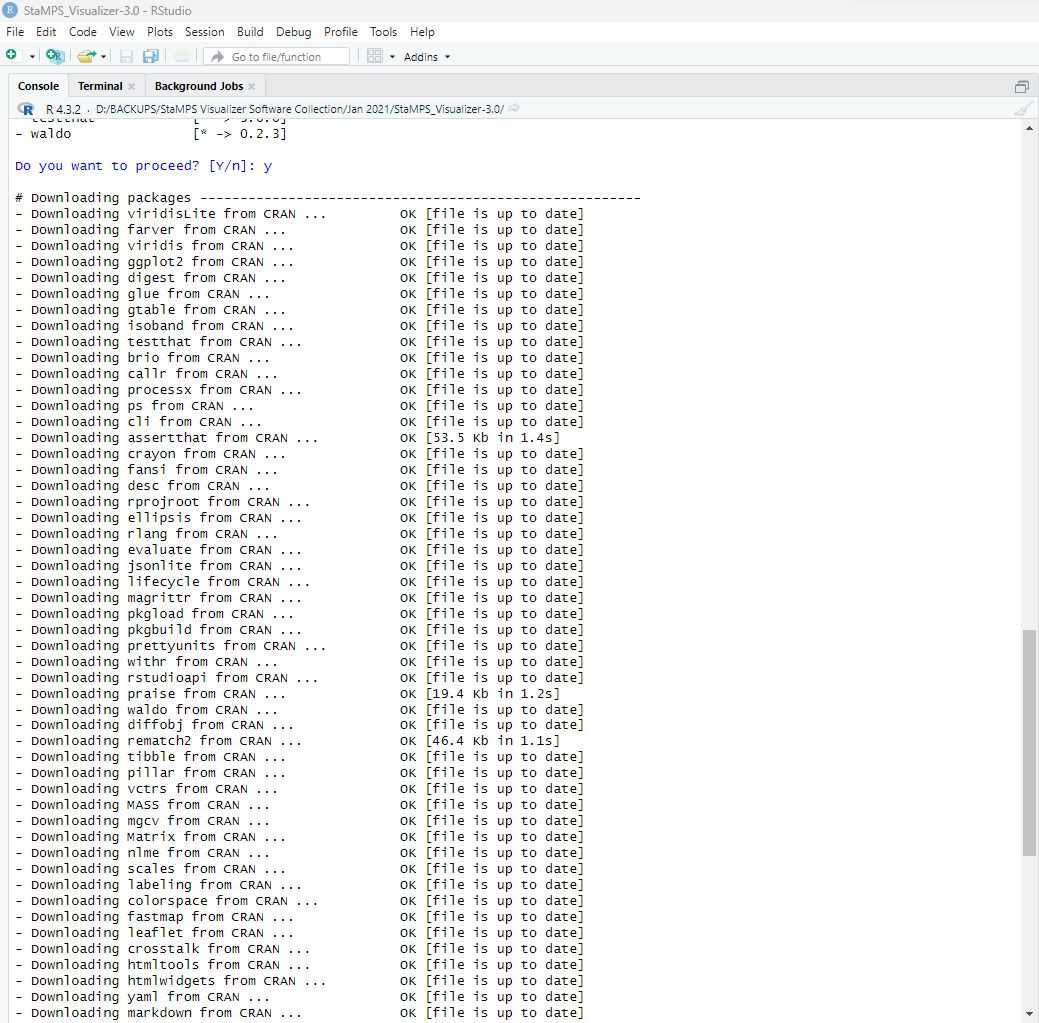
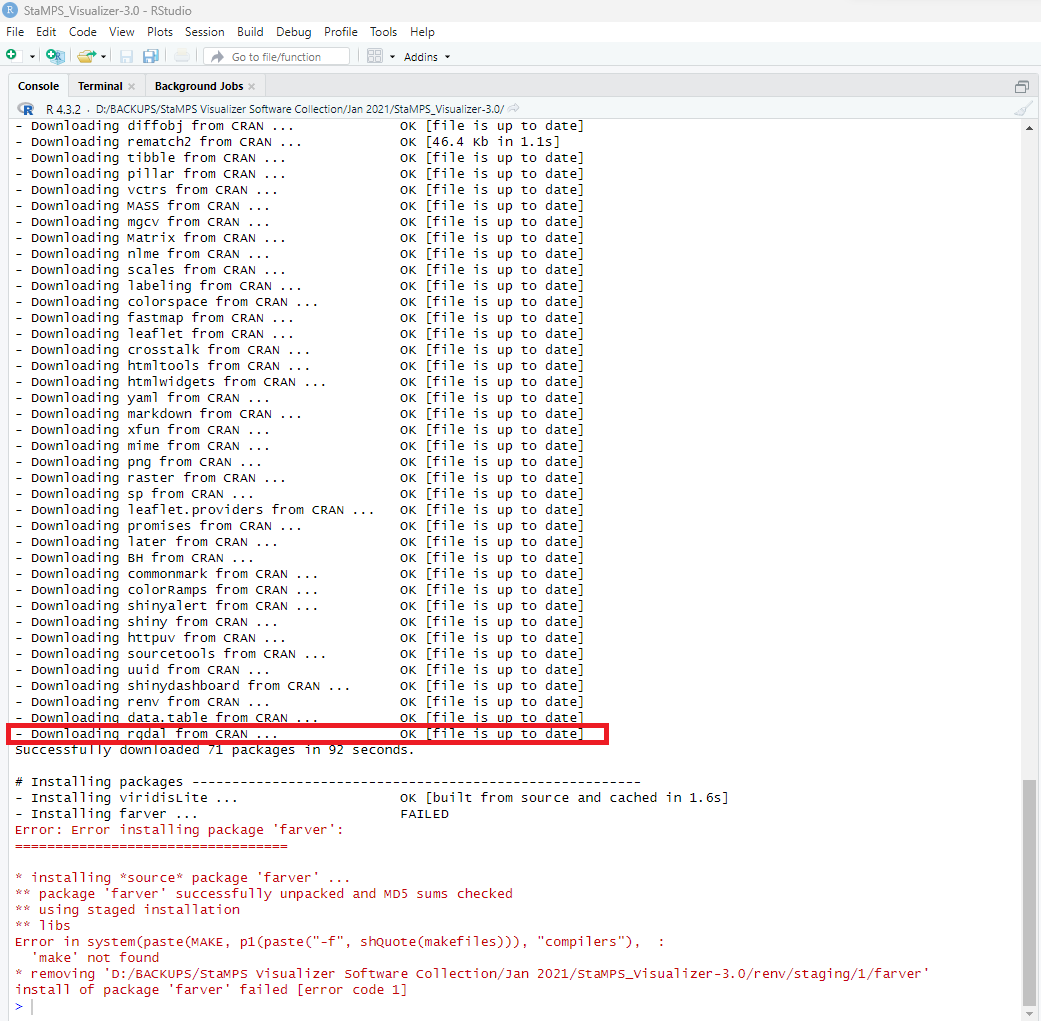
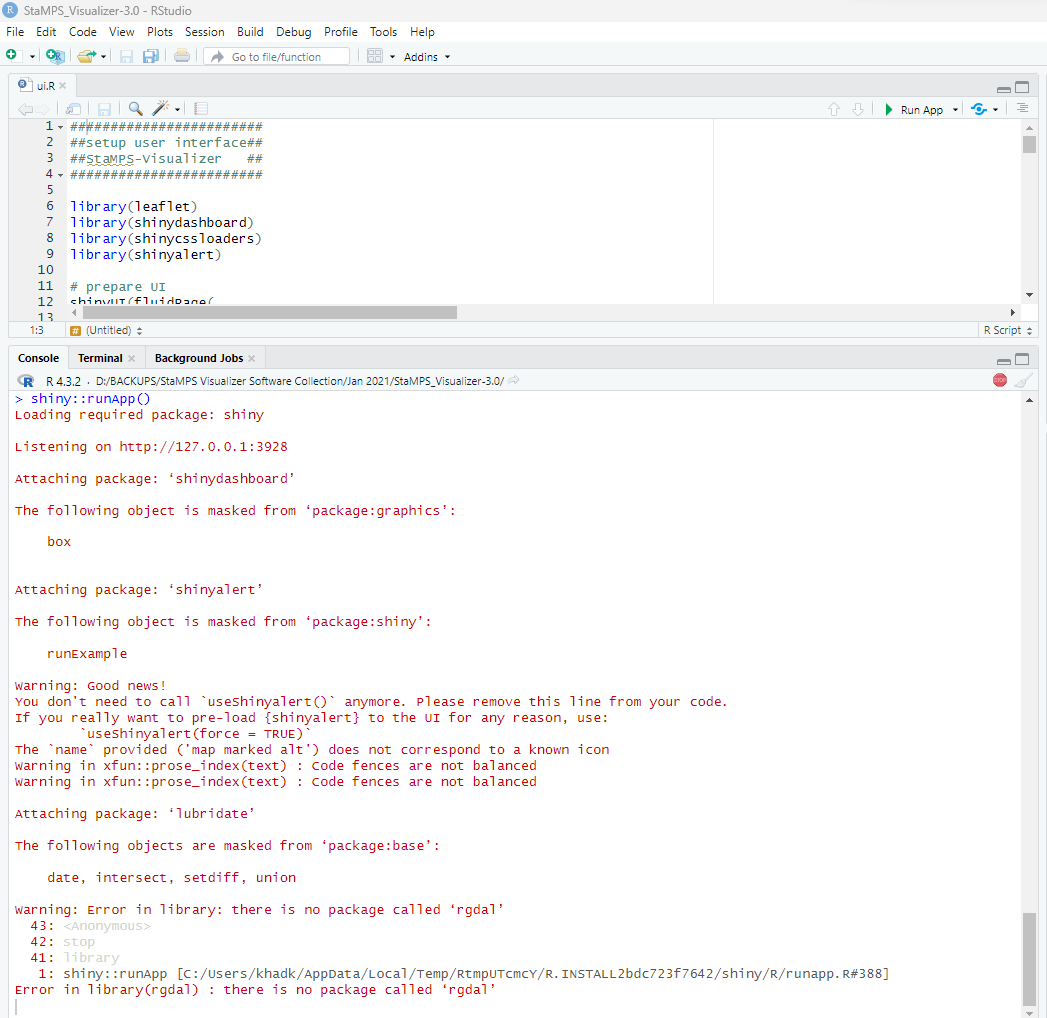
When i try to run the app. The app tries to open for few second and closes automatically. I see some post
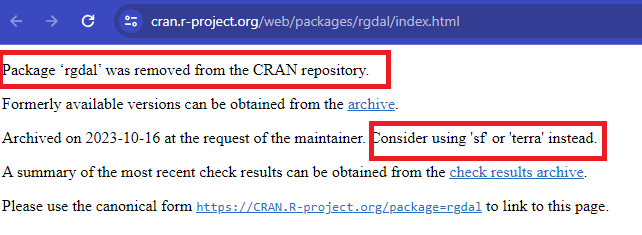
So, I also tried to install ‘sf’ in place of rgdal and tried to run the app but still the error persists. I am not being able to figure out the problem. I am hoping for yours kind suggestion to get rid out of this problem.
-Diwakar
I have the same problem. @thho is there a solution for it?