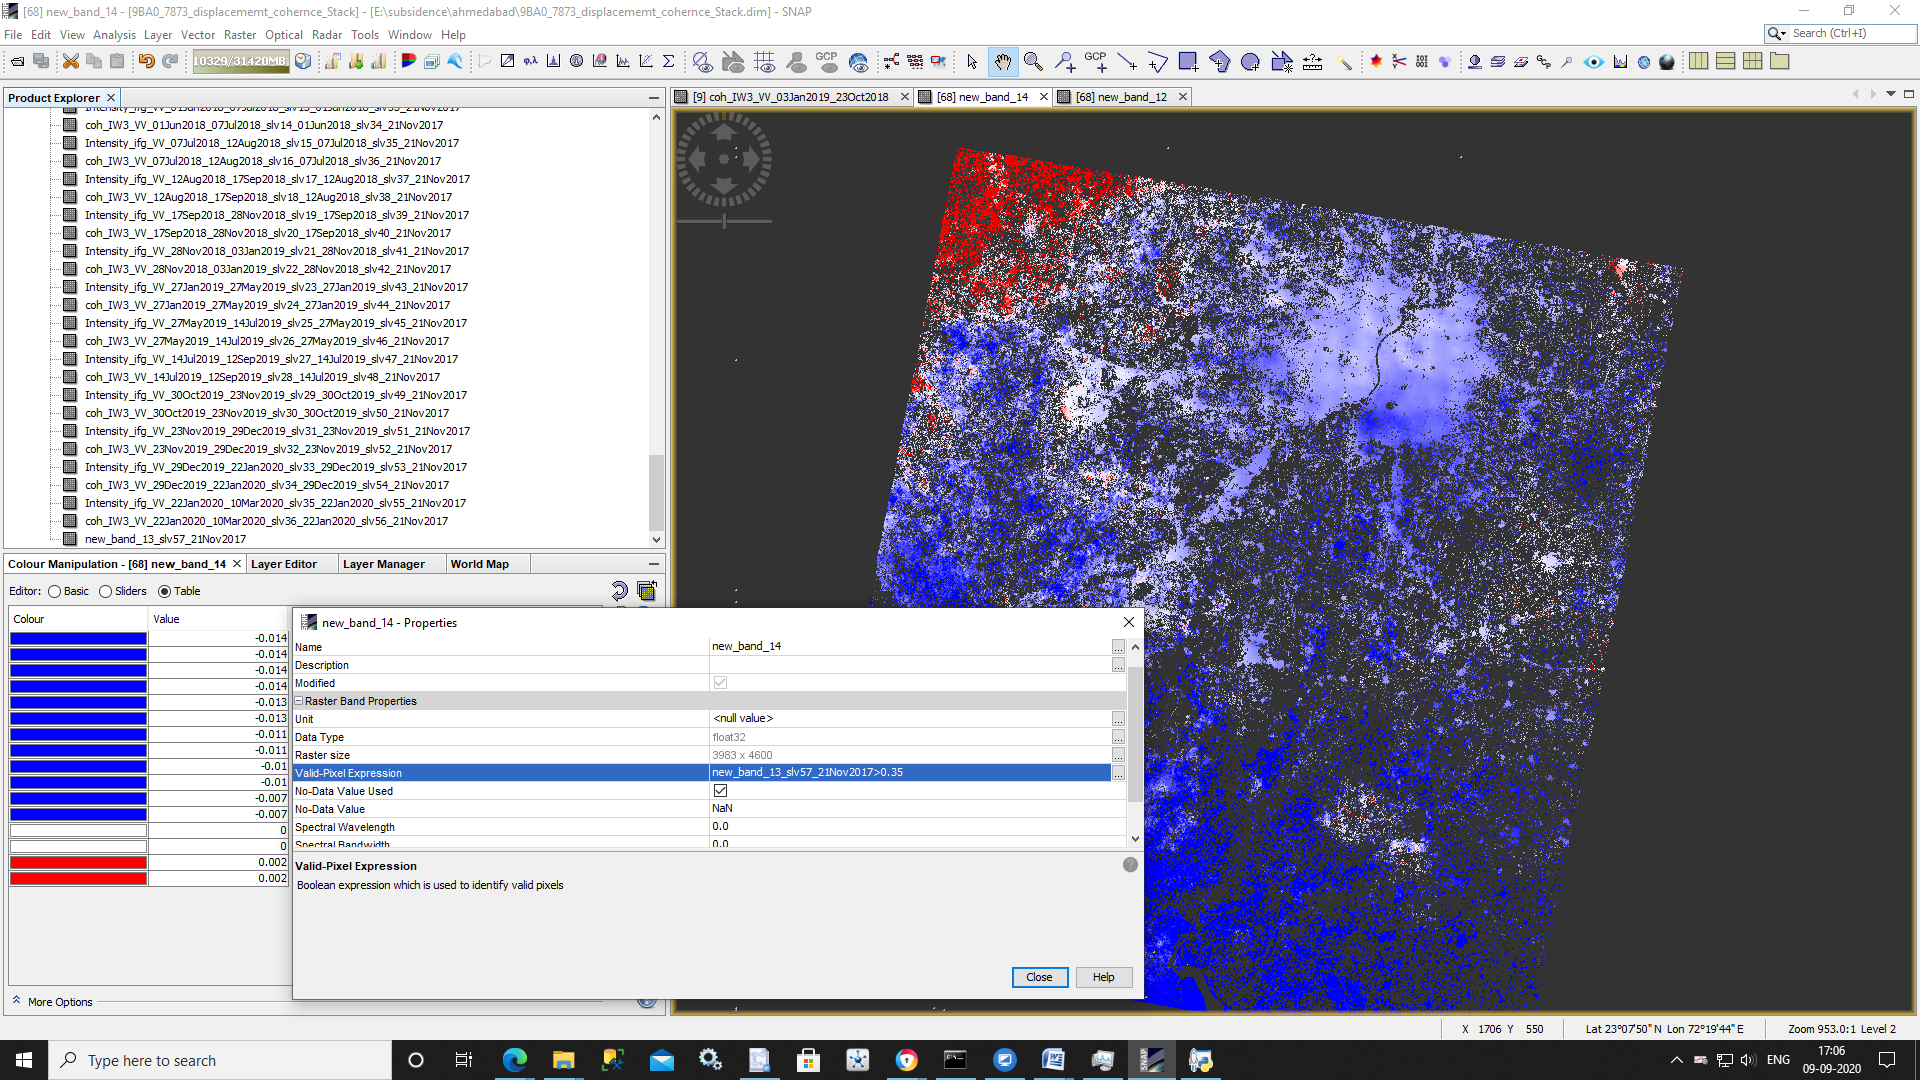
I created combined stack of only displacement band (1+2+…19), using this created one average displacement band using Band Math(dis1+dis2+dis3+…dis19)/19.
And then same way i created combined stack of only coherence band (1+2+…19). using this created one average coherence band using Band Math (coh1+coh2+coh3+…coh19)/19.
Then finally i stacked both of this bands.
properties of the displacement band (new_band_14), placed coherence band value (new_band_13_slv57_21Nov2017) >0.35 as shown in below figure.
Phase to Displacement
The unwrapped phase is now a continuous raster but not yet a metric measure. To convert the radian units into absolute displacements, the Phase to Displacement operator (under Radar > Interferometric > Products) is applied. It translates the phase into surface changes along the line-of-sight (LOS) in meters. The LOS is the line between the sensor and a pixel. Accordingly, positive values mean uplift and negative values mean subsidence of the surface (if the master image is the earlier acquisition date). Copied from InSAR Displacement Mapping with ERS data Issued April 2020 Andreas Braun.
Please clarify this one.
Because if LOS is increase (means sensor to ground pixel distance increases (+ indication)) I’m getting subsidence (- indication) and vice versa.
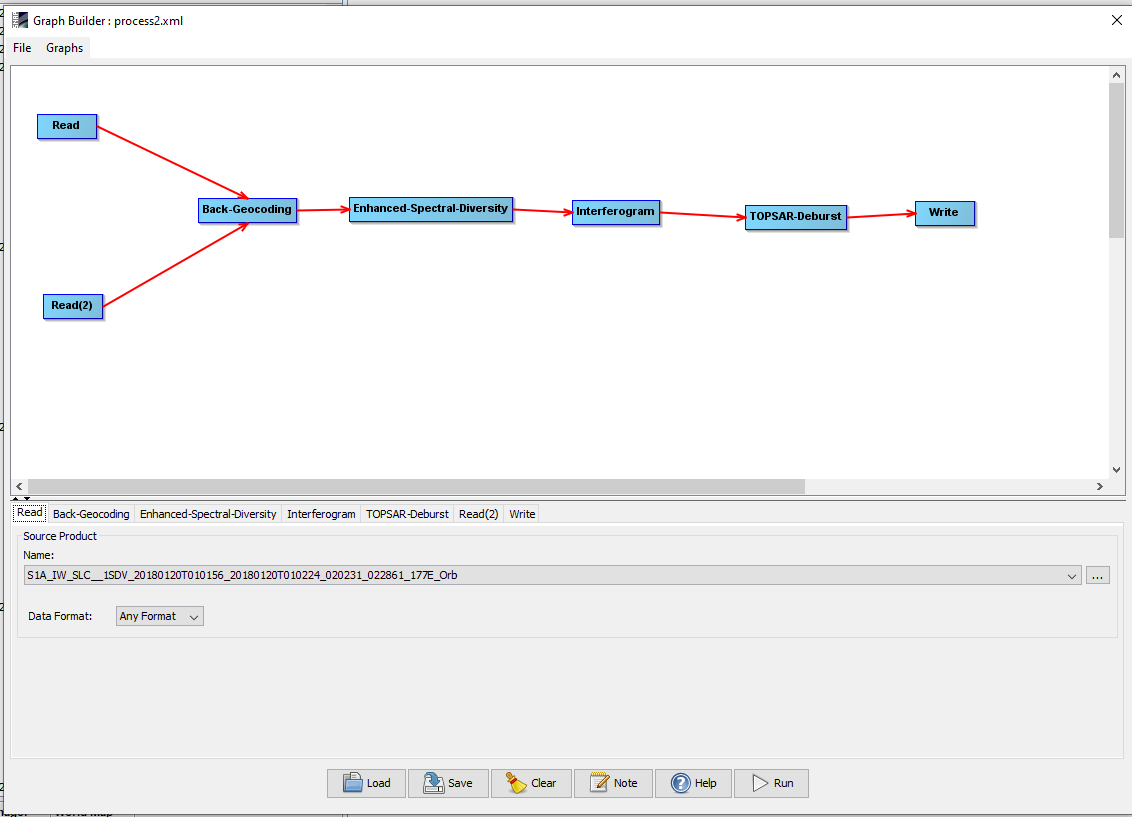
In this processing as it will (as you said) 1+1, 1+2, 1+3 … but i got 1+2, 2+2, 2+3, 2+4…(shown in below figure) how can use this for DInSAR processing.
there is no general rule for this. with 1+2 you capture the displacement based on a period of maybe 12 days, but with 2+5 this period is 36 days (if we assume 12 days between each subsequent pair).
Sometimes, longer periods result in more clear patterns, but they also suffer from higher decorrelation. On the other hand, it often depends on which incidents you want to analyze, e.g. if there was a specific date since something happened, so you place your image pairs around this incident.
If you want to understand the temporal dynamics of a longer time-span it is often good to add subsequent pairs (for high coherence), so 1+2, 2+3, 3+4 and then add up the displacements or visualize them over time in a graph. Check how this was done in this tutorial (slides are old but the last part on the multi-temporal analysis is still valid) https://eo-college.org/resource/insar_deformation/
PS_EST_GAMMA_QUICK: Starting
PS_EST_GAMMA_QUICK: Estimating gamma for candidate pixels
GETPARM: filter_grid_size=50
GETPARM: filter_weighting=‘P-square’
GETPARM: clap_win=32
GETPARM: clap_low_pass_wavelength=800
GETPARM: clap_alpha=1
GETPARM: clap_beta=0.3
GETPARM: max_topo_err=20
GETPARM: lambda=0.0554658
GETPARM: gamma_change_convergence=0.005
GETPARM: gamma_max_iterations=3
GETPARM: small_baseline_flag=‘n’
Found look angle file
PS_EST_GAMMA_QUICK: n_trial_wraps=0.252487
PS_EST_GAMMA_QUICK: Initialising random distribution…
PS_EST_GAMMA_QUICK: 455435 PS candidates to process
PS_EST_GAMMA_QUICK: iteration #1
PS_EST_GAMMA_QUICK: Calculating patch phases…
Error using zeros
Requested 60459x155072x50 (1746.3GB) array exceeds maximum array size preference. Creation of arrays greater
than this limit may take a long time and cause MATLAB to become unresponsive. See array size limit or
preference panel for more information.
Error in ps_est_gamma_quick (line 215)
ph_grid=zeros(n_i,n_j,n_ifg,‘single’);
Error in stamps (line 326)
ps_est_gamma_quick(est_gamma_parm);
while running stamps(2,2), i’m getting this above error. please give me solution.
Thank you.
PS_UNWRAP: Starting
Phase-unwrapping…
GETPARM: small_baseline_flag=‘n’
GETPARM: unwrap_patch_phase=‘n’
GETPARM: scla_deramp=‘n’
GETPARM: subtr_tropo=‘n’
GETPARM: tropo_method=‘a_l’
GETPARM: drop_ifg_index=
GETPARM: unwrap_hold_good_values=‘n’
PS_UNWRAP: Code to hold good values skipped
GETPARM: unwrap_time_win=730
GETPARM: unwrap_method=‘3D’
GETPARM: unwrap_grid_size=200
GETPARM: unwrap_gold_n_win=32
GETPARM: unwrap_prefilter_flag=‘y’
GETPARM: unwrap_gold_alpha=0.8
GETPARM: unwrap_la_error_flag=‘y’
GETPARM: unwrap_spatial_cost_func_flag=‘n’
GETPARM: max_topo_err=20
GETPARM: lambda=0.0554658
PS_UNWRAP: n_trial_wraps=0.261384
Resampling phase to grid…
Number of interferograms : 50
Number of points per ifg : 269037
Number of resampled points: 7915
Interpolating grid…
Number of unique edges in grid: 18636
Unwrapping in time-space…
Estimating look angle error (elapsed time=199s)
Using sequential daisy chain of interferograms
Smoothing in time (elapsed time=201s)
Unwrapping in space…
Processing IFG 1 of 50
Error using fread
Invalid file identifier. Use fopen to generate a valid file identifier.
Error in uw_stat_costs (line 159)
ifguw=fread(fid,[ncol,inf],‘float’);
Error in uw_3d (line 163)
uw_stat_costs(options.unwrap_method,options.variance);
Error in ps_unwrap (line 235)
[ph_uw_some,msd_some]=uw_3d(ph_w(:,unwrap_ifg_index),ps.xy,day,ifgday_ix(unwrap_ifg_index,:),ps.bperp(unwrap_ifg_index),options);
After replacing the ps_load_initial_gamma.m file in matlab folder. It is working up to stamps (5,5) without any interruption.
After finishing, the stamps(5,5). i run this below command as shown in stamps manual.
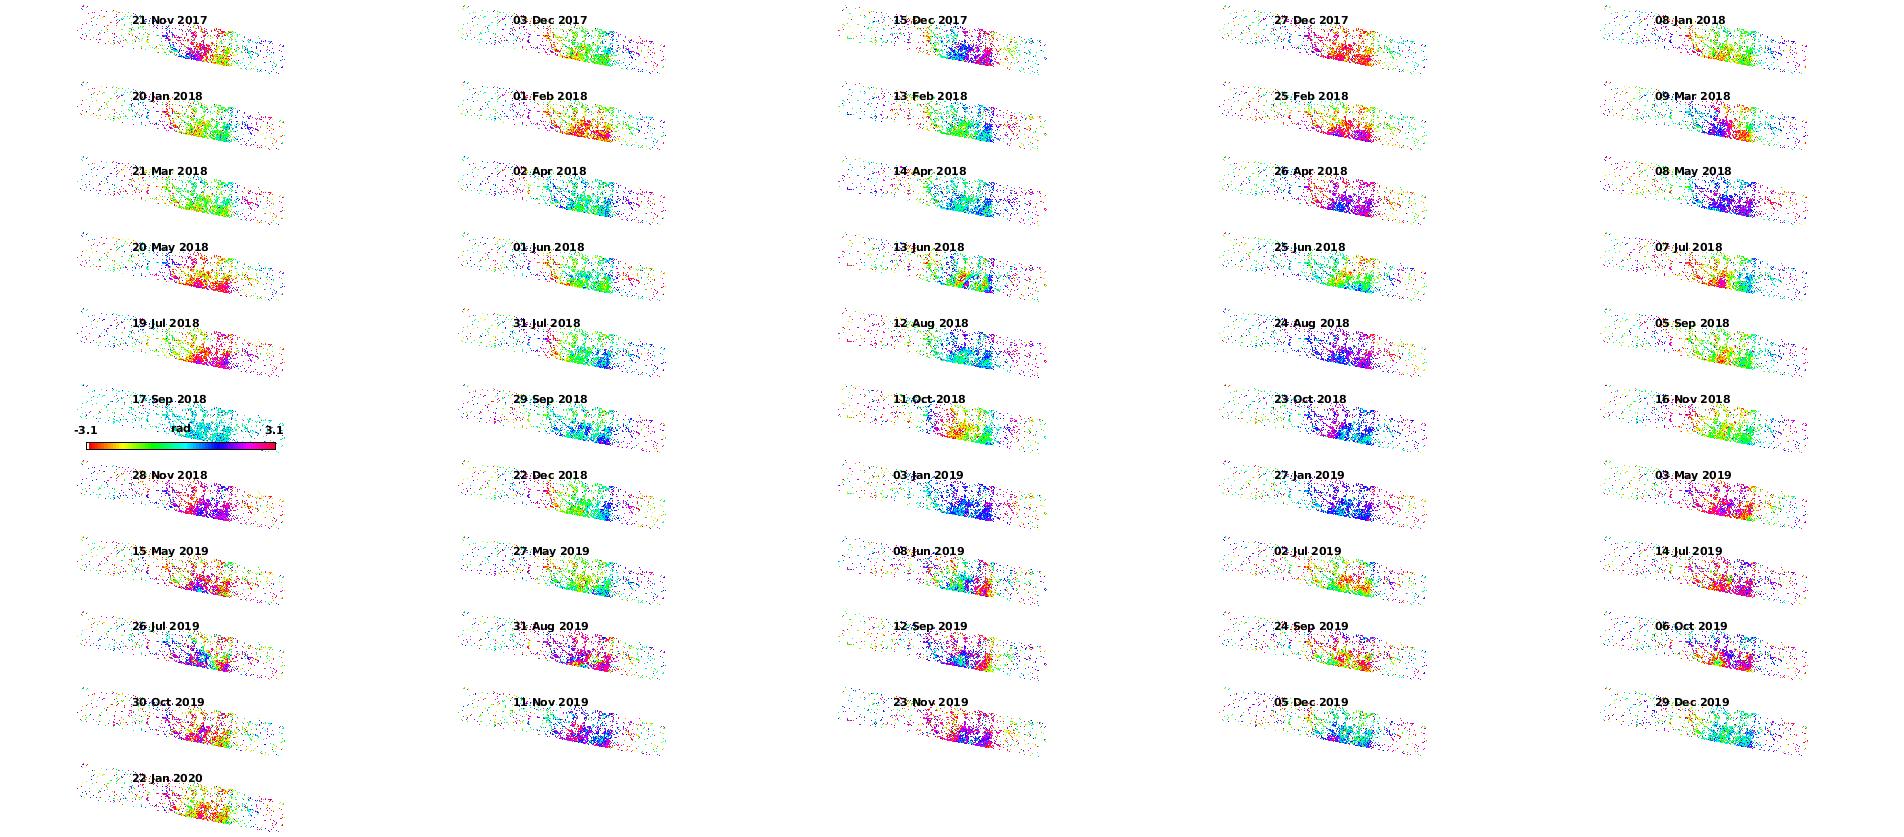
ps_plot(‘w’)
Warning: MATLAB has disabled some advanced graphics rendering features by switching to software OpenGL. For
more information, click here.
Color Range: -3.14159 to 3.14159 rad
this looks like the case here where triangle was installed but the path was not correct in the config file. After you source the config file in the shell, you should be able to get the tool parameters when you type “triangle”. Please test.