I already replaced this file long back…
sorry, I forgot about it. I’m afraid I have no solution then. Maybe it is better to directly ask in the StaMPS forum
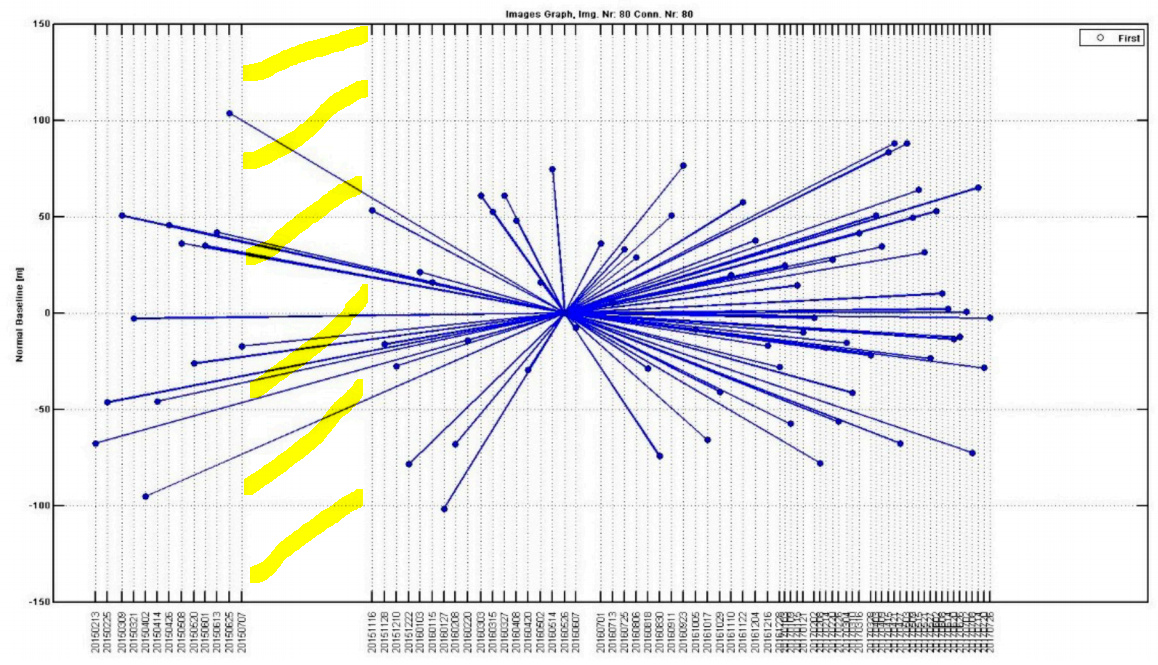
currently, this is not supported by SNAP, but you can open the InSAR Stack Overview and export the baseline information of the stack to a csv file and generate the chart outside SNAP
Thank you ABraun.
All ps_plot(‘u’) , ps_plot(‘u-d’), ps_plot(‘u-m’) and ps_plot(‘u-dm’) are running successfully. But while running this below command it is showing error, please check it once. Thank you.
ps_plot(‘v-dm’,‘ts’);
Error using ps_plot (line 1540)
unknown value type
ps_output
Writing output files…
GETPARM: small_baseline_flag=‘n’
GETPARM: ref_velocity=0
GETPARM: lambda=0.0554658
1241101 ref PS selected
Error using load
‘mean_v’ is not found in the current folder or on the MATLAB path, but exists in:
/mnt/e/subsidence/ahmedabad_stamps/6_psiexport
Change the MATLAB current folder or add its folder to the MATLAB path.
Error in ps_output (line 95)
meanv=load(meanvname);
v is the acutal velocity, so it should be calculated by the scripts. Did you proceed until stamps(8,8)?
Yes, I processed upto stamps(1,8).
ps_plot(‘v’) and ps_plot(‘v’,‘ts’) are also running properly. but while running ps_plot(‘v-dm’,‘ts’) it is giving error. Thank you
ps_plot(‘v-dm’,‘ts’);
Error using ps_plot (line 1540)
unknown value type
m is the atmospheric orbit error (AOE) of the master. If you did not remove it, you cannot include it in the plot.
I rerun the stamps(8,8) step once again, but still I’m getting the error. Please tell me the solution. Thank you.
ps_plot(‘v-dm’,‘ts’);
Error using ps_plot (line 1540)
unknown value type
ps_plot(‘v-dm’,1);
Error using ps_plot (line 1540)
unknown value type
stamps(6,6)
STAMPS: ########################################
STAMPS: ####### StaMPS/MTI Version 4.0b6 #######
STAMPS: ####### Beta version, Jun 2018 #######
STAMPS: ########################################
STAMPS: Will process current directory only
STAMPS: ########################################
STAMPS: ################ Step 6 ################
STAMPS: ########################################
STAMPS: Directory is PATCH_1
PS_UNWRAP: Starting
Phase-unwrapping…
GETPARM: small_baseline_flag=‘n’
GETPARM: unwrap_patch_phase=‘n’
GETPARM: scla_deramp=‘n’
GETPARM: subtr_tropo=‘n’
GETPARM: tropo_method=‘a_l’
GETPARM: drop_ifg_index=
GETPARM: unwrap_hold_good_values=‘n’
PS_UNWRAP: Code to hold good values skipped
subtracting scla and master aoe…
GETPARM: unwrap_time_win=730
GETPARM: unwrap_method=‘3D’
GETPARM: unwrap_grid_size=200
GETPARM: unwrap_gold_n_win=32
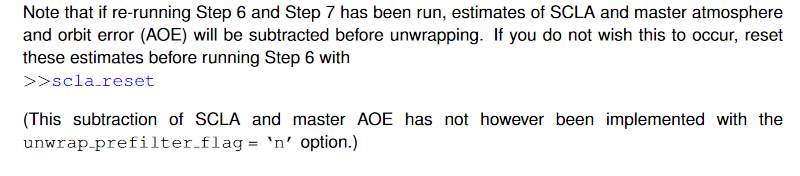
GETPARM: unwrap_prefilter_flag='y’
GETPARM: unwrap_gold_alpha=0.8
GETPARM: unwrap_la_error_flag=‘y’
GETPARM: unwrap_spatial_cost_func_flag=‘n’
GETPARM: max_topo_err=20
GETPARM: lambda=0.0554658
PS_UNWRAP: n_trial_wraps=0.256749
Resampling phase to grid…
Number of interferograms : 52
Number of points per ifg : 1241101
Number of resampled points: 52911
GETPARM: unwrap_prefilter_flag='y’
In my case it is “y” so the subtraction of SCLA and master AOE is possible. Is it correct?
I think you can proceed without the m flag then, yes.
I didn’t get your point?
just plot “v-d” (or “v-do”), not “v-dm”
ps_plot(‘v-d’) is running properly.
I have a doubt,
Is it mandatory to remove phase ramp (d) ?
all of the flags are optional, you can combine them however you want.
I run ps_plot(‘v-do’,‘ts’) it is working fine.
How to convert this LOS values to Vertical displacement in this Stamps?
Because I want to compare these Vertical results with GPS Vertical results.
Thank you.
currently, there is no conversion implemented. Usually, you need results of two time-series (ascending and descending) to derive vertical displacement.
An example is given in the study of @mdelgado: https://www.mdpi.com/2072-4292/11/2/129
Here all the data set(52 SAR images) is in descending.