Could you please send me your e-mail address?
It’s geometrically not possible to estimate the vertical component based on the LOS displacement alone.
Feel free to ask questions in here, I’m not a private teacher 
Dear ABraun,
I want to plot high coherence values only, which parameter i have to change in below command.
PS is already limited to high coherence by definition. You can only control the amount of noisy pixels in step 3 and 4.
1 Like
For creation of CSV file in matlab I’m getting this error, please check it once.
load ps_plot_v-do.mat;
lon2_str = cellstr(num2str(lon2));
lat2_str = cellstr(num2str(lat2));
lonlat2_str = strcat(lon2_str, lat2_str);
lonlat_str = strcat(cellstr(num2str(lonlat(:,1))), cellstr(num2str(lonlat(:,2))));
ind = ismember(lonlat_str, lonlat2_str);
disp = ph_disp(ind);
disp_ts = ph_mm(ind,:);
export_res = [lon2 lat2 disp disp_ts];
Error using horzcat
Dimensions of arrays being concatenated are not consistent.
please use the search function, you find a proposed solution here:
1 Like
what is the minimum size of a subset that can be used?
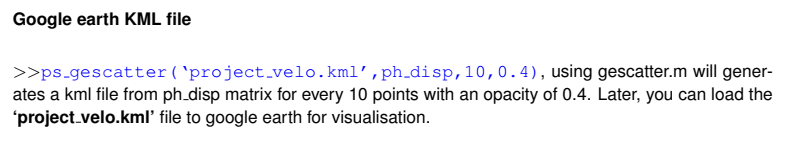
I see some processing artefacts which are probably caused by atmospheric noise or low coherence, but in general it looks good (except for the separeated yellow area in the south).
Is the pattern feasible?
1 Like
Hi,
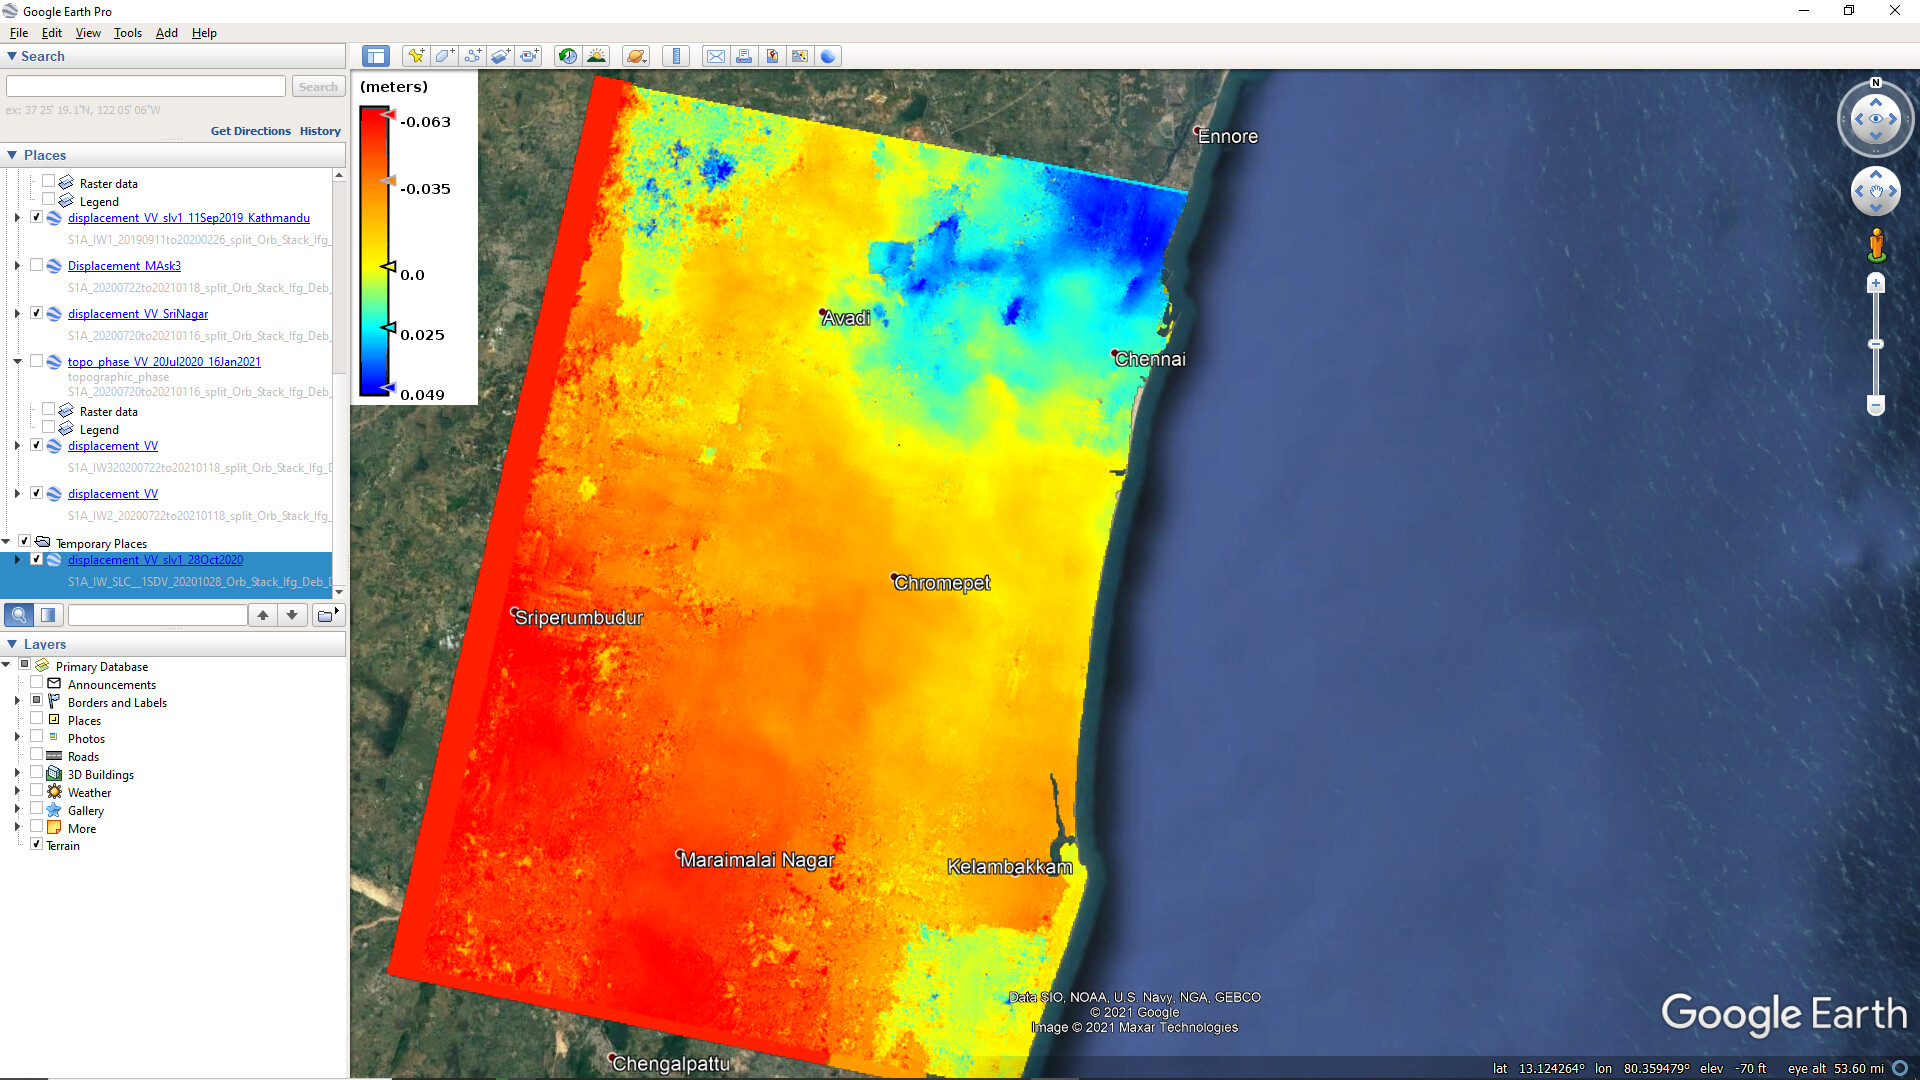
I have processed two image pairs having temporal resolution of 4 months and 6 years for the same area and I am getting this result. Please have a look.
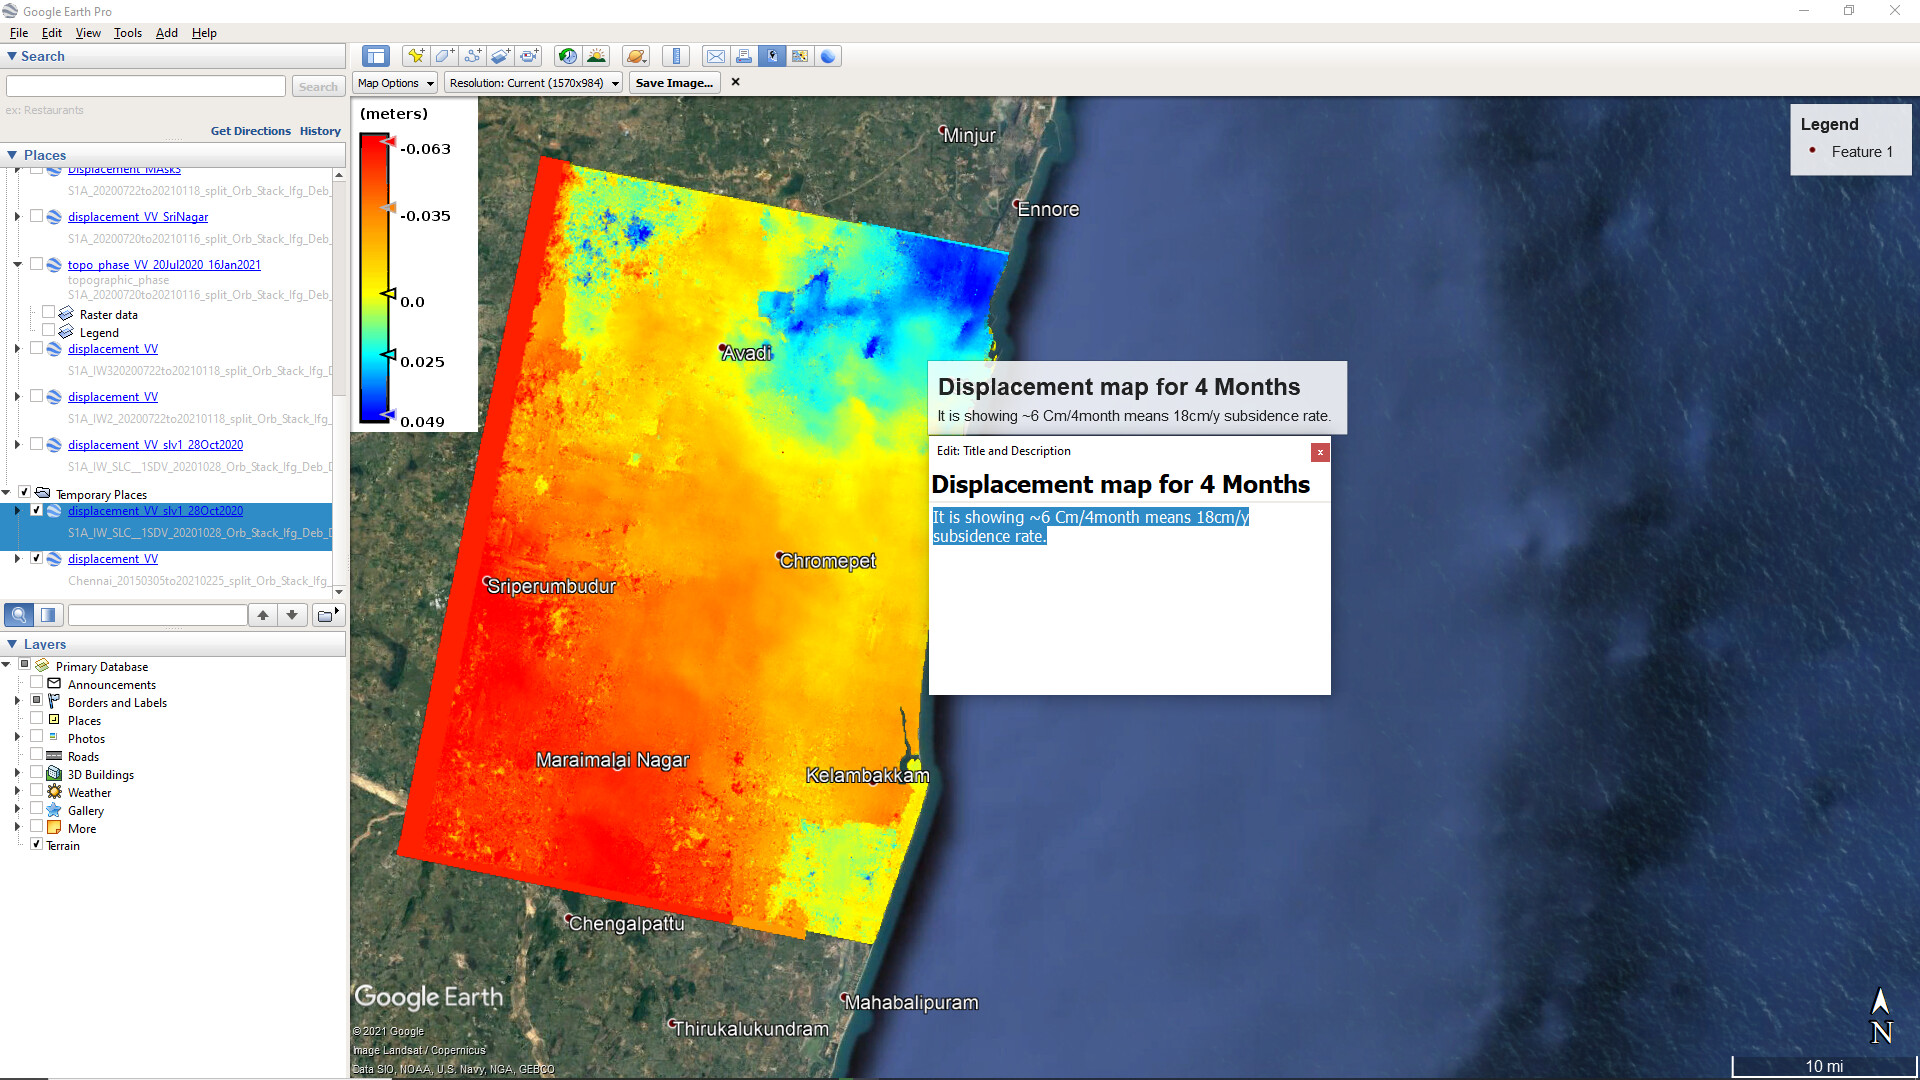
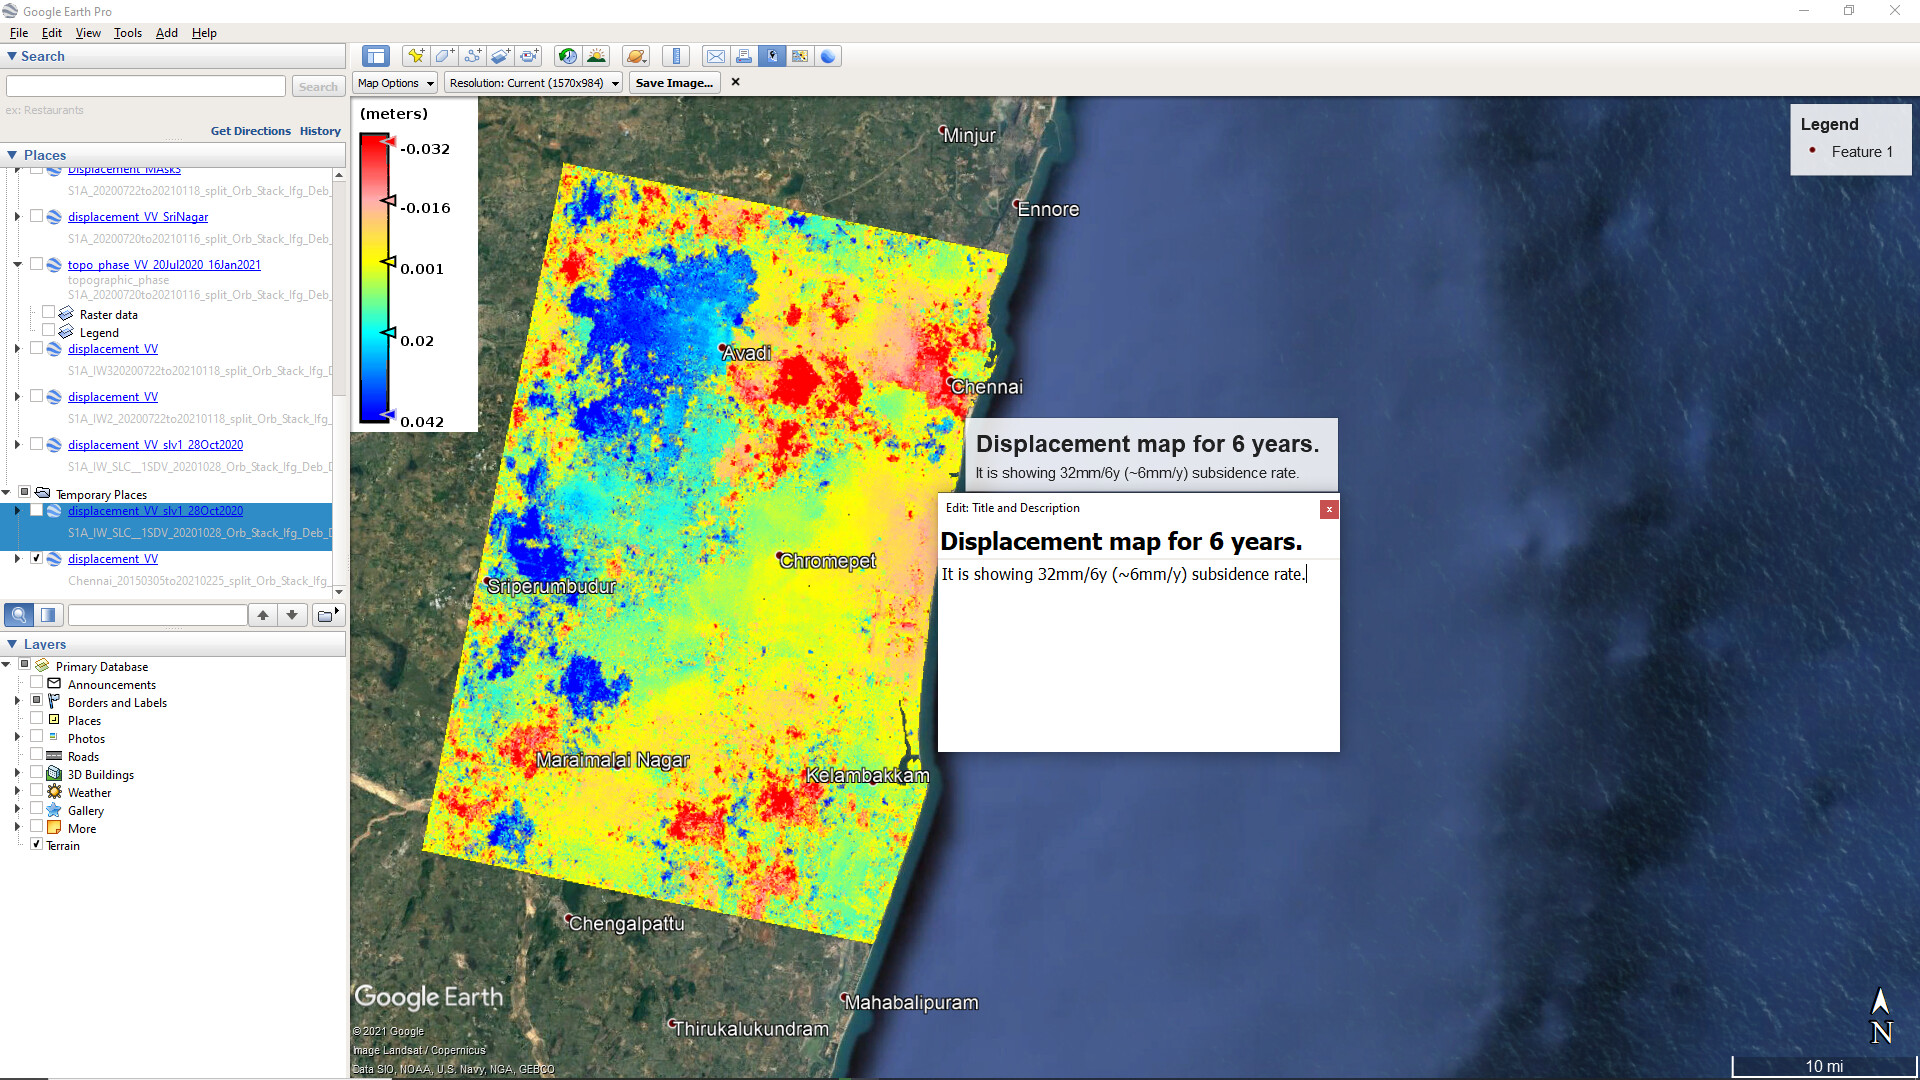
What might be the reason for so much variation in the subsidence result?
6 years is too long. Much of signal is decorrelated.
Although, some of the subsidence might be larger than detectable by Sentinel-1 because of the long time span. The best results are retrieved with short temporal baselines with dry weather conditions and minimized vegetation cover.
Please always have a look at the interferograms before proceeding. If they are of bad quality it makes no sense to continue the processing even if the steps are technically correct.
What are the basic parameters of good quality interferograms? I observed mean of the coherence (max) at 0.12.
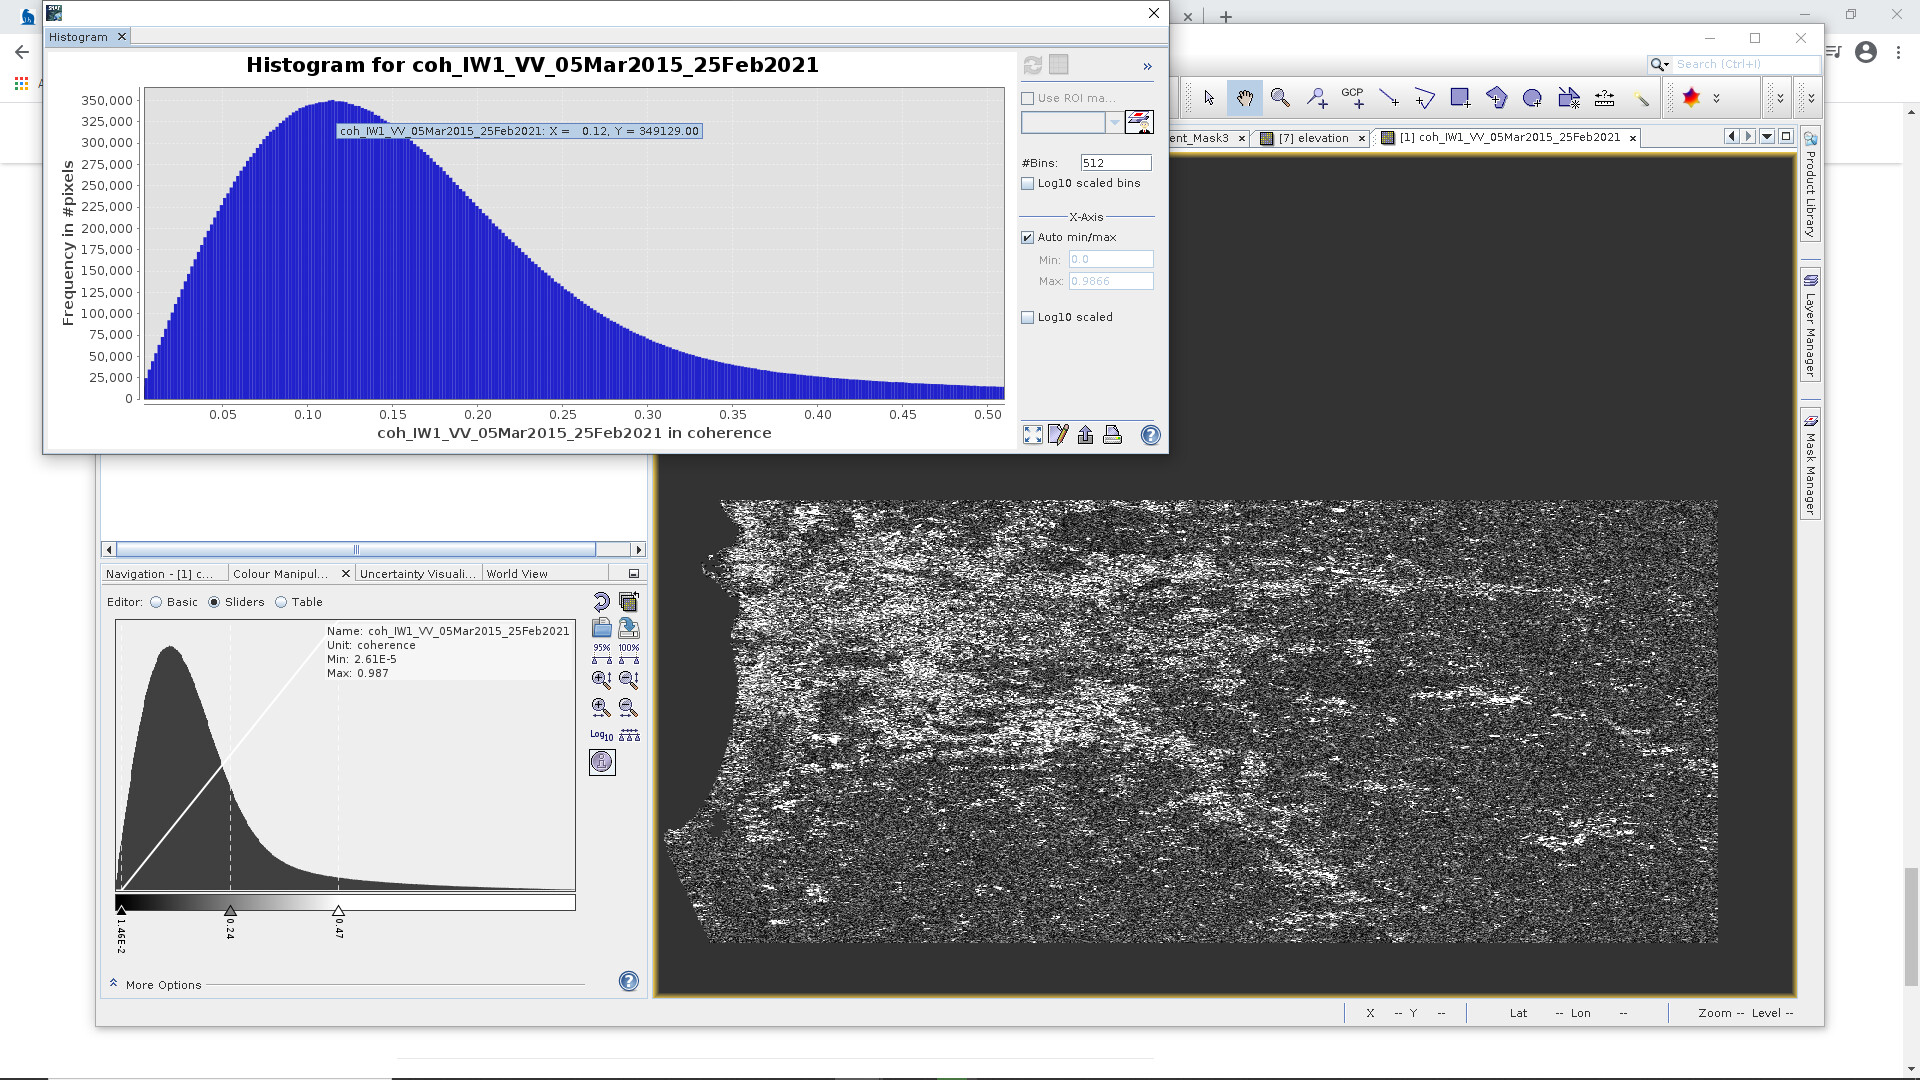
Please have a look at these materials: InSAR Principles: Guidelines for SAR Interferometry Processing and Interpretation (ESA TM-19)
Echoes in Space - InSAR basics
Echoes in Space - Introduction to SAR interferometry
Echoes in Space - InSAR error sources
2 Likes
Hi ABraun. Now I can only ps_plot(‘v’) but can’t ps_plot(‘v’,‘ts’), which said can’t find scla2. Can you tell me how to fix it out?
I think this is not the correct topic for this. Please raise your question in the StaMPS category of this forum and provide some information on your data and the processing.
Hello I am working on SNAP could somebody guide me about my two questions.
- After finding vertical displacement, how to derive average velocity for each differential interferogram
- how to derive the average rate of land subsidence using the stacking method
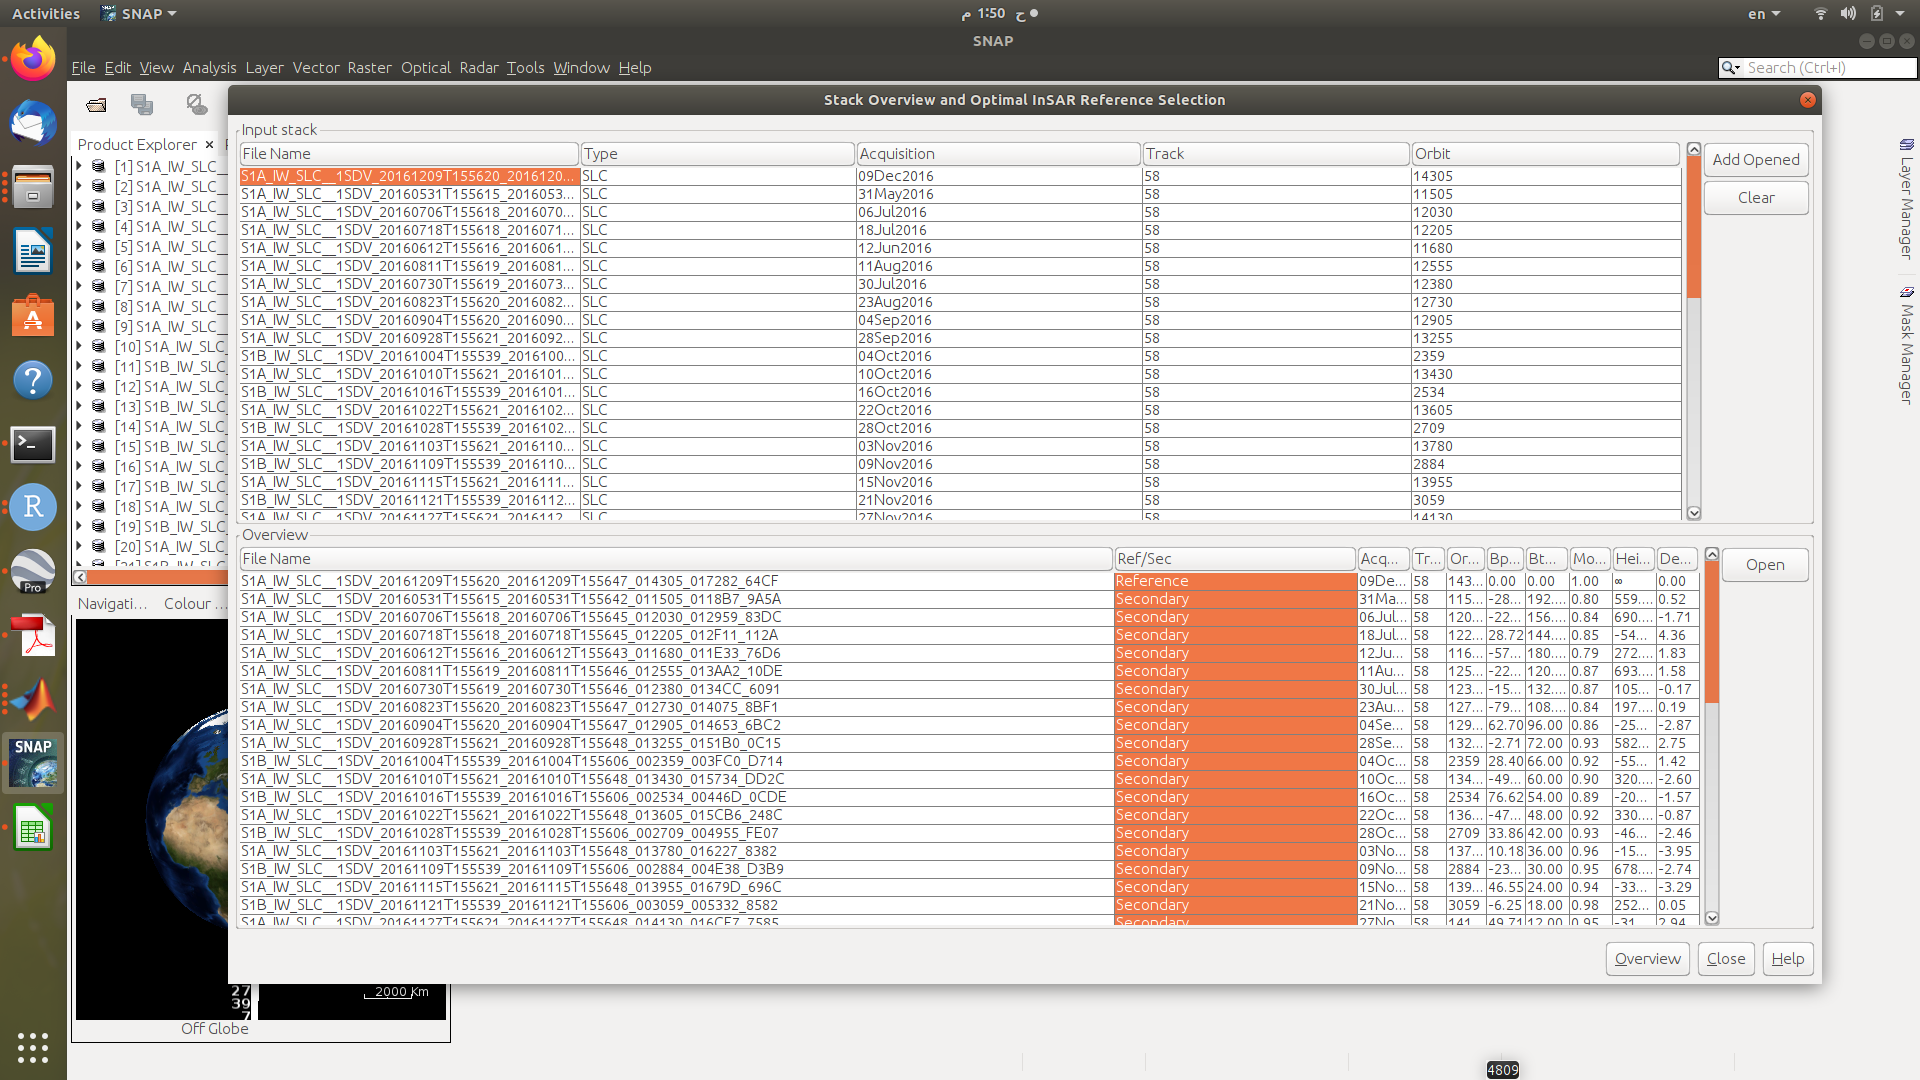
have you seen this? Export stack information
Yes, sir I have. The only extension available to export from this method is txt
the file structure should be identical though. Or you export it as a txt and simply rename it to csv.