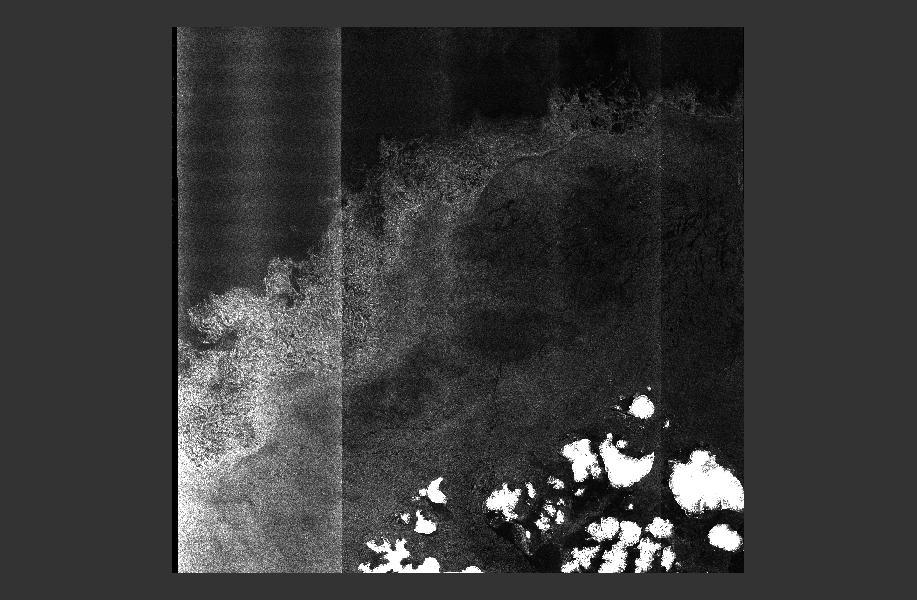
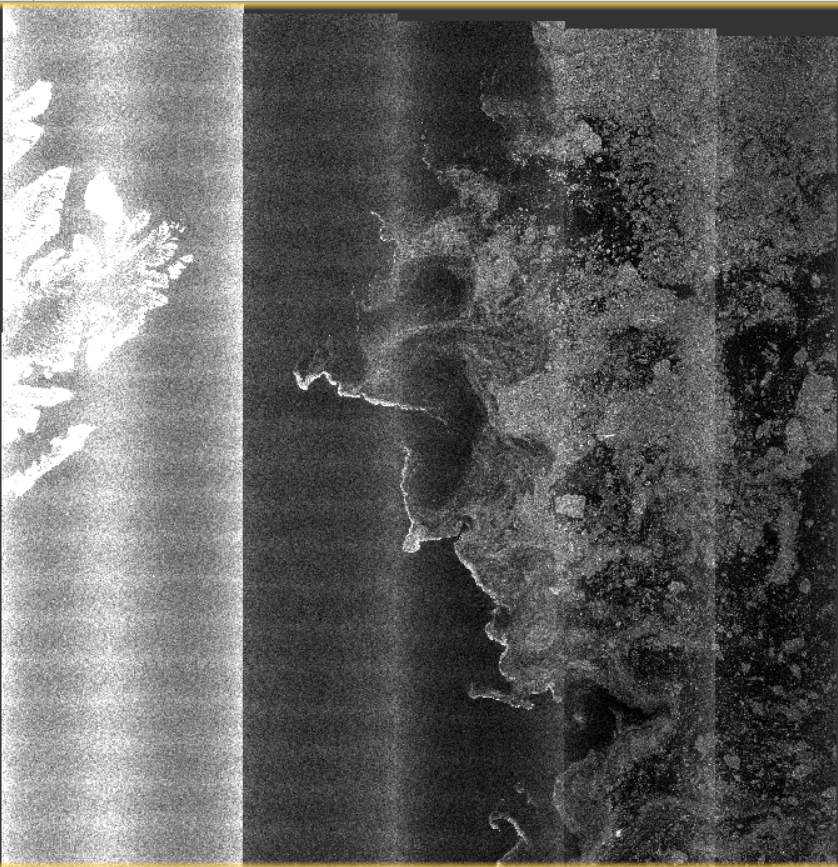
Hello! Please help me to understand how to remove this vertical stripes on Sentinel-1 image. As I understand this is task of radiometric calibration. There are function in SNAP, i know, but it’s not work because error:confused:
Any information regarding the date of acquisition and polarization? Is it a GRD product?
S1A scenes coming for the early phase of the mission (processed by early version of the SAR processor) may have some radiometric issues. The calibration performed within the toolbox is based on the information provided in the product.
1 Like
this is the name of product:
S1A_EW_GRDM_1SDH_20160120T125213_20160120T125313_009578_00DEEA_40A2
when I try to calibrate it within toolbox I recieve this error:
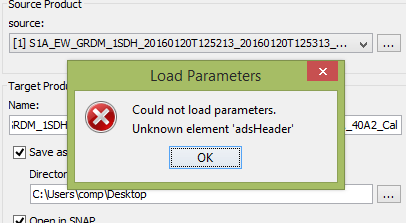
I don’t get this error when applying calibration. Are you using the latest SNAP version?
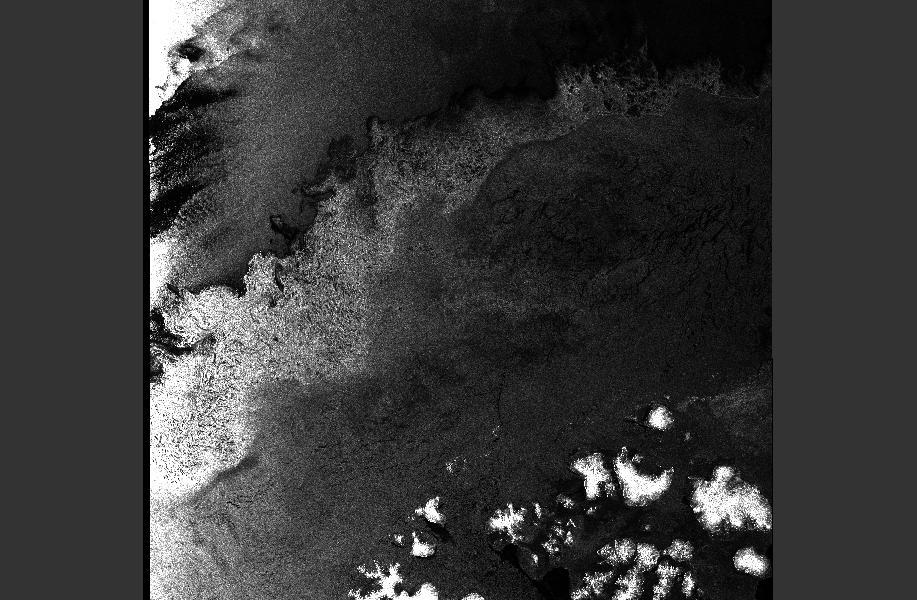
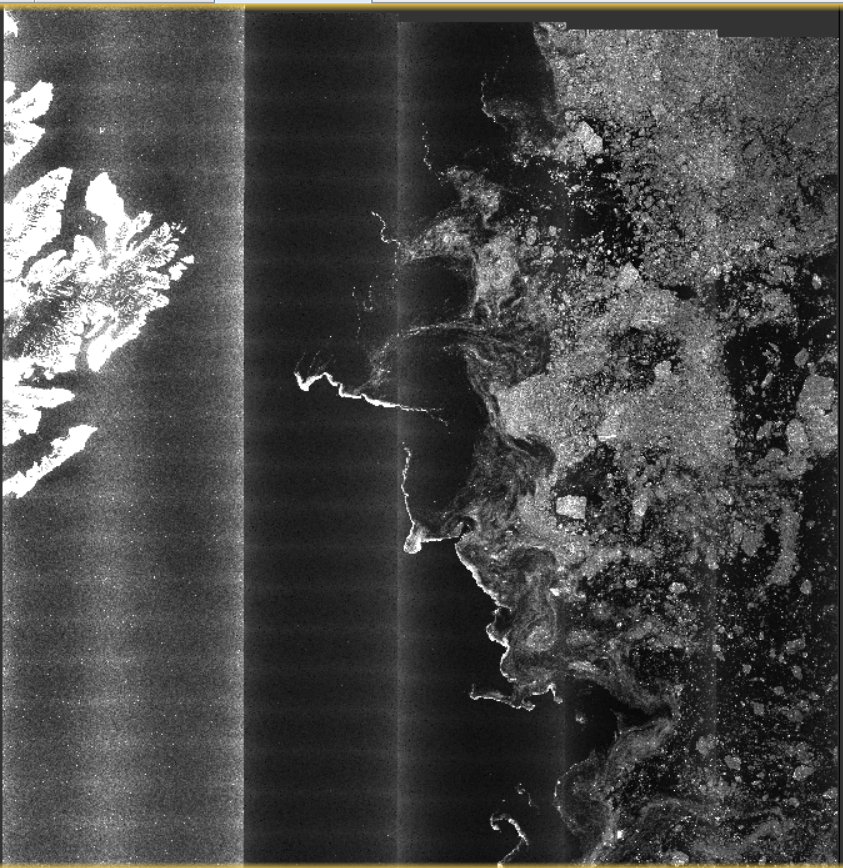
You can reduce the vertical stripes by first applying S1 Remove Thermal Noise and the Calibrate. Note that the thermal noise removal is intended for data over land. Over the ocean where it’s close to the noise floor, it may not help as much.

2 Likes
lveci, OK! Thanks! For HV polarisation it works great. I got a similar result. But there are another thing that I want to do. In HH polarisation intensity increasing from right border to left. It depends of incidence angle as I know. Can you help me to solve this problem?
You should calibrate the product (Radar–>Radiometric–>Calibrate).
Do you have any recommendations on dealing with the vertical stripes over the ocean?
I saw this ftp://ftp.nersc.no/pub/Anton/Sentinel1A_classification_EGU2015_korosov.pdf which uses average values of images over calm water, but I don’t know how to do it.
I’m studying sea ice so that I need to deal with this problem in calibration.
Thanks
Have you solved the hv vertical stripes over the sea ice zone?
I encounter a question about radiometric calibration. Sentinel-1A data with VV and VH polarization for IW products, the radiometric calibration of VH polarization is right, but the VV polarization is incorrect using the SNAP processing.
I never encountered that. No idea what it is
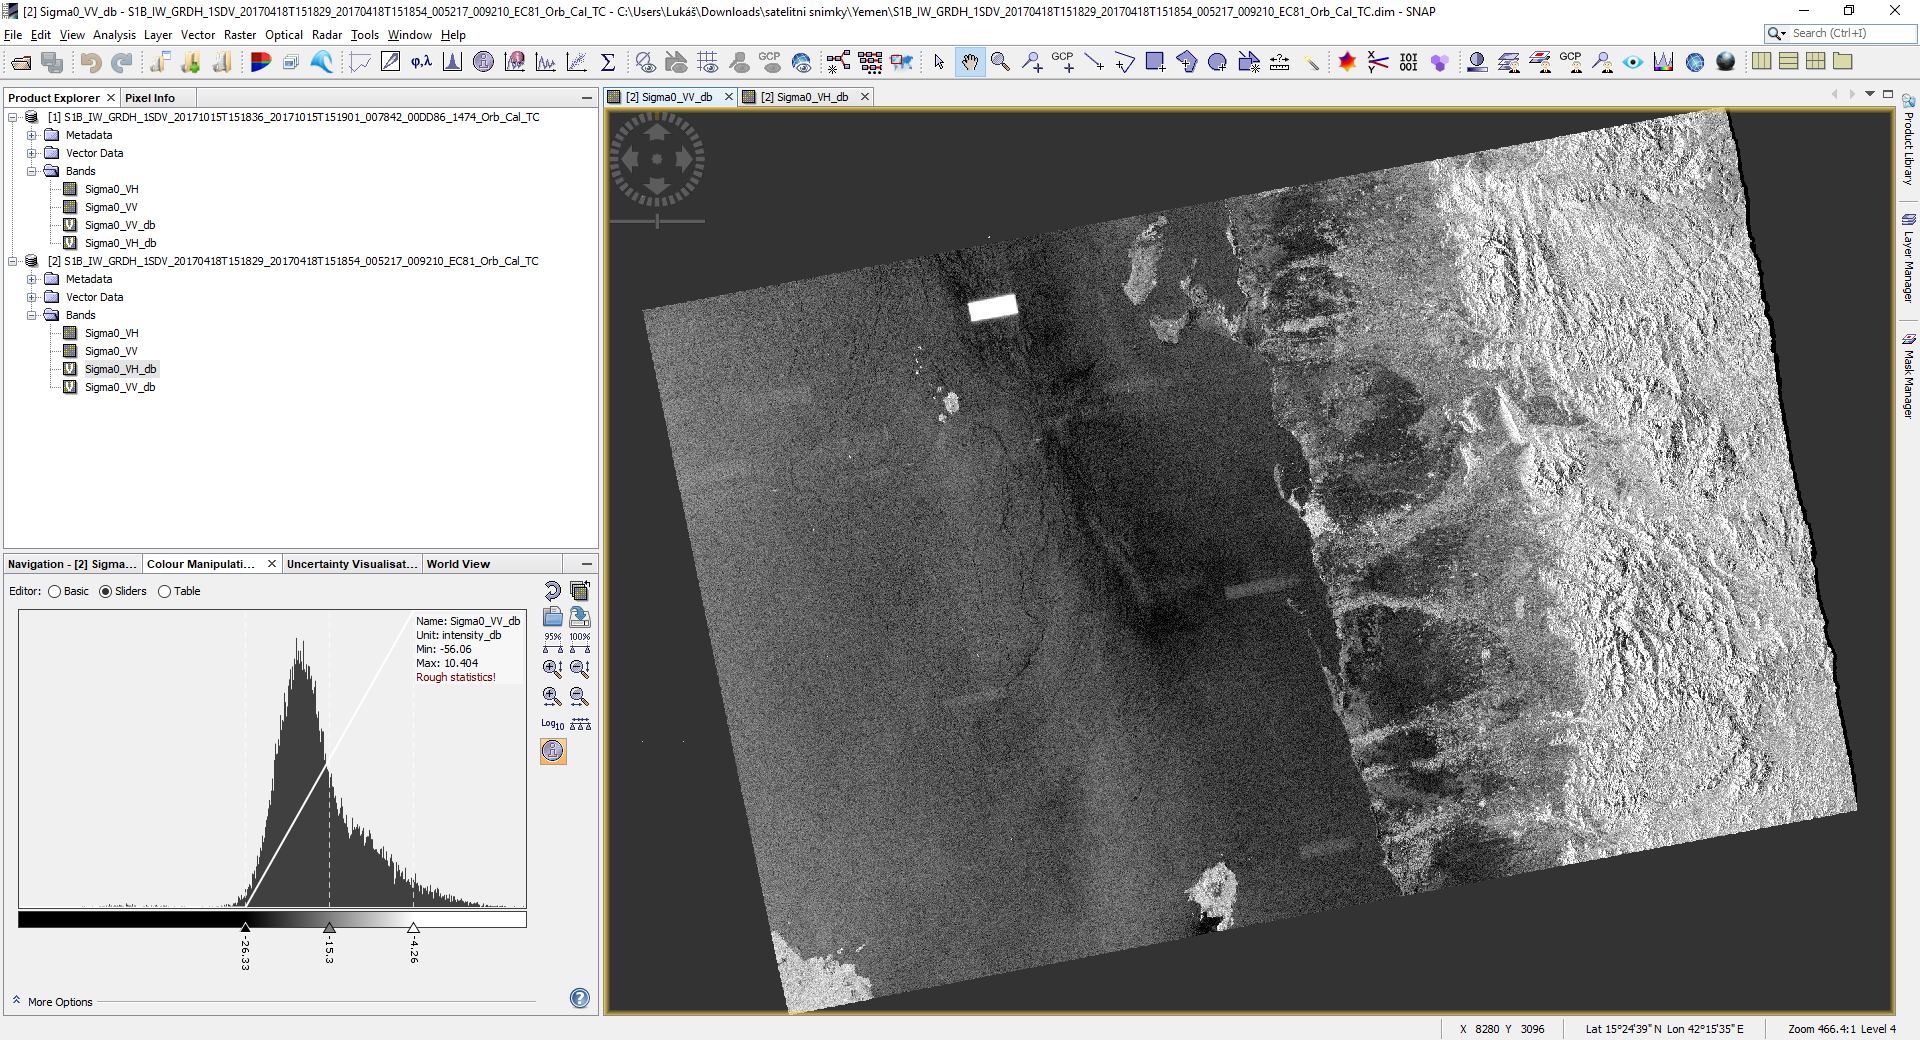
The rectangular shapes are Radio-Frequency Interference (RFI) from transmitters on the ground.
Is It caused by army objects? This scene is from Yemen - port of Hodeidah. Looking for difference before siege and during the siege…
Further RFI examples can be seen in Sections 4.2.11 and 6.2.9 of the S1 Annual Performance report for 2016 - see Radiometric calibration problem.
1 Like
its bit of a long shot , a little convoluted but it will be possible and fun to identify RFI areas using a bit of machine learning - any one got the capacity to do this in real-time for entire S1 catalogue?  https://www.arcgis.com/apps/MapJournal/index.html?appid=dfc6873c8a604daa8912609bf846859d
1 Like
Hi kirill.s. Can you tell me the specific process to solve this problem?
Please give us more information on your product and your data processing and what exactly your problem is about.
This is the name of my product:S1A_EW_GRDM_1SDH_20180719T072036_20180719T072140_022860_027A98_C108.
My question is how to effectively remove the vertical stripes, like the kirill.s’ s image. I’ve tried this method: thermal noise removal->speckle filtering->radiometric calibration. But it didn’t work out so well.
There are results.Can you help me with this problem, please?
I think this comment describes your only options. EW data has its downsides.
1 Like
Ok, thank you. I do use the ocean and sea ice data. But I once read a paper on the removal of thermal noise with good results based on EV data. Whether on the ocean or on land.
Thank you again, I will continue to explore this issue.