I wanted to create some visual time series of a small region. So i took Products L2A of this Region from every second month in 2019. I create with GPT ( Polygon < Resample < Subset) jpg. Afterwards i wanted to create some GIF or Animation in Photoshop and noticed that some Products are made in a different angle (2%). and also spacial different (marked down below with “(< — HERE)”.
S2A_MSIL2A_20190216T102111_N0211_R065_T33UUU_20190216T130428
S2B_MSIL2A_20190402T102029_N0211_R065_T33UUU_20190402T135010
S2A_MSIL2A_20190603T101031_N0212_R022_T32UQD_20190603T114652   < --- HERE
S2A_MSIL2A_20190825T102031_N0213_R065_T32UQD_20190825T134836   < --- HERE
S2A_MSIL2A_20190911T101021_N0213_R022_T33UUU_20190911T143947
S2A_MSIL2A_20191210T101411_N0213_R022_T33UUU_20191210T114322
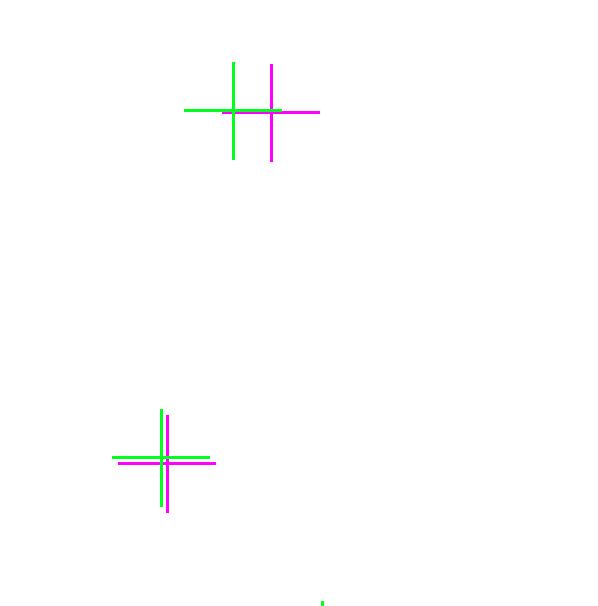
To check the deviation i place two point in two exemplary Products.In Photoshop i put some bigger crosses on top (more visible) to demonstrate the shift .
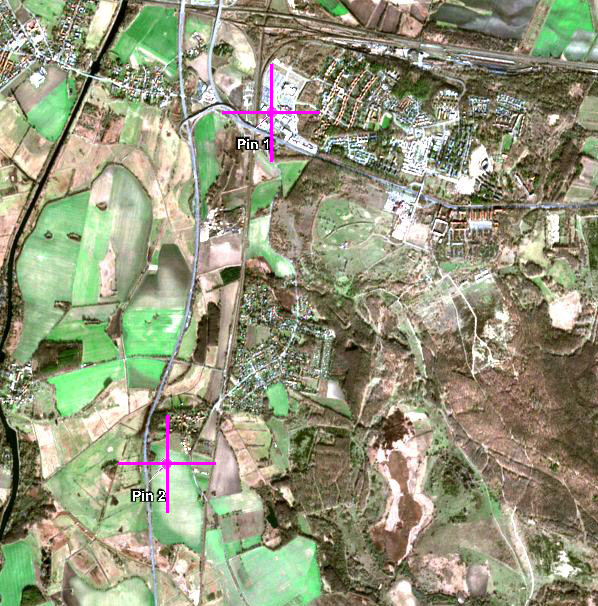
Subset from S2A_MSIL2A_20190216T102111_N0211_R065_T33UUU_20190216T130428
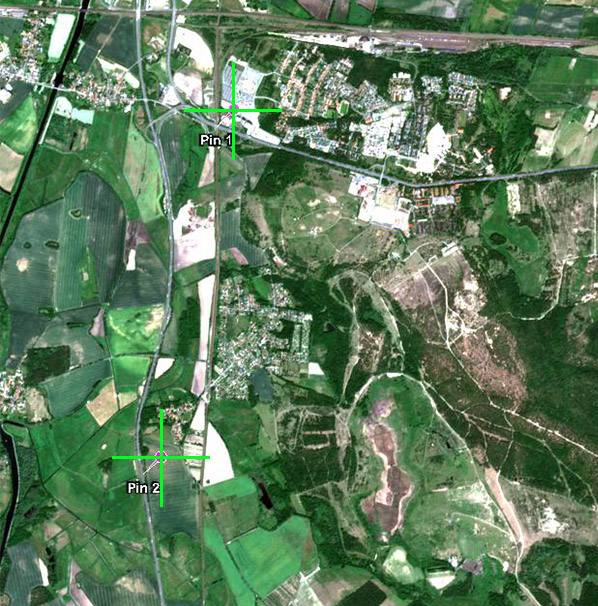
Subset S2A_MSIL2A_20190603T101031_N0212_R022_T32UQD_20190603T114652
Both layers on top
Question
It seems its only to appear in the mid of year So i ask myself if this is maybe some Sentinel 2 (space orbita)l Issue ? Is there a way to correct such shifts?.