Let me ask you beforehand, Does the P01-P20 represents the selected points? Or Do they represent the coherence of each the whole processed stacked pair?
In general, yes it is reasonable, it reflects the de-correlation of your AOI, which leads to decrease the coherence with time,
I think the threshold of coherence could be coherence >= 0.4 means the 0.4 is included, it’s also depends on the technique you’d like to implement of InSAR for instance PSI, SBAS, et.al,
For this please take a look at the previous post,
I think this is not supported by SNAP at the moment if you mean VV-VH in case this is what you’re looking for. …
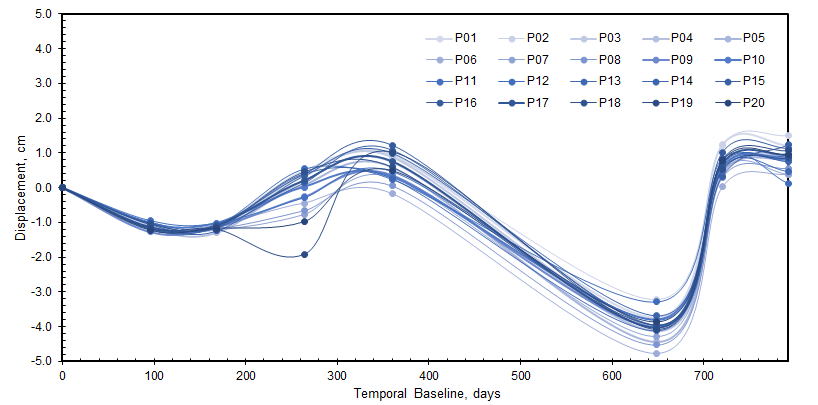
P01-P20 were selected points in my AOI. I’ve selected these points or pixels that showed high coherence (0.50 and above) from my previous set of images (from another path with same frames and polarization which is VV). But I was surprised when I used another set of images and analysis schedule. I did coherence mask and those points (almost all) were gone for temporal baseline greater than 96 days. But of course, I’ve managed to get the coherence values less than 0.50 as well as the corresponding displacement of these selected pixels. Below is my displacement vs temporal baseline summary. Zero (0) baseline is my single master image. I just do not know yet if this graph is ‘interpretable’.
I see. So mine is high in this case. I’ve read some papers and the lowest limitation of coherence I saw was 0.10. I think this is very low and will not give reliable results.
In general as I mentioned before these results are reasonable, but according to statistics method the neutrality should be taken in account in order to selecting samples, the best way of that is the random selections (of course there are many methods for sample selecting) But in your case here you decided to select the coherence > 0.5 , ,
I’d suggest to you to compare the coherence of the whole interfereograms, in that case when you’ll get similar to the results you got, this will promote your work.
Would you please to add up the reference in here, But basically the <=0.35 is not coherent, I think in case you mentioned, the researchers tried up to retrieve the coherence as much as they could. Furthermore because of the low coh. in their AOI, But please add up the reference in here.
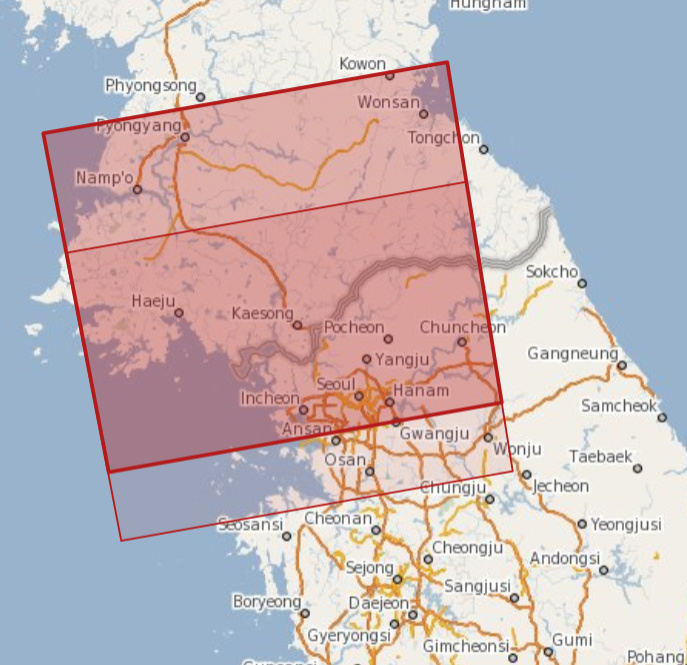
I have acquired 17 images between 2014-10 and 2016-12, Path 127, Frame 120, VV, Ascending Orbit.
I also have acquired 6 images between 2015-11 and 2016-04, Path 127, Frame 119, VV, Ascending Orbit. These 6 images actually fill the big gap that I have between 2014-10 and 2016-12.
I also have acquired 1 image on 2016-07 which also is in the gap also, Path 127, Frame 117, VV+VH, Ascending Orbit.
I will try to stack two images from different frames and see how if it works. Or would you tell me already if it will work?
I will not try stacking images with different polarizations.
I see. Thank you so much! You and especially @falahfakhri are very patient in responding to my queries. Thank you so much. I really appreciate your help.
As I explained to you, it is not possible to process different frames images, because it is not possible to get the identical bursts of AOI form both within the same sub-swath,
hi team,
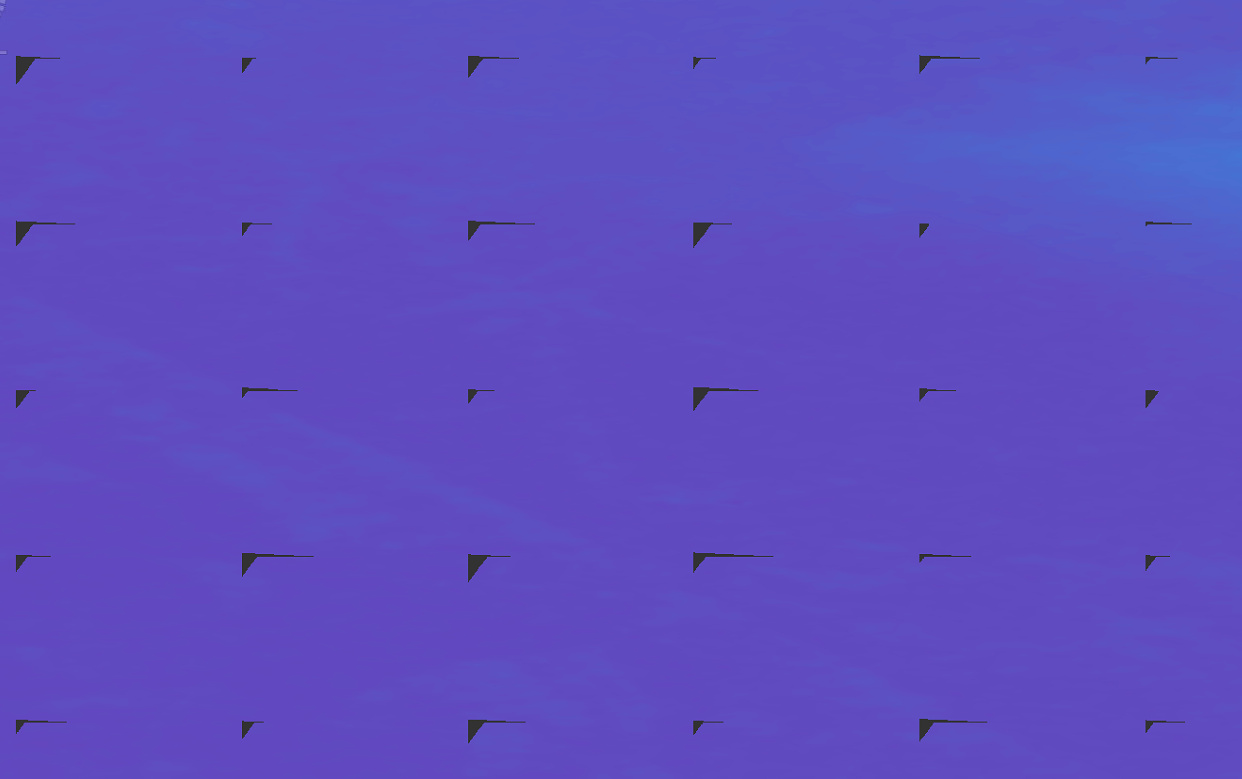
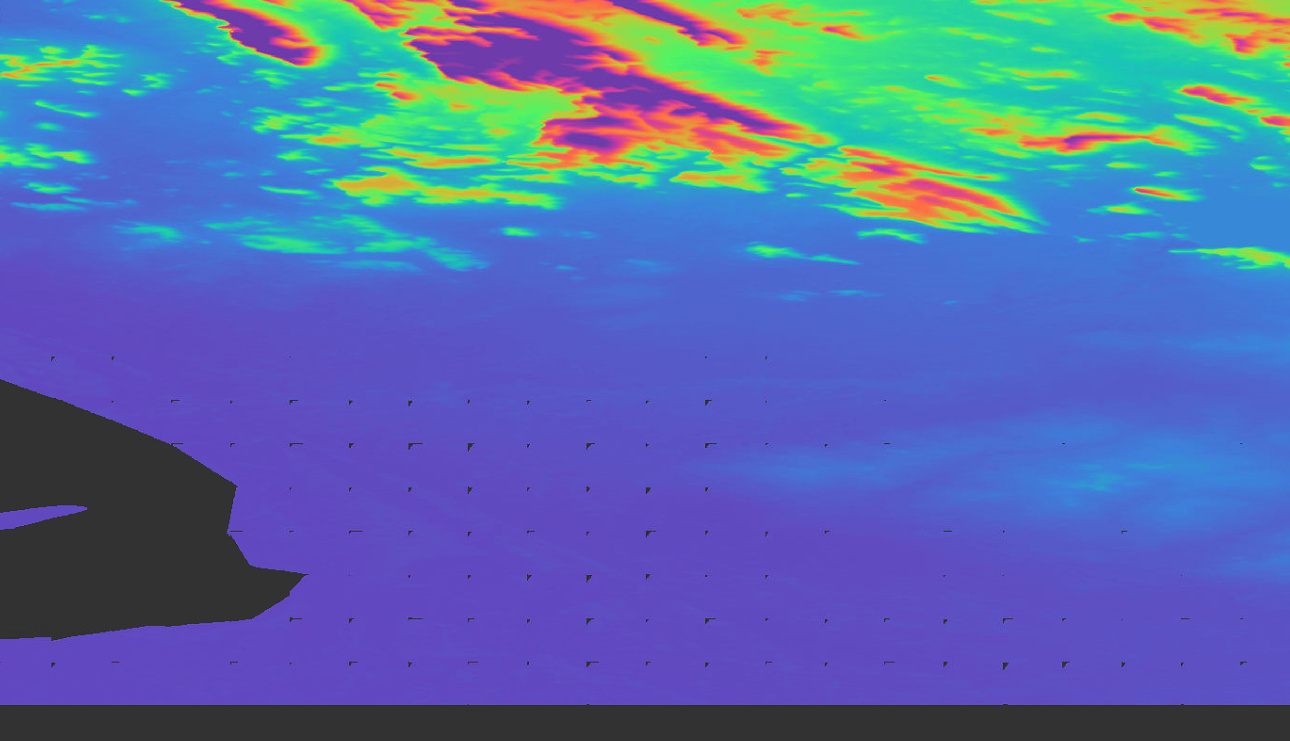
I’m trying to do land displacement analysis, by following the steps as discussed above while doing the topographic phase removal the output is having the some NaN values like below images
Thank you! I did use the formula given as shown in the two posts. I just want to confirm if vertical measurements are always larger than LOS measurements?
Also, can I use some kind of scripting in SNAP to get the pixel information instead of using some drawing tools?