So, it is normal to get somewhat larger vertical measurements (VD) than the LOS measurements. In my case (using the given equation), I have a maximum difference of about 1cm (VD > LOS). I thought before that LOS measurements will always be larger than VD measurements.
I am measuring a longitudinal surface displacement of a road. I have used the cursor to move around the area to get the pixel information as well as using the line drawing tool. I did it several times for a number of pairs (14). I have the results already. They looked okay actually. But my supervisor, asked me if instead of doing this several times, if I can use a written script (say in Python) to get the pixel information along the line of pixels (road line) I am interested in. For example, in QGIS, I can call Python to do some tasks for me as long as I have a script.
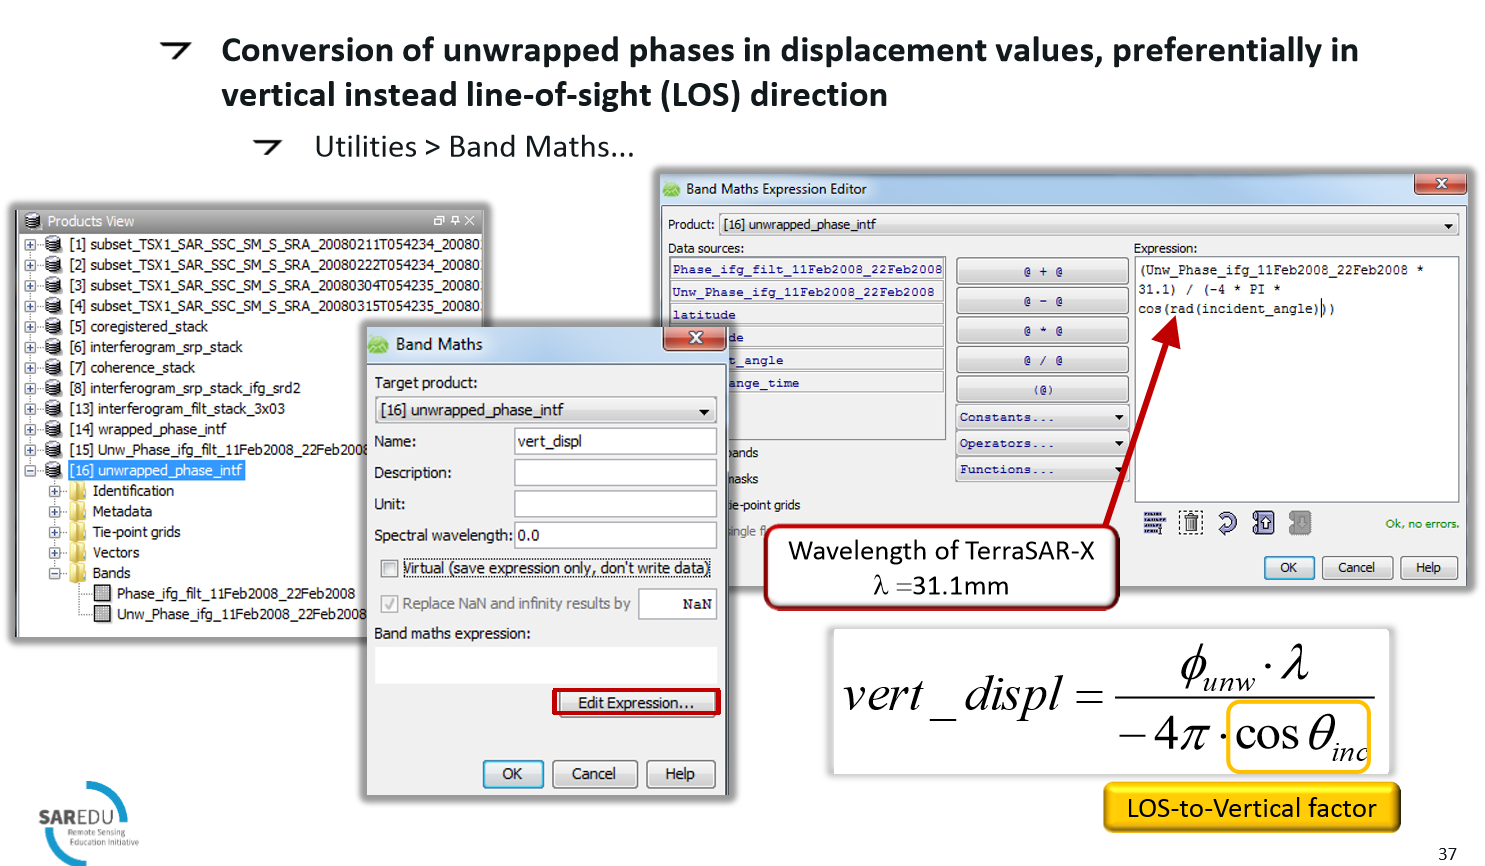
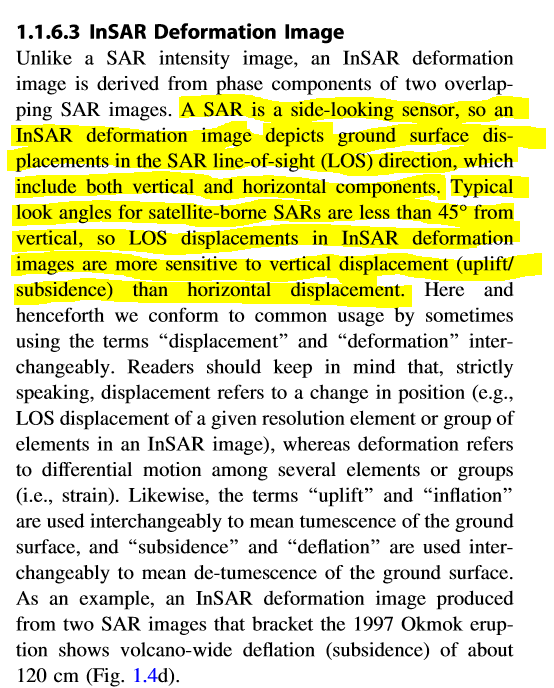
Since SAR sensors are side-looking, it is the vector sum of both the vertical and horizontal components along the line of sight (LOS) that can be measured, creating some ambiguity in separating the two elements.
A displacement in the vertical direction will induce a displacement SMALLER when projected in the LOS direction. However a LOS displacement cannot guaranty that the displacement in indeed vertical.
I can take a example. In glaciology, when studying ice-sheet displacement, the ice-flow mostly follows the topography, which is very flat in some regions. You can observe by DInSAR a displacement. however, you know that this displacement in the LOS direction is due to horizontal movement instead of vertical.
Yes, using pins is another option. I didn’t answer my supervisor yet, but I think he will push me using script to extract the pixel information even if I am used to the drawings tools already.
One more thing, which do you recommend to report?
the pixel information taken from exporting the mask pixels, or
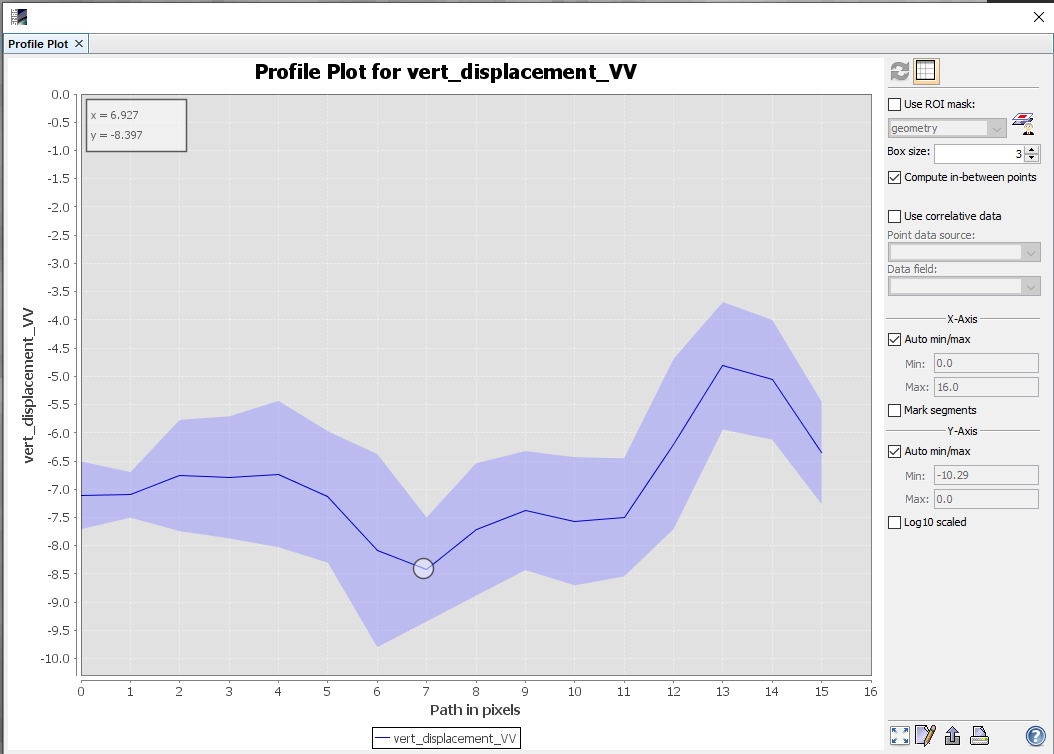
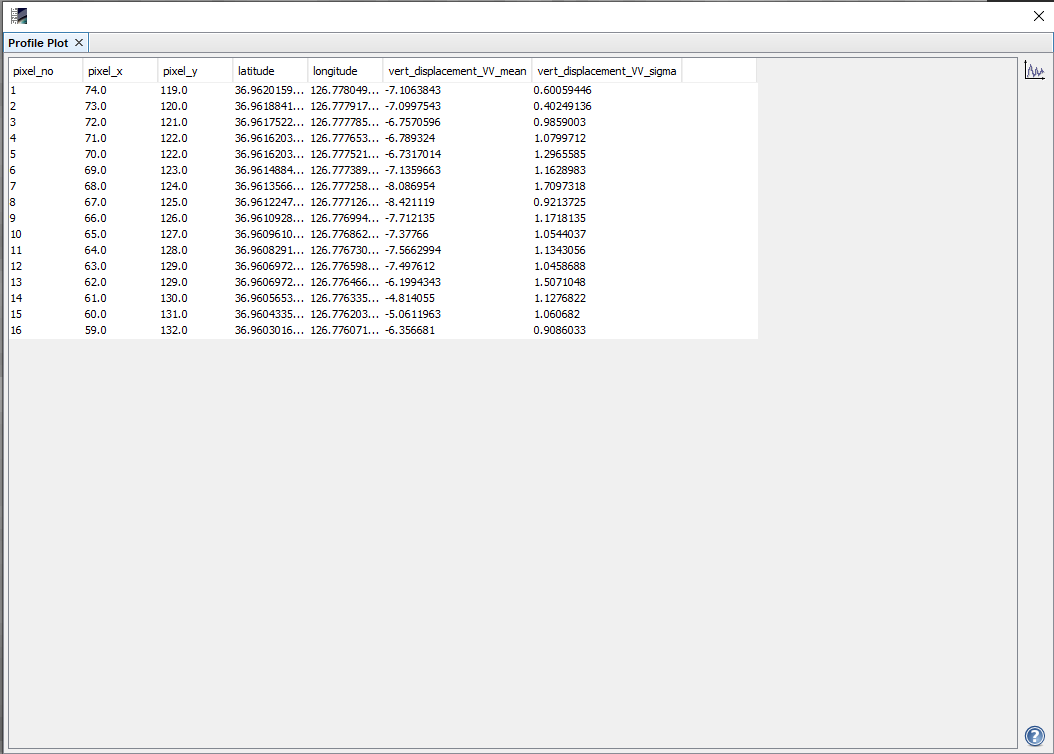
the pixel information taken from ‘Analysis --> Profile Plot’. I copied and pasted in excel the ‘mean’ values from the tabulated results.
I do get different values of displacements from the two extractions. But not that much.
I think the blue region shows the upper and lower limits (computed by sigma method?) and the dark blue line is the mean value. My band is named: vert_displacement_VV. Then I do get (not my own) the last two columns with _mean and _sigma.
When I move the cursor to the pixels of my interest, and compare the values from those extracted using the line drawing tool (in .txt), there’s no difference.
Vertical displacement mean, is the average of the disp. of all the corresponding dates of the selected point, while sigma, refers to the standard deviation of the assessed disp.,
I see. Thank you for this information. I will revisit each pair I have.
I also would like to ask the following:
Say I have an area that doesn’t move vertically up nor down, meaning zero surface displacement at any time instant as supported by field measurements. Is it possible that when I do DInSAR, I will get non-zero displacements?
This depends on many factors,
What kind of area is it? ,
What kind of objects cover this area? ,
Is the processing 100% right?
Are the atmospheric’s effect excluded 100%?,
Dose the topographic phase is still related to the Perpendicular Baseline (PB) ?
Is the unwrapped step done correctly?
I am covering a road line, about 280m long, that is about 600m away from my main AOI, which is a road also suspected to have longitudinal surface displacement due to a tunneling activity. These 2 roads are parallel with one another.
For the processing, I think I did it correctly.
S1 TOPS Coregistration with ESD (includes S1 TOPS-Split and Apply-Orbit-File)
Interferogram Formation
S1 TOPS-Deburst
Subset
TopoPhase Removal
Mutlilooking
Goldstein Phase Filtering
Phase Unwrapping (SNAPHU Export and Import)
Phase to Displacement
Range-Doppler Terrain Correction
Extraction of pixel information using the line drawing tool to get Profile Plot
I am not sure about atmospheric effect exclusion, and relationship between topophase and PB.
I think in this case the better solution is to apply SBAS technique, to detecting the ground stability of this area using long-term data of two years S-1 (for example).
We believe the tunneling activity started in early/late December but we got displacements prior to December. That is why I have considered a road far from my main AOI to check the results prior to the month of December. At first, I expected all displacements will converge but unfortunately, they are not after plotting the results.
Why you should say that is not reliable results, I think they are reliable resutls, But your previous question in previous post was different,
In general the behavior of the ground movement alongside your data-set is quite similar (apart from the cons of DInSAR technique), that means the movement is quite well detected in your AOI,
It’s not possible to consider this area as reference, since it’s already subjected to deformation (longitudinal dis.) as you mentioned earlier,
I have different opinion, and to check up the area by processing the data for six months earlier of this data and let see, might be there are other reasons rather than the tunneling initiating,
Sorry if I confused you. And my apologies for saying that DInSAR may not give reliable results.
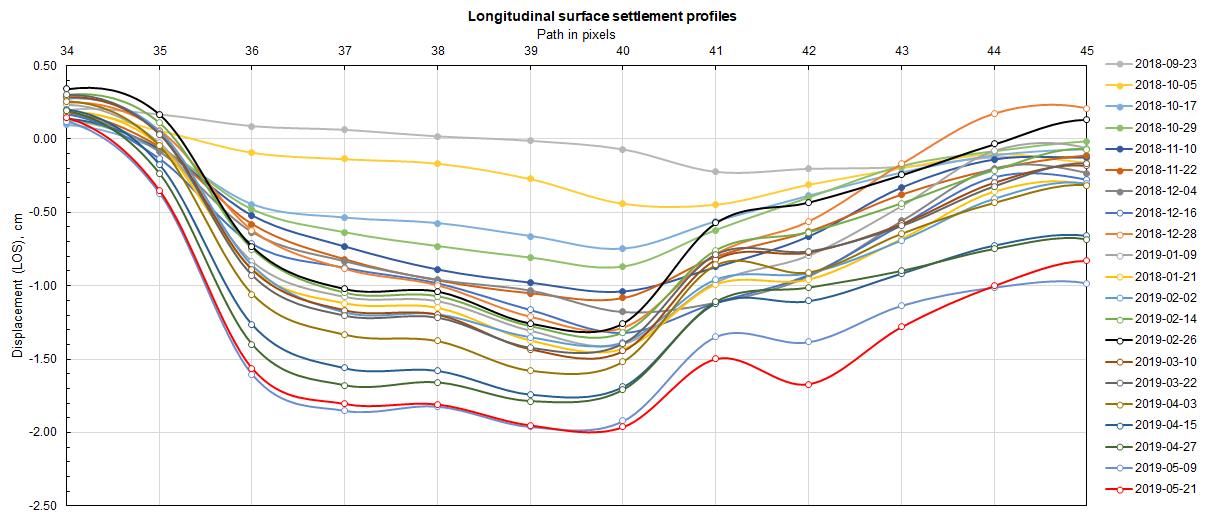
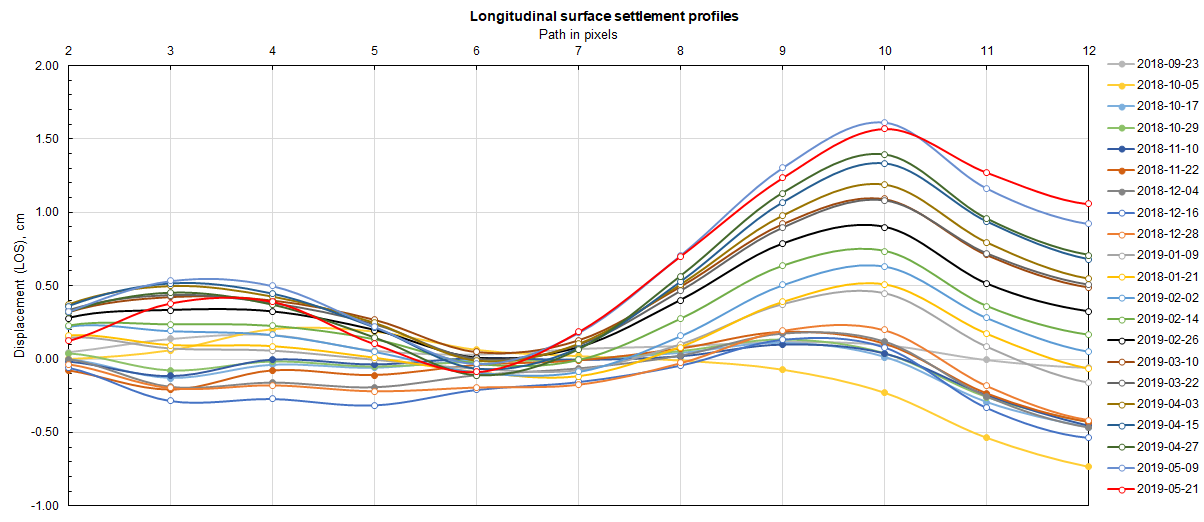
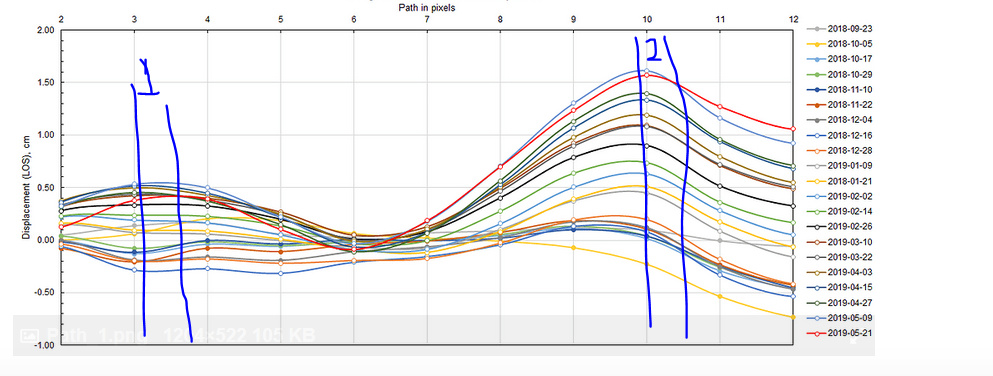
Below is the results I obtained for the road line (600m away from the main AOI) which we suspect that is not affected by the tunneling activity. This is related to my previous post. Our assumption is, since this road line it is not affected by the tunneling activity, it should not have any displacement (say DInSAR should give zero values). But I wonder if this is absolutely true when doing DInSAR. That even if we have absolute no ground movements, DInSAR might still give non-zero measurements. I know there are other factors to be considered here as you have enumerated awhile ago.
As I have mentioned, at first, I expected that all displacement profiles will converge (to zero or may not zero) to support our assumption. But it didn’t.
I think I have different opinion in here, might be it’s affected by other factors as an example (the groundwater fluctuation, clay minerals, soil texture, soil structure, soil penetration, etc.)
Might be, it’s possible for you to take two borehole samples and analyze the structure in these two places,
We’ve also thought of these factors, considering that the area is near the shoreline. We lack information about the site, also the start and the suspension of the construction after some structural damages were observed.
Anyway, thank you for your immediate responses.
I couldn’t apply with PSI/SBAS for this one now because I haven’t started it yet. But thanks for the suggestion. If time permits and my supervisor does not rush to have results, will probably consider PSI/SBAS.
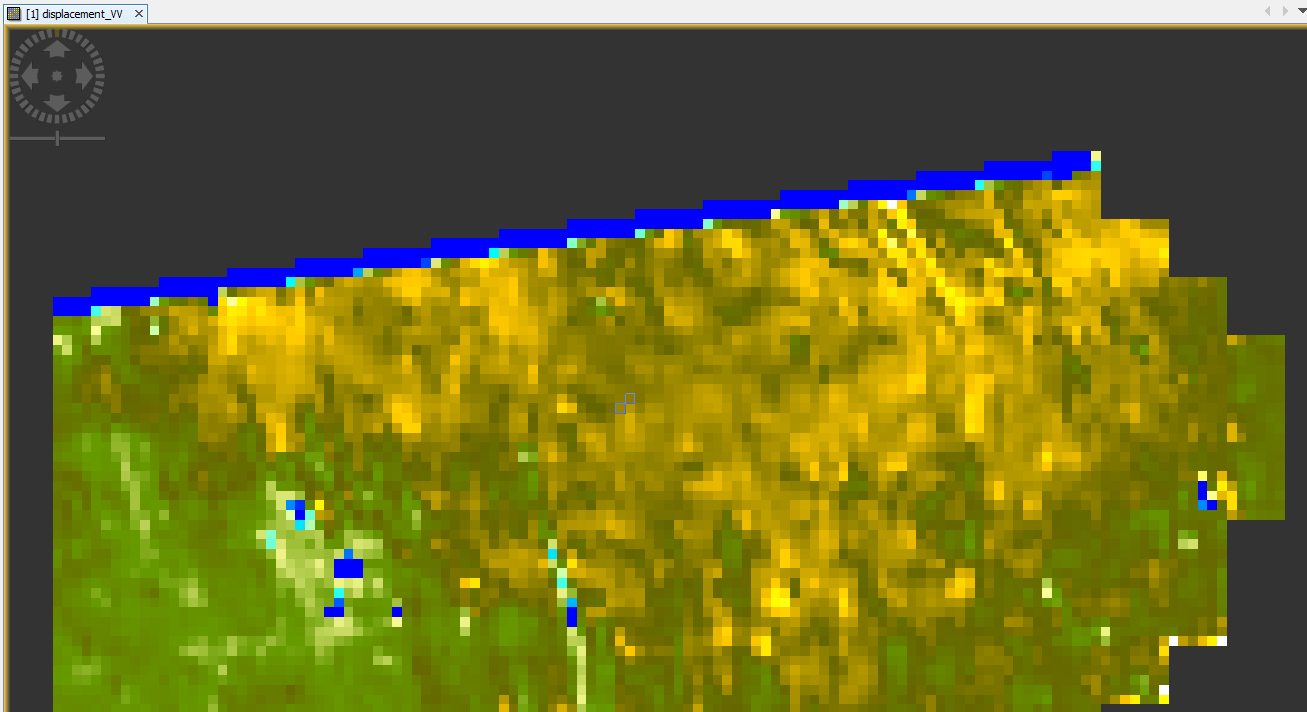
One more thing, from my displacement map (as shown below), I do get some times this kind of regions at the edges (blue in this case). Is this normal?
Thank you so much! I am now relieved. Those regions bother me a lot.
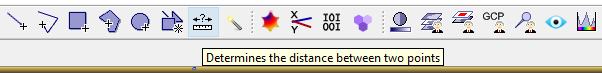
Finally, for today (heheheh), I just want to ask how do I properly use the tool shown below? I want to determine from SNAP the distance between two points (pixels). Whenever I try to use it, it just keeps creating series of connected points, and I couldn’t see any measurement.