I am new and just getting started with InSAR, and somehow managed to finish each step up to Range-Doppler Terrain Correction. I am interested in producing a final deformation map and came across in this forum specifically with your reply to @Serasia. I am a bit puzzled actually on how to do it step-by-step, starting from choosing a pixel (with high coherence) as a reference point to creating a new band to creating a coherence mask and so on. Do you have a video tutorial and/or tutorial on paper on how to do it exactly?
I hope you can help. I really appreciate all the discussions here.
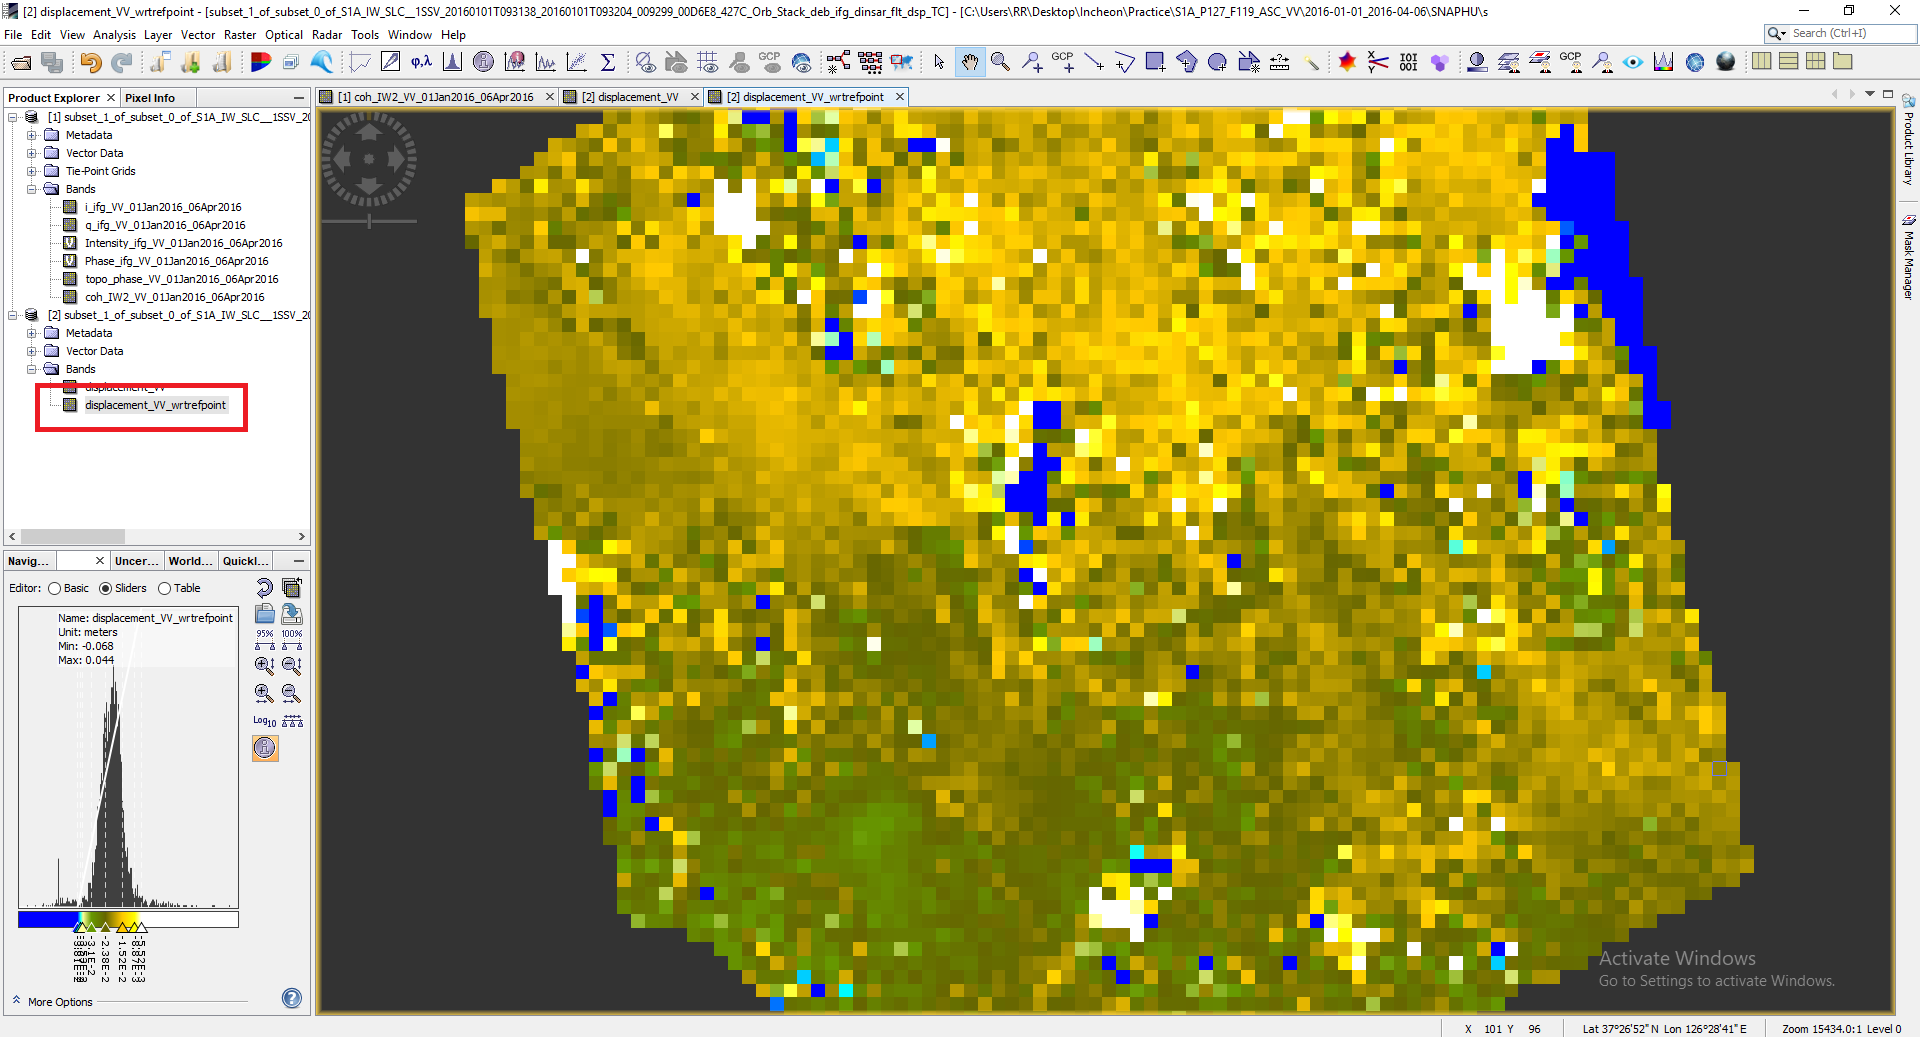
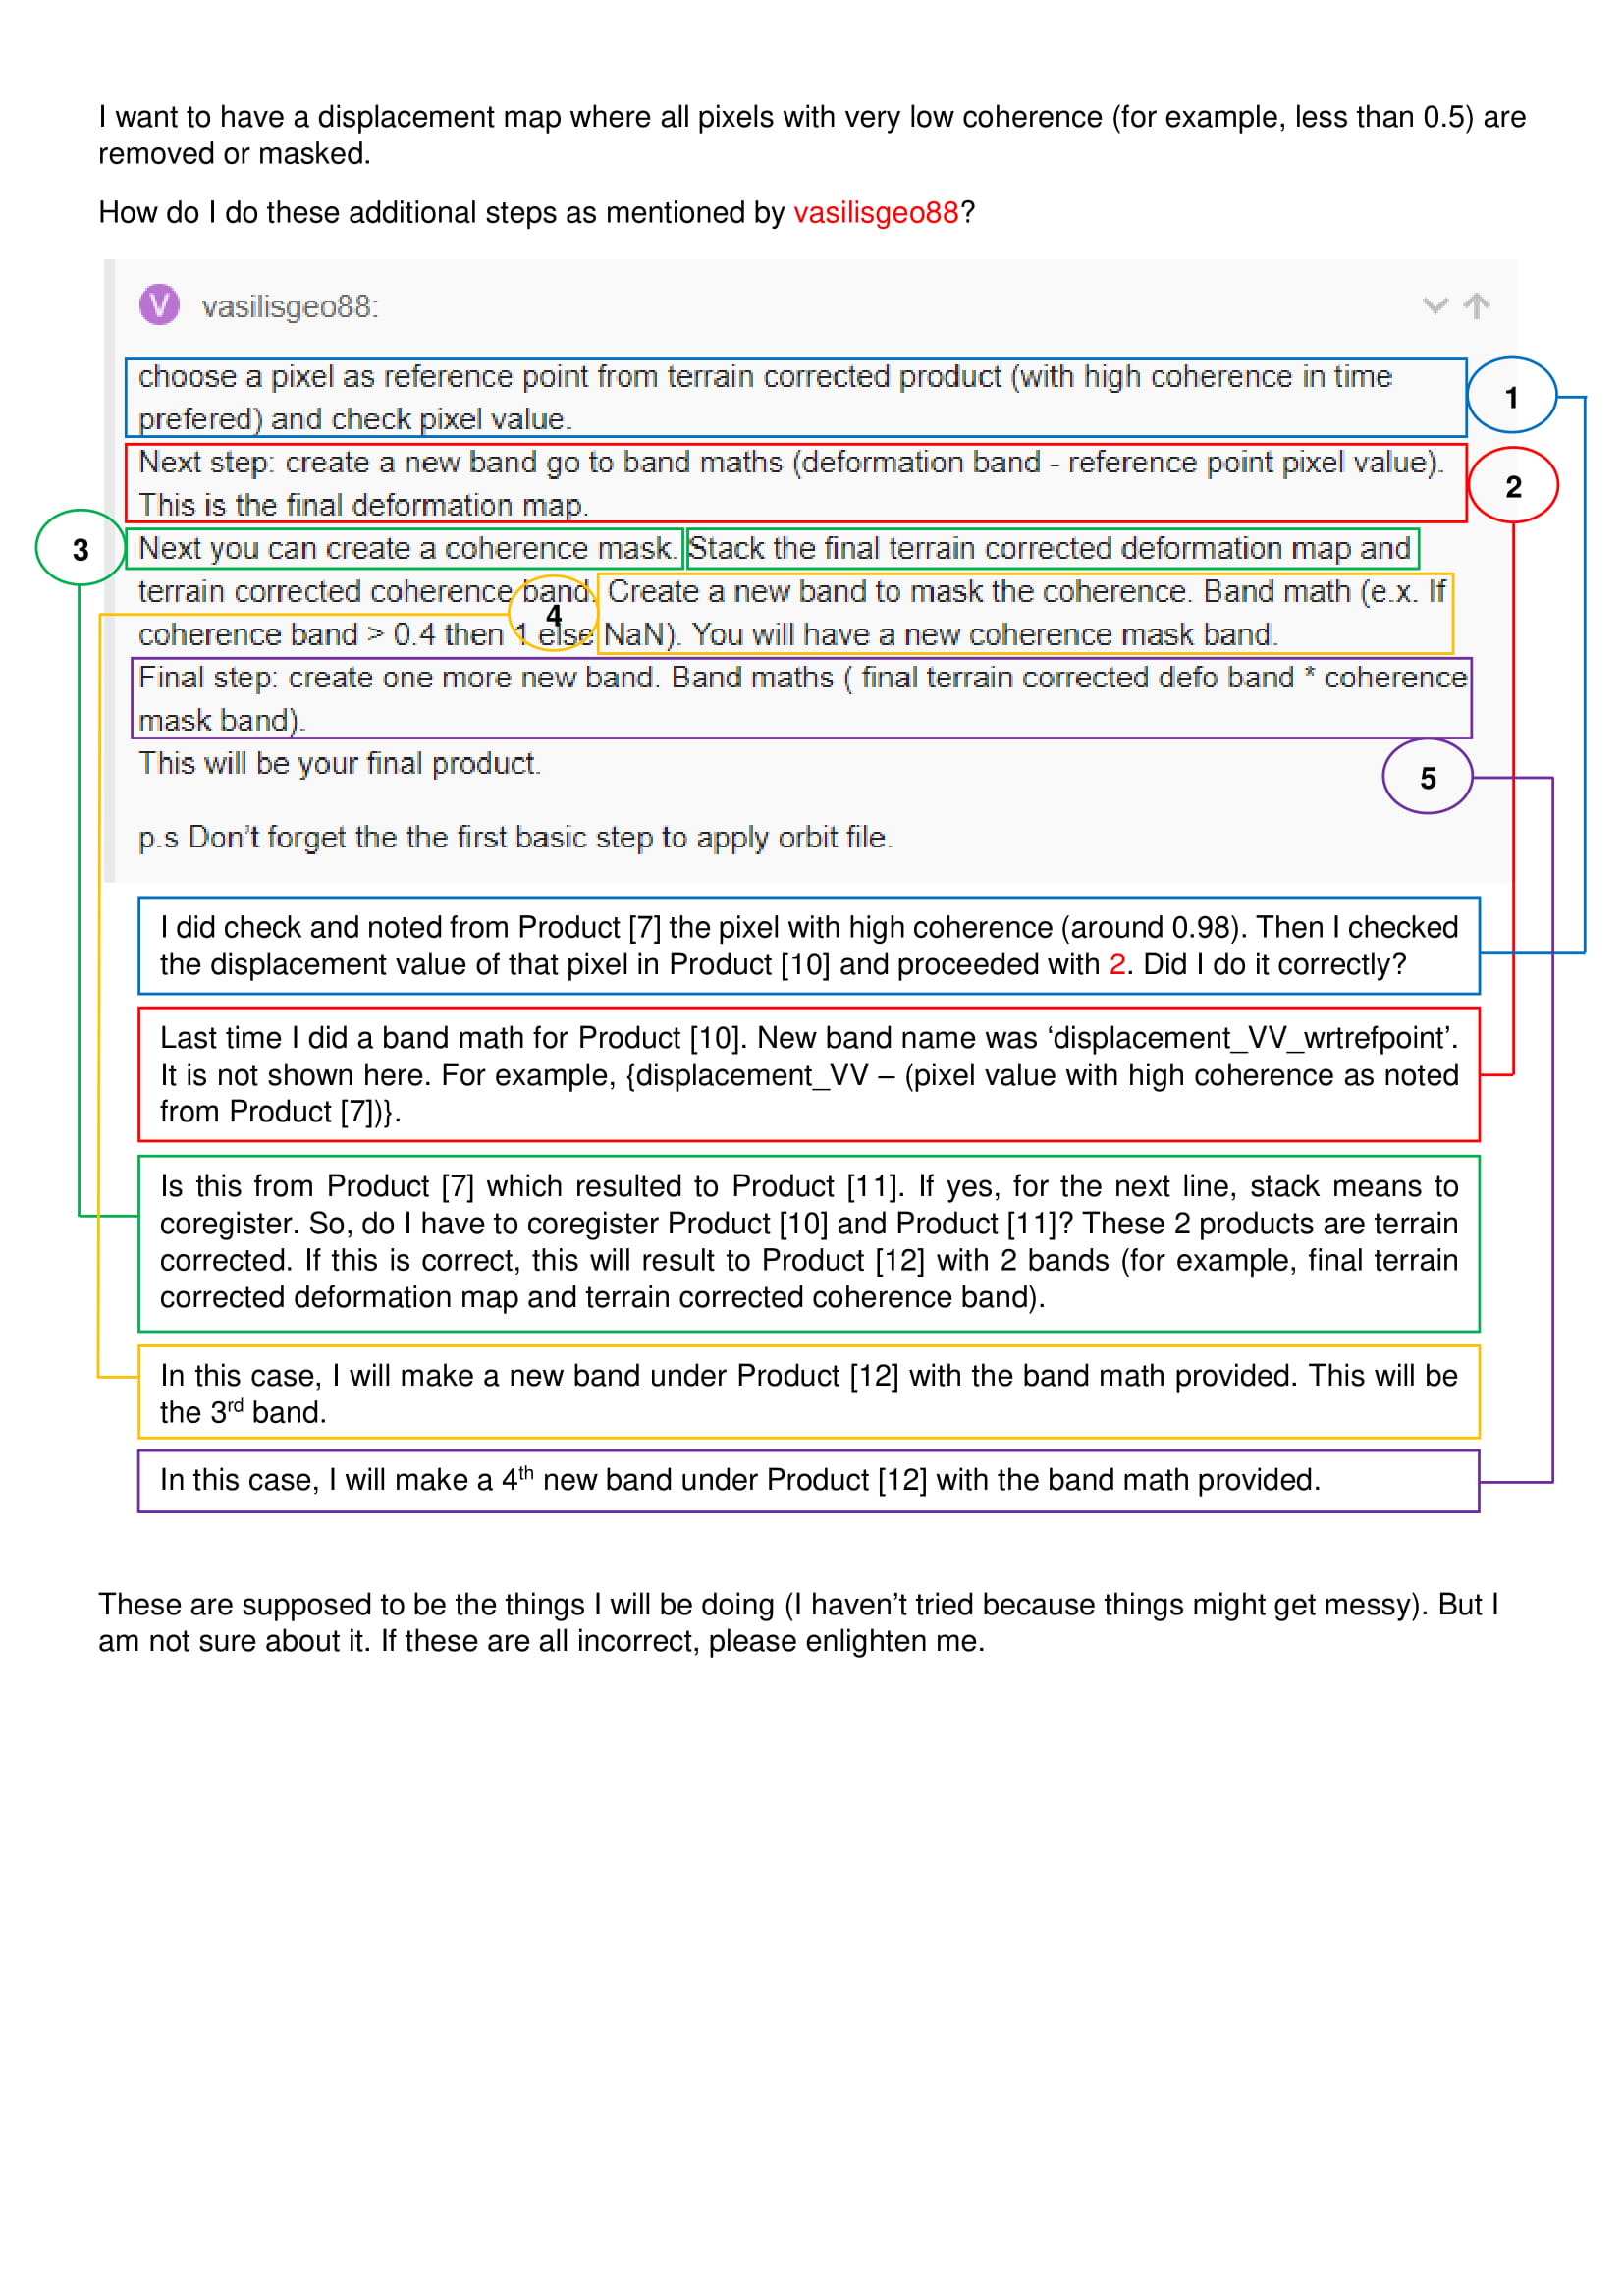
Hi, @falahfakhri! I’ve came across this post by @vasilisgeo88. I’ve done (deformation band - reference point pixel value) and created a new band as shown below:
I am not sure on the next step mentioned. “Next you can create a coherence mask. Stack the final terrain corrected deformation map and terrain corrected coherence band. And so on…” I couldn’t figure out how to do it.
I’d like to start from the reference point step, I think this is different to what you are looking for, Or what is the goal behind the selection of reference point.
In here our colleague has selected a high coherent pixel and then according to the value of coherence result, he considered as a reference threshold of the coherence and hence of the deformation.
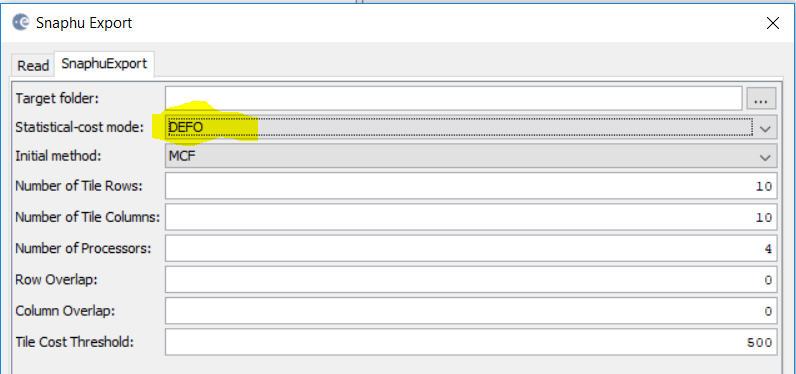
This is easy to apply, once you have created the coherence product, you could open the band math, and apply the following statement condition to create the mask, for example,
IF coherence >= 0.35 Then 1 ELSE 0
The result of aforementioned statement is a mask of only the coherence = 0.35 and higher , the other will be 0, this mask named coherence multiply by the original coherence map, will result only an interferogram of the selected coherence,
Please keep in mind, there is a difference between what is mentioned in this post and the reality behind the selection of the reference point.
An important thing it is worth mentioning here to give you an entire answer concerning the reference point, Please take a look at the following post,
Thank you for the explanation, but I am still confused. Is there a way I can communicate with you ‘verbally’?
If it’s not possible, I will make a flowchart to show you the steps I am following and please comment if where do I do/insert the additional steps you’ve mentioned.
@ryeramirez i was also confused about this step, what i understand from reading posts realted to deformation is that , we have to select a point which u think is not chnaged throughout the time span of your study. you can also get this value if someone has GNSS or leveling data of your study area. By comparing the data you can validate your results.
@falahfakhri, thank you for sharing those posts. I will go through the threads. Have you considered checking Figure 3 which I uploaded yesterday? For the displacement product, how do I mask those pixels with incoherent values? Could you please check Figure 3 and tell me if I understood properly the instructions by @vasilisgeo88. Thank you.
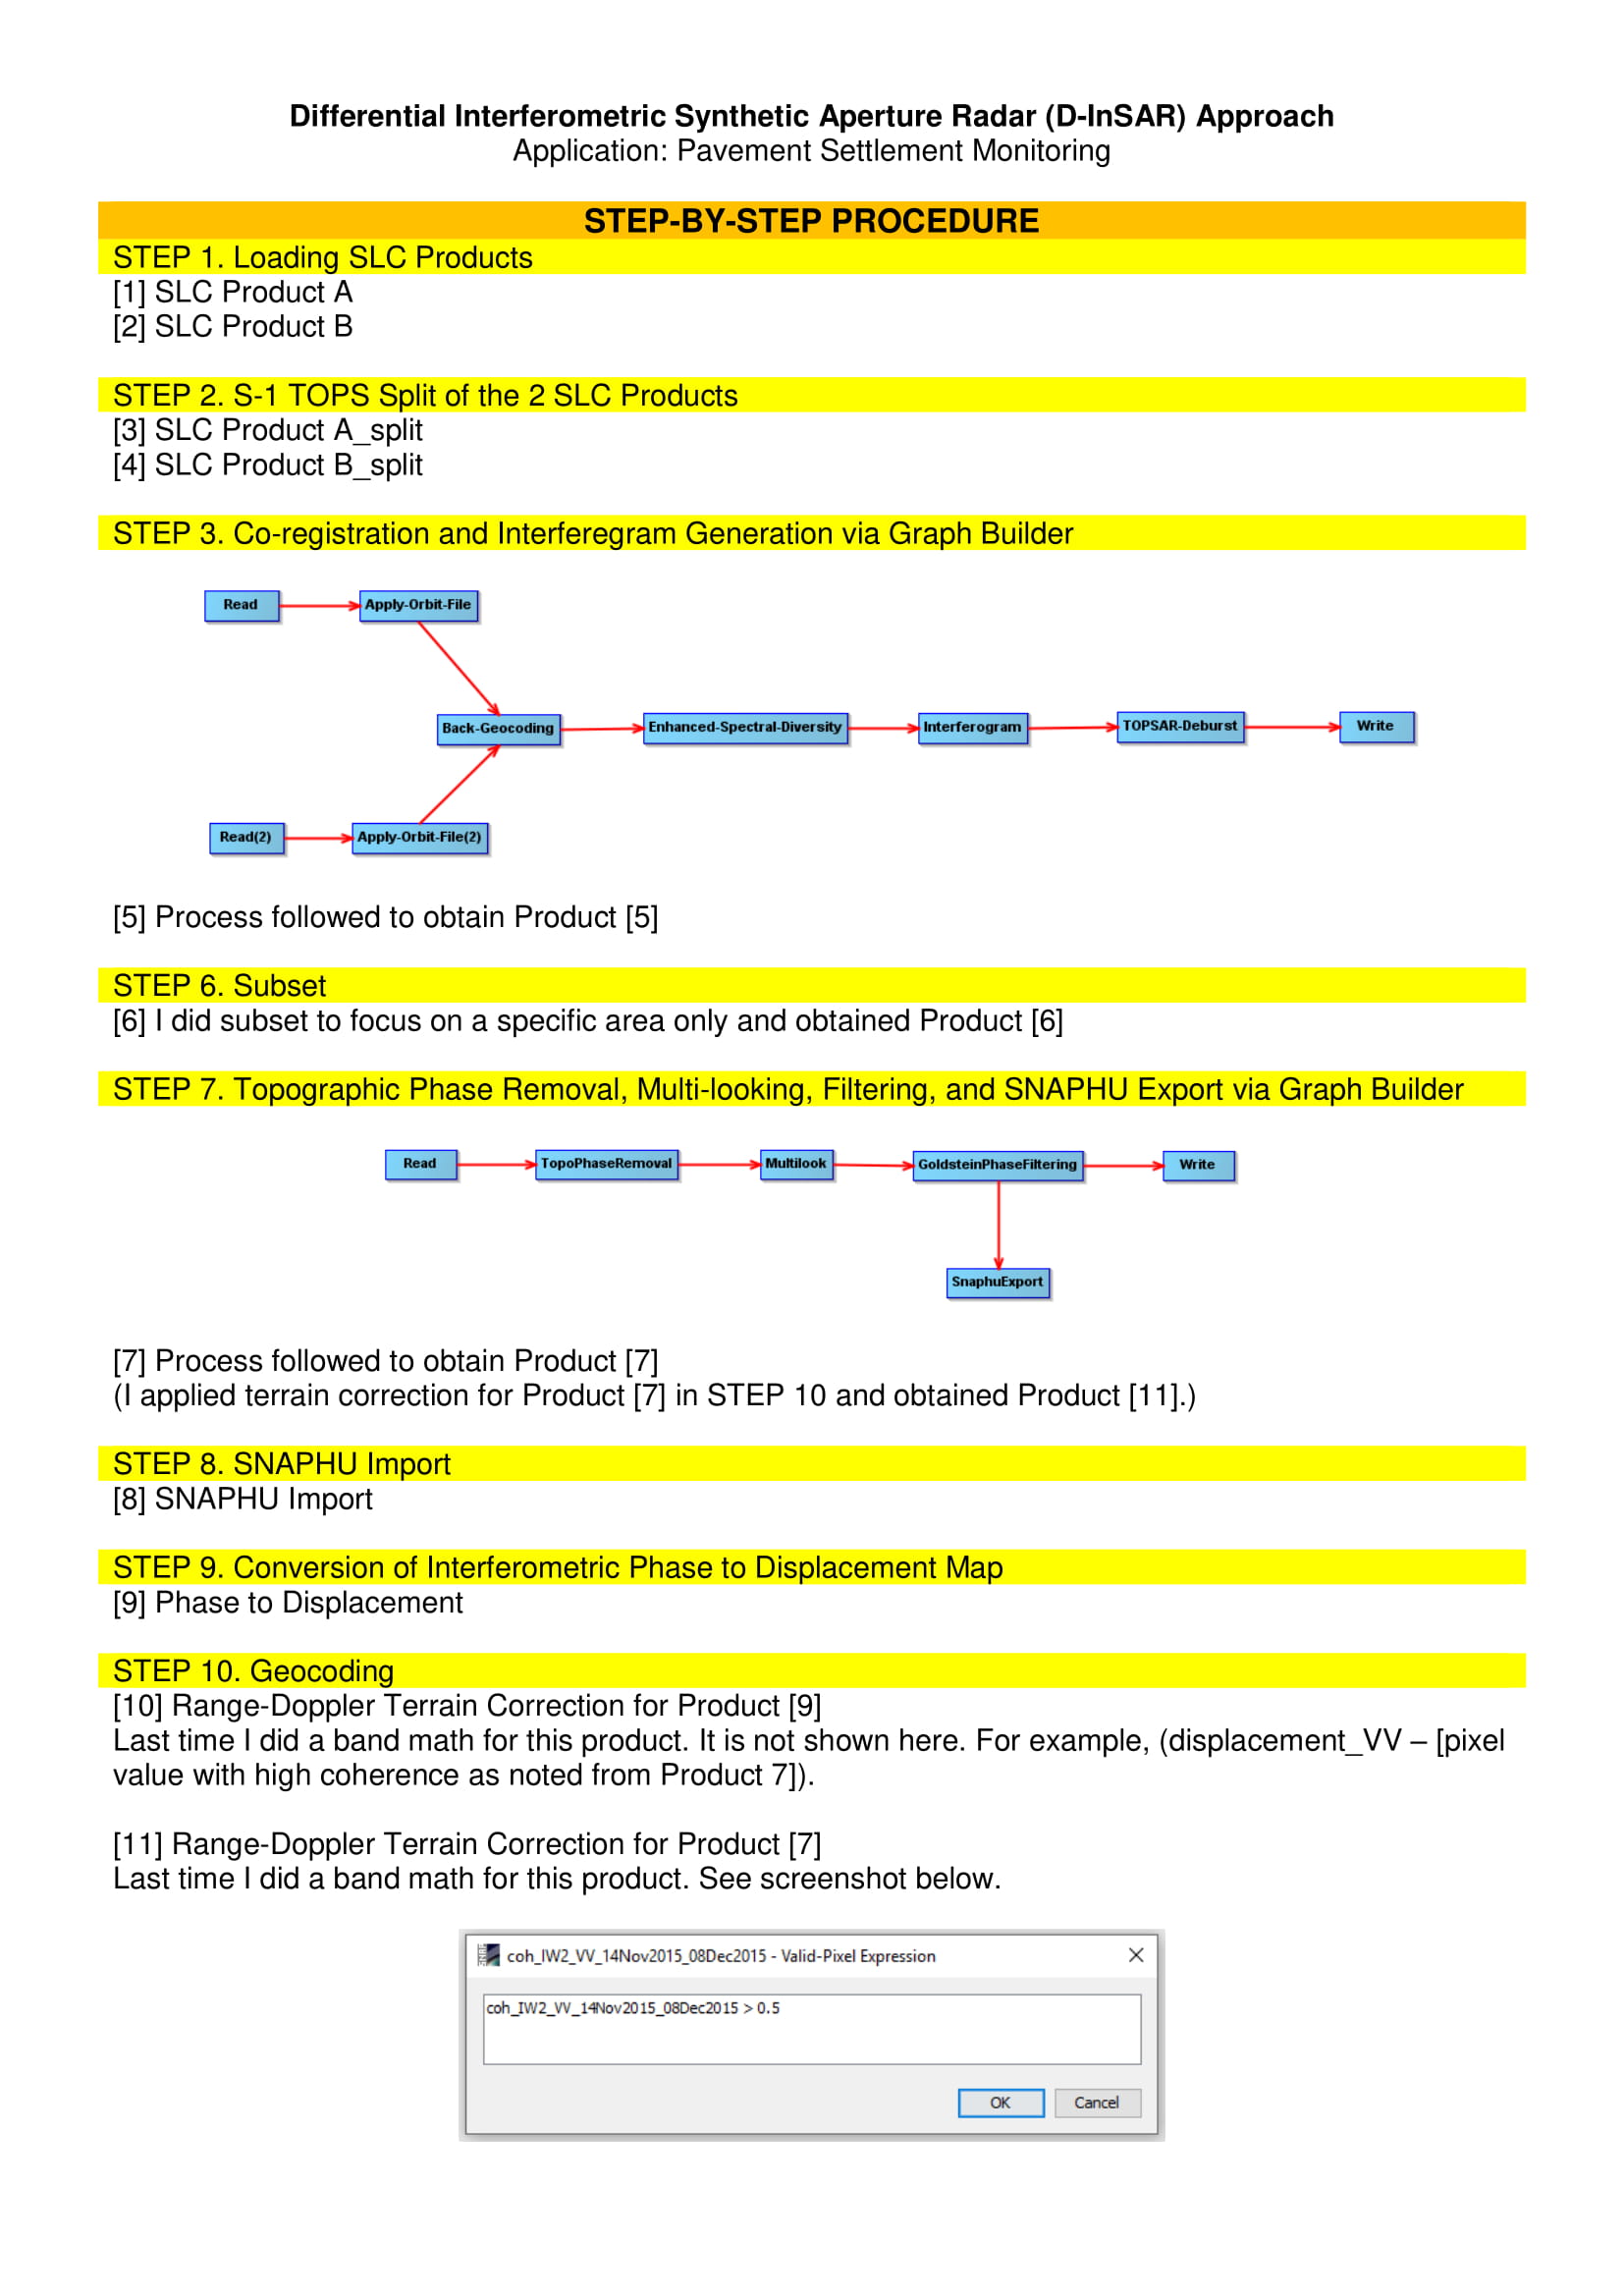
Thank you for the idea. What I did after obtaining a displacement product after applying terrain corrections was this:
In my coherence band where I also applied terrain correction, I masked the pixels with coherence less than 0.90. I right-clicked on the band —> Properties —> Valid Pixel Expression (Coherence Band Name > 0.9). After doing so, I noted the information about the pixel with somehow the highest coherence specifically its position.
In my terrain corrected displacement product, I looked for that pixel with high coherence and noted the value of displacement. Then I created a new band following these steps —> Raster —> Band Maths —> (New Band Name) and made the following expression (New Band Name - Pixel displacement value with high coherence).
I do not know if what I did are all correct. I am trying to understand and do what vasilisgeo88 mentioned in one of his posts.
Please take a look of what I am following in my study. I hope we can share ideas. @falahfakhri is also helping me and I am very thankful to him.
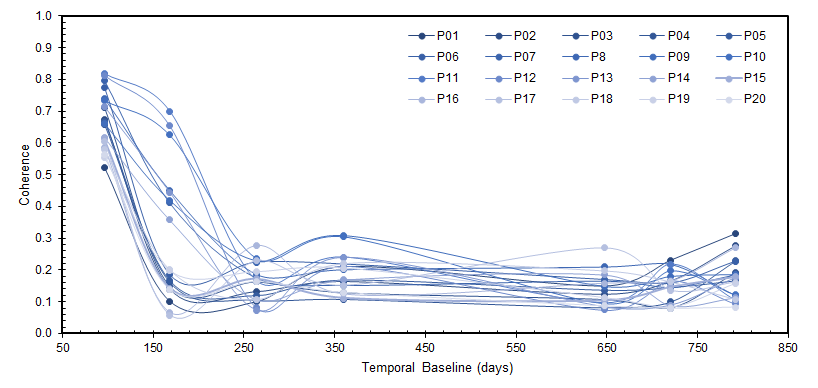
Hi! I was looking for the graph showing the effect of temporal baseline on coherence in one of the fora here but unfortunately, I couldn’t find it anymore. Can you please provide me the graph and some relevant papers discussing the effects of temporal baseline and perpendicular baseline in coherence estimation? Thank you.
In general the long temporal baseline in vegetated area, or unstable objects within same area affects the coherence correlation between two or more passes,
@ABraun, yes! Thank you so much! So basically, with regards to time and distance, the shorter the temporal baseline (days) and perpendicular baseline (meters) the better the coherence. Am I correct? I’ve read some papers while waiting for this graph and the findings are like that.
This is true for the temporal baseline.
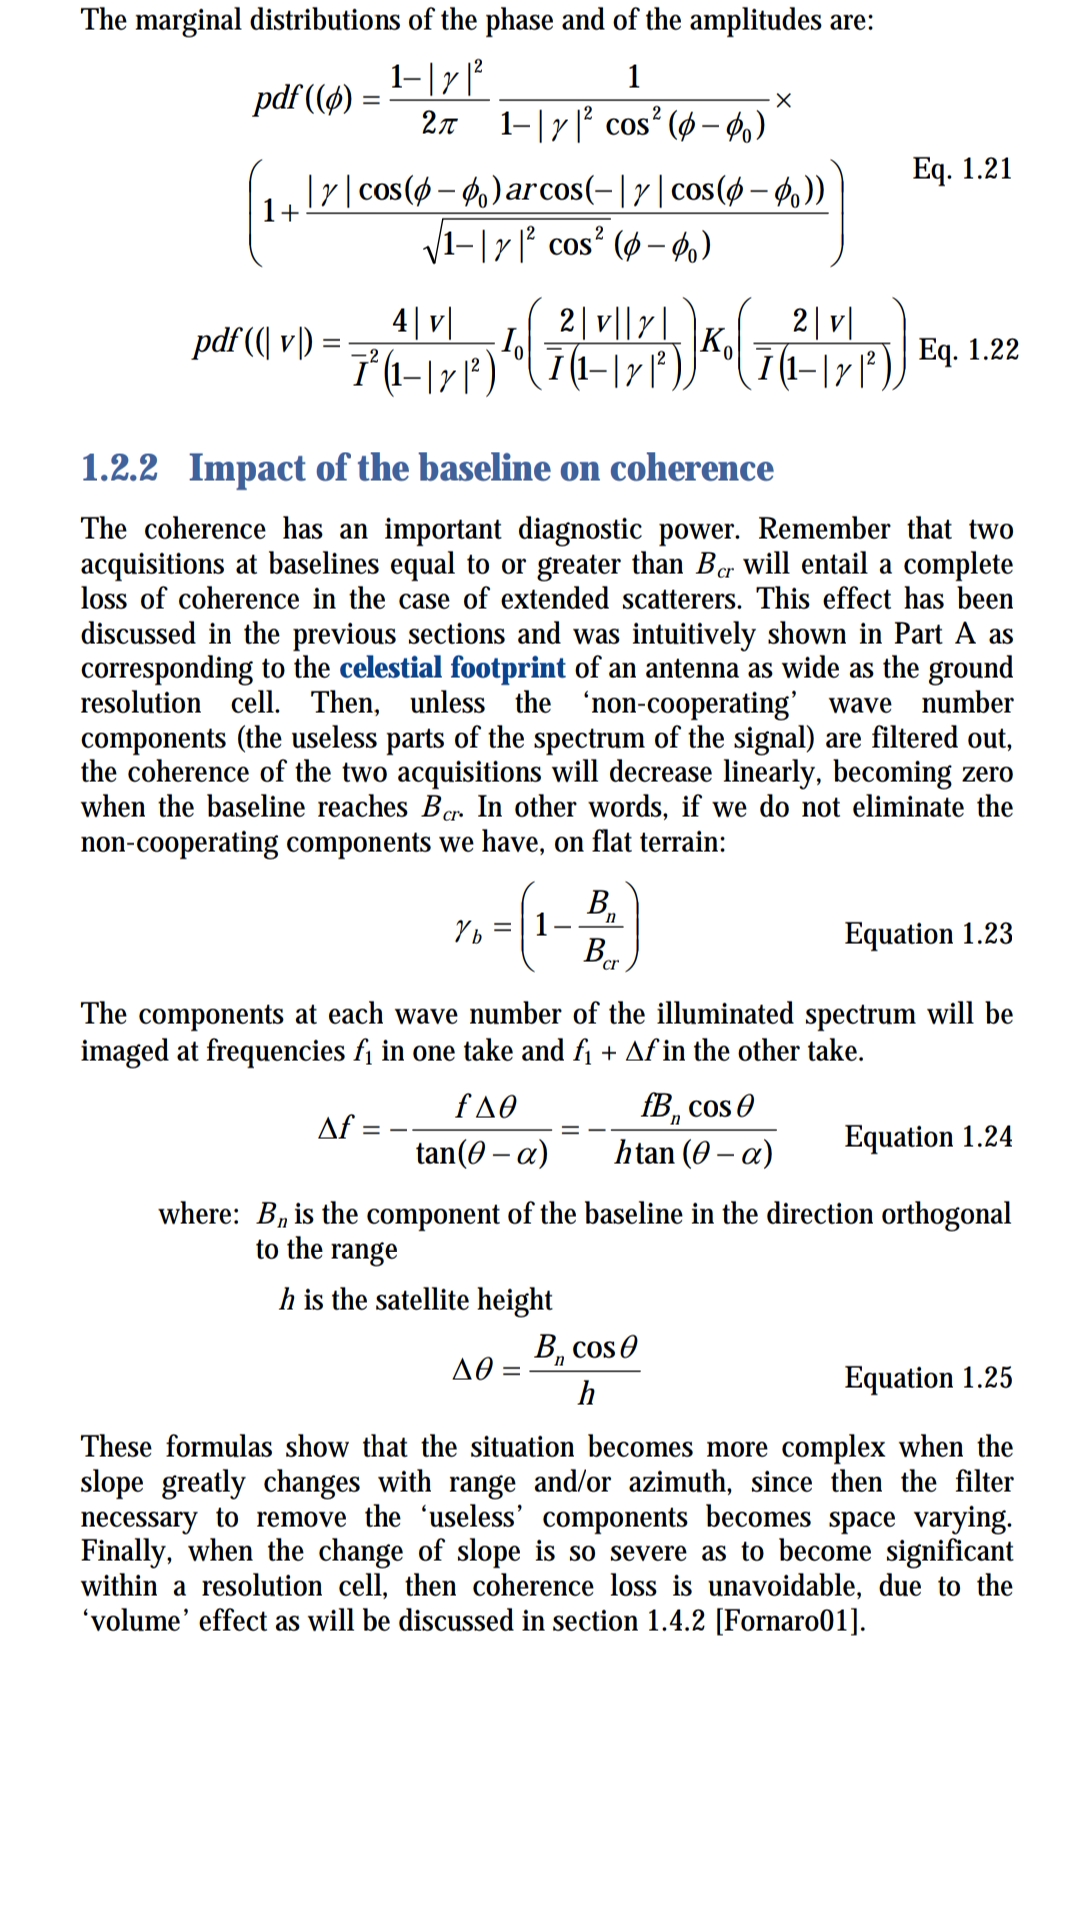
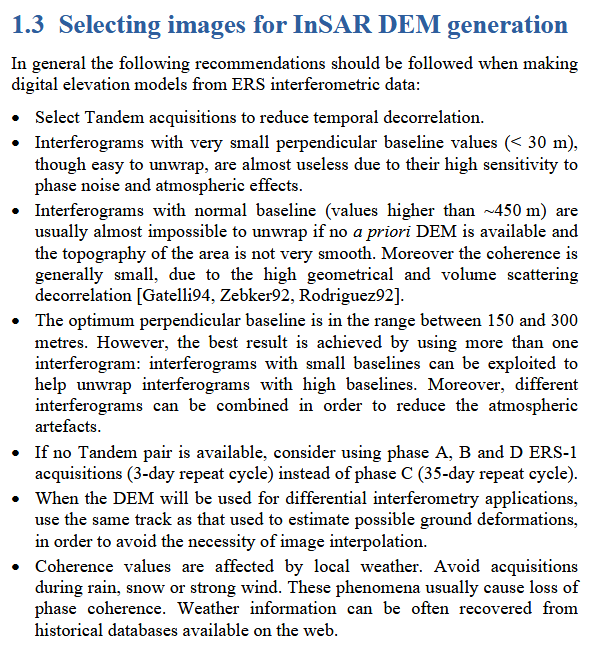
The perpendicular baseline is more indifferent. For example, for DEM generation, 150-300 meters are stated most suitable.
Thank you, again! So the effect of perpendicular baseline is indifferent! For my preliminary study, the longest and shortest perpendicular baselines were 97m and 18m, respectively. These do not fall in the range of optimum perpendicular baseline. Will it still be okay? I see some published papers with the same case I have.
For the mean time, I am more focus on the effect of temporal baseline on coherence. Below is a summary showing the relationship between the two I have obtained. Could you tell if this is reasonable? The images I’ve acquired were between October 2014 and December 2016. I have a total of 8 images creating 7 pairs. My master image is the October 2014 SAR image and the slave images have intervals of approximately 3 months from each other.
I also would like to ask if there is any recommended value for coherence to get reliable displacement estimation? Presently, I’ve set mine to 0.50 and above.
Also, can I stack images from the following situations?
Same path, same polarization, different frame
Same path, different polarization, different frame
Thank you, and my apologies for asking too many questions.
Sentinel-1 doesn’t provide data above 150 m (unfortunately), so this is okay. I’d still say, the longer the better.
Coherence image look reasonable, I think most of the decorrelation (decrease of coherence) happens during the first month.