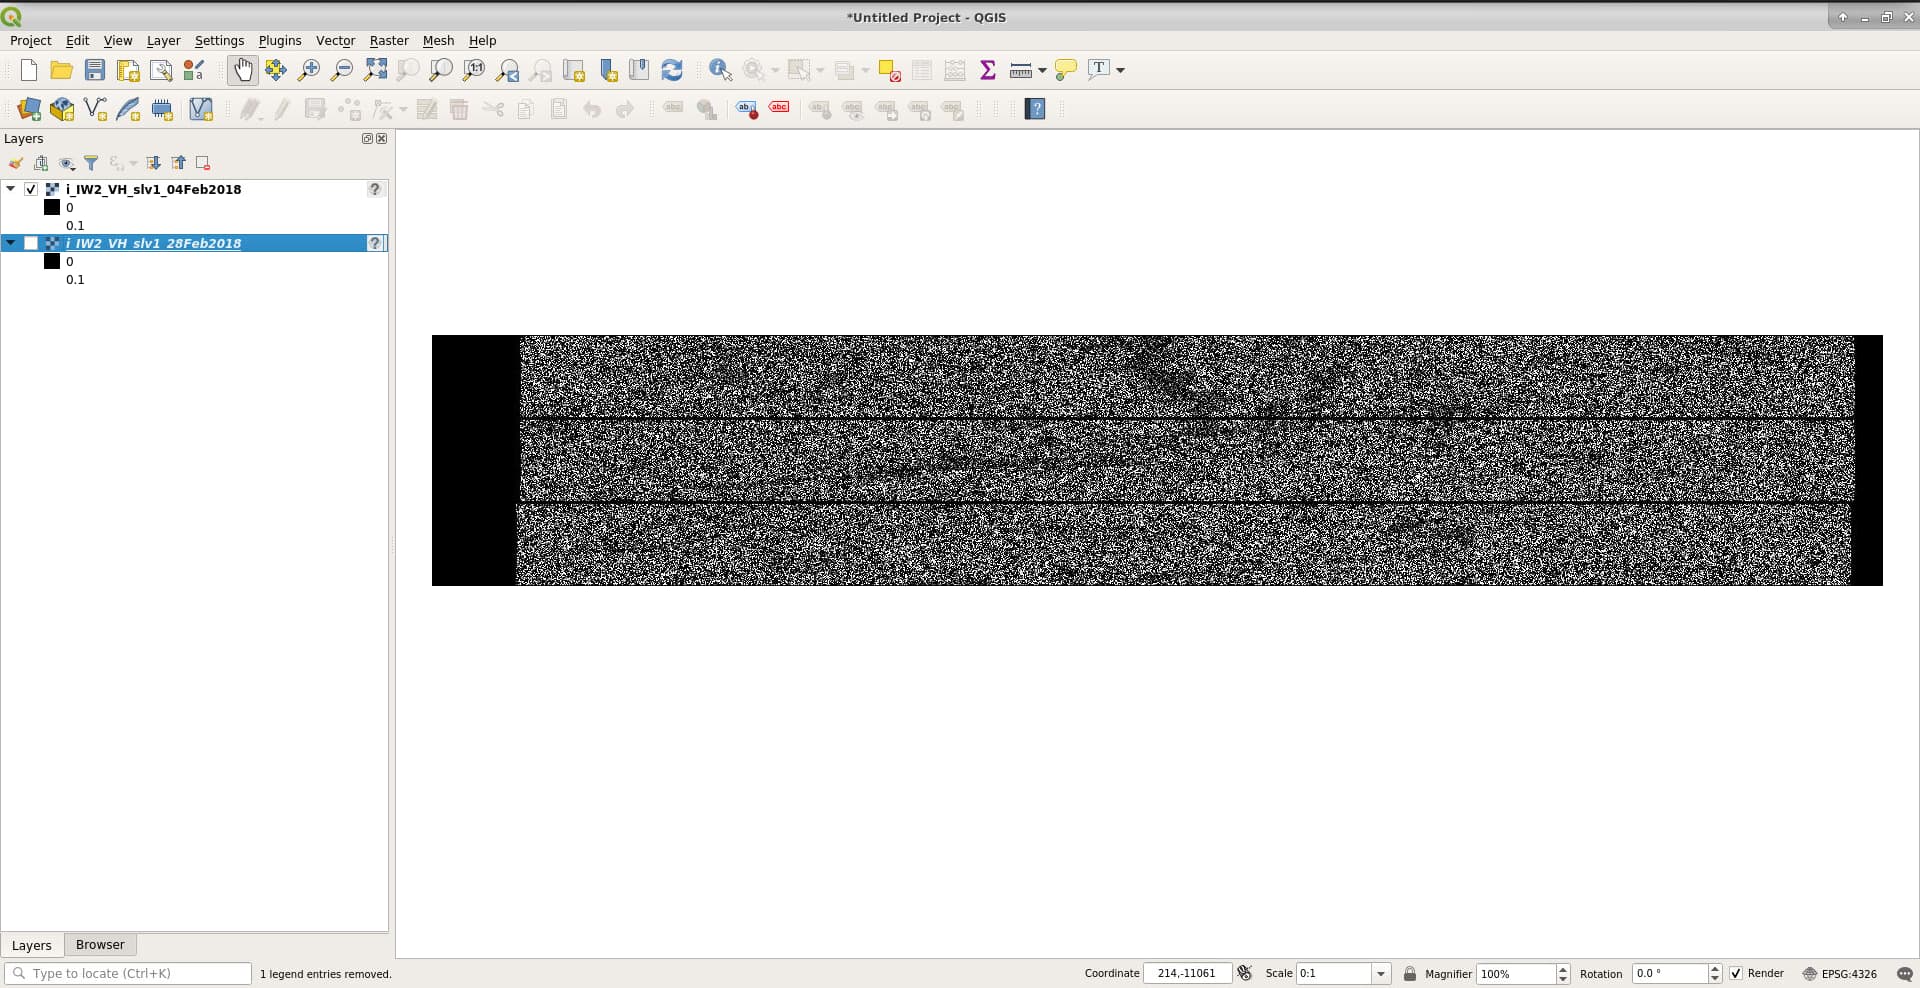
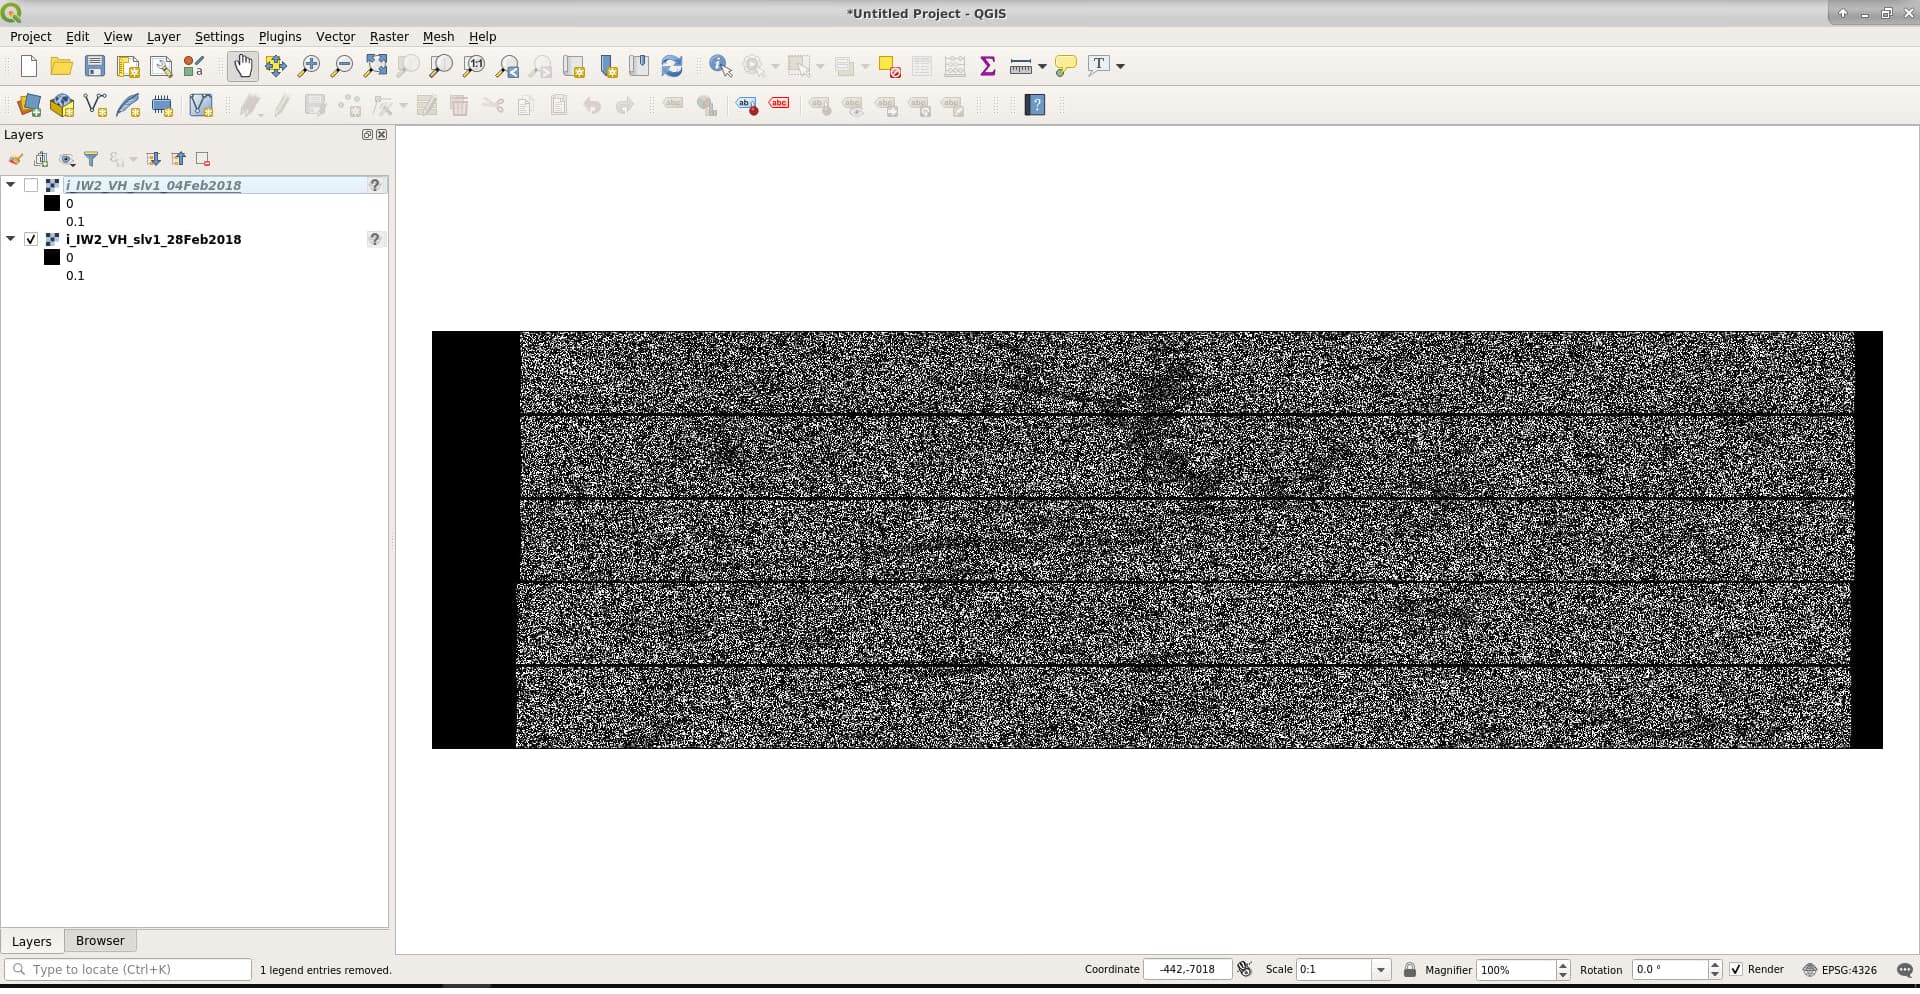
After solving the previous issue related to the DEM, I’m now facing another strange issue. For a particular date 2018-02-04 (YYYY-MM-DD) the output of TOPSAR-Split misses half of the data. Look at the screenshots for a comparison between another date (2018-02-28), where the data is complete.
To verify that the problem is not in the source zip file, I’ve also run the process up to the calibration step for both dates, and the output has the same size. The process graphs to verify this are also attached below:
I have looked at the graphs but I am not sure if I understand them. Could you provide more details on what you are trying to do? For example, which product is master, which is slave and we want to coregister which subswath/bursts from master with which subswath/bursts from slave etc. Thanks
because I want snap to keep the data intersecting with the provided AOI from all the available bursts, since I do not know in advance which of them overlap with the provided polygon. Is it wrong doing like this?
The selected subswath is IW2.
5. Apply-Orbit-File (on both, master and slave)
6. Back-Geocoding using Copernicus 30m Global DEM
7. Write
The issue is with the 20180517_20180204.xml graph: as you can see from the screenshot the output is missing half of the data, which instead is present if you run the 20180517_20180228.xml graph. The graphs are the same except of the input data.
The other graphs were just a test to see if the output of calibration contained the full data coming from the slice-assembly step.
Please let me know if it is still not clear enough.
First I am not sure why you chose SLV images instead of GRD images. If there is no particular reason, I’d suggest you use GRD images to avoid a lot unnecessary processing.
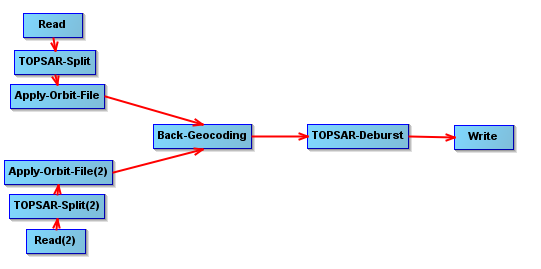
Second, if you need to use SLC images, you should not use slice assembly. You should use something like the graph below:
We have a lot of SNAP tutorials on ESA’s website (Tutorials – STEP) and you will find that they are very helpful in guiding you how to use the operators.
Using GRD data is not an option, we need SLC data for our project.
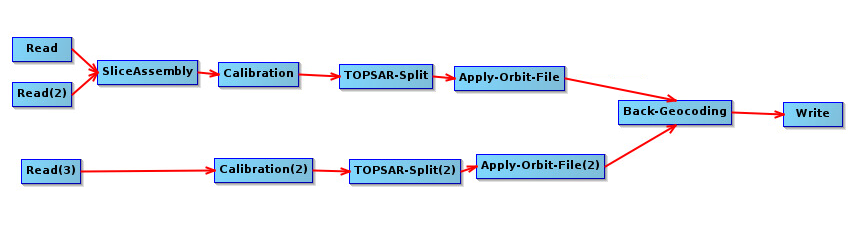
I am using slice assembly because the area of interest is covered by two slices for Sentinel-1A and hence I need to merge them first.
Could you please try out the process graph I’ve sent you? I have not included the Deburst step, since the error happens before. It does not differ much from the one you are suggesting me to use. The visualized version of mine is the following: