To determine rcs of point target , sigma nought, DN is required which is accessed from LUTs
would you kindly elaborate on how to read particular pixel extracts from LUTs
Hi, The ESA document ‘Radiometric Calibration of S-1 Level-1 Products Generated
by the S-1 IPF’ describes how to calculate the radar cross-section of both distributed and point targets. The document can be found at https://sentinel.esa.int/documents/247904/685163/S1-Radiometric-Calibration-V1.0.pdf.
1 Like
sir,
Thank you
I referred to the document you have mentioned
it was of little help, can u futher guide on how to access particular location pixel features such as range, DN and sigma nought in LUTs
In calibration vector list , how to locate and access range position, aziumth line for a particular pixel location in the image
Section 4.1 of the calibration document gives an example of how the sigma0 LUT value is calculated. If the coordinate of your pixel is 8720, 5300 (i.e. range and azimuth coordinates) then you need to perform:
-
Find the calibration vector corresponding to your azimuth coordinate 5300 as indicated by the line xxxx /line tag. If your azimuth coordinate is not exactly the same as the vector, you can choose the nearest or if you wish, perform an interpolation.
-
The pixel count… tag gives the range coordinates of the LUT values. Again find the nearest coordinate to your pixel range value (or perform interpolation).
So for pixel coordinate 8720, 5300, the sigma0 LUT value is 3.199460E+02.
Sir, thank you
I have taken Sentinel IW ,GRD ,SAR image with scene width and height ( 25612x 16757)
my pixel coordinates are (12232, 14782)
I could locate azimuth line in the calibration vector list but unable to locate range coordinates
since range row values of count(642) lasts till 2960, can you guide me to locate my pixel range coordinates (12232)
Hi, Can you please provide the name of the GRD product so I can take a closer look. For IW products, the pixel count field should look like:
<pixel count="647">0 40 80 120 160 200 240 280 320 360 400 440 480 520 560 600 640 680 720 760 800 840 880 920 960 1000 1040 1080 1120 1160 1200 1240 1280 1320 1360 1400 1440 1480 1520 1560 1600 1640 1680 1720 1760 1800 1840 1880 1920 1960 2000 2040 2080 2120 2160 2200 2240 2280 2320 2360 2400 2440 2480 2520 2560 2600 2640 2680 2720 2760 2800 2840 2880 2920 2960 3000 3040 3080 3120 3160 3200 3240 3280 3320 3360 3400 3440 ....
25320 25360 25400 25440 25480 25520 25560 25600 25640 25680 25720 25760 25800 25833
So the spacing between values is 40 which should be the same for all IW products. Since you have 642 values, then your last values should be about 25640. Perhaps you are not reading all the values in the field?
sir, thank you
when i m placing the cursor on pixel count tag displays values till 2960. Is there any way to display all values…
IW product that i m referring to : s1a-iw-grd-vv-20170721t003946-20170721t004011-017562-01d603-001.tiff

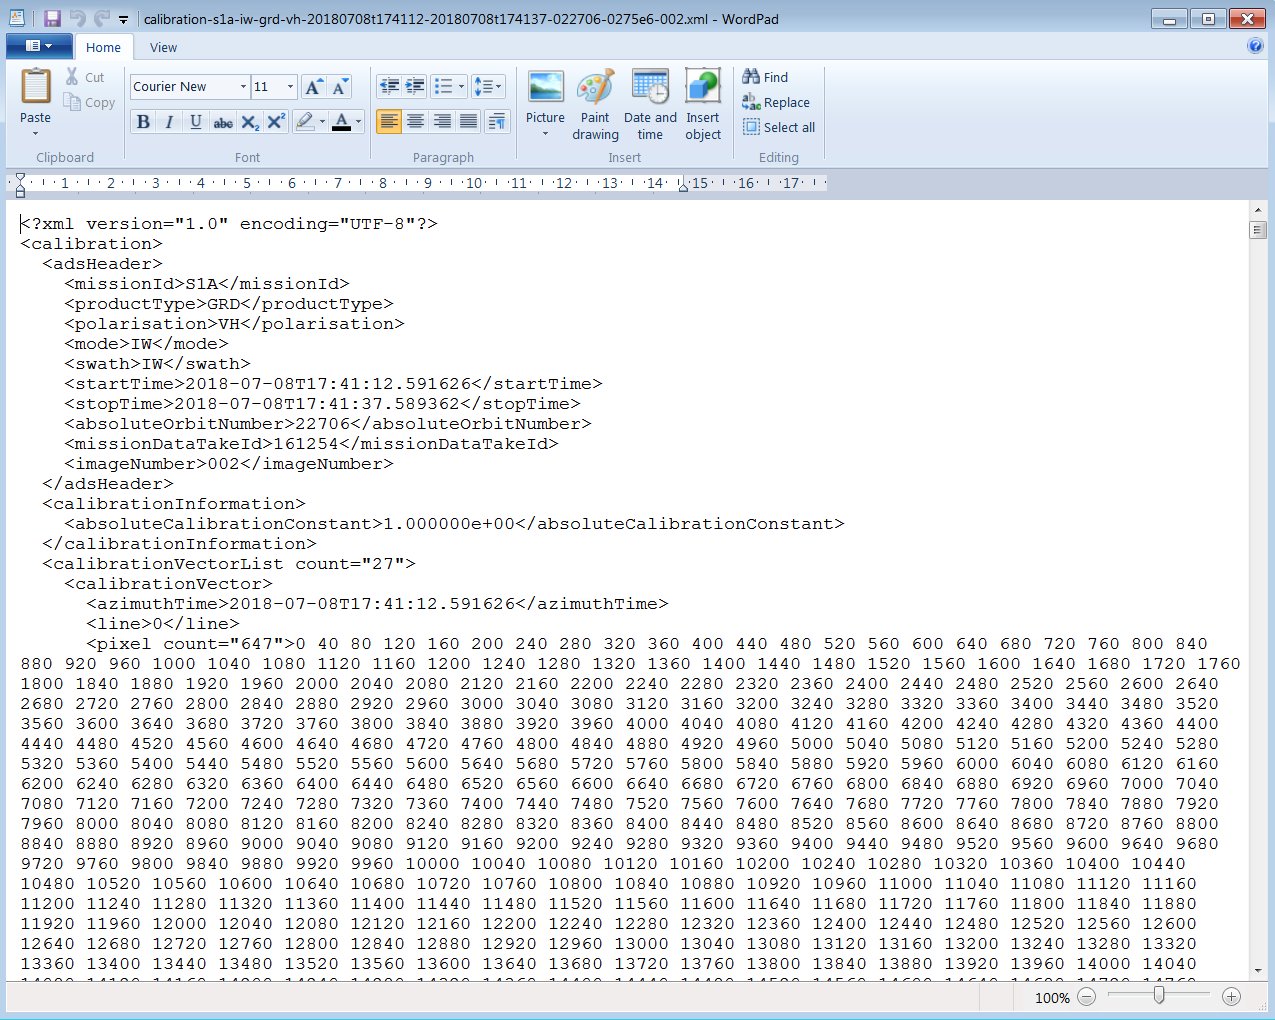
Hi hasini, I suggest you open the annotation file in WordPad, NotePad or any other text editor since this file is just ACSII text. Make sure word wrap is applied. Below is an example in WordPad:
Sir, thank you
As i m analysing the sentinel link , can i get the details of Sentinel -1 satellite, transmitted power (Pt) and transmitter antenna gain (Gr)
Hi,
A good overview of the performance of S1 can be found in the document below:
https://earth.esa.int/documents/10174/1567860/Sentinel-1+System_Fringe_final_1.pdf
Note that to calculate the radar cross-section of either a distributed or point target, it is not necessary to know parameters such as transmitted power and antenna gain. These types of factors are implicitly included in the calculation of the product calibration constant.
Sir, thank you
will SNAP tool facilitate in computing range and azimuth ambiguities of point targets
can you please suggest any related documents and link…
Hi,
I don’t think SNAP can be used to measure ambiguity ratios. You can find out more about measurement of these ratios from Section 6.2.2.4 of the S1 2016 Annual Performance Report at https://sentinel.esa.int/documents/247904/2370914/Sentinel-1-Annual-Performance-Report-2016. Note that if S1 range ambiguities occur in an image, the source of the ambiguities is from outside the image - this makes measuring them quite difficult.
sir,
thank you for all the information
sir,
I need information on the incidence angle at the scene center of the IW Sentinel image
is there any way to calculate the angle with the help of SNAP tool or any other method
kindly guide me
It’s available in the incidence angle tie point grid of the product.
thank you,
given the resolution of S-1a in pixels what is the method to express resolution in meters using line and pixel spacing
Hi, If the spatial resolution is 2.2 pixels in azimuth and the azimuth pixel size is 10m (e.g. for IW GRDH products) then the spatial resolution in m is just 2.2 * 10 = 22m.
thank you
attempting to estimate the range and azimuth resolution for S-1 GRDH images by using point targets
3 dB width of impulse response function(IRF) obtianed is 30
Is this value 30 in pixels or in meters?
and how will this relate with 20x22 resolution for GRDH
kindly clarify
I would assume that 30 is in m since 30*10m = 300m is far too large for the spatial resolution. There should be a spatial resolution in both range (x) and azimuth (y). Are you using a point target tool in SNAP? If so I’ve not used it. You might not be using a perfect point target in which case it would give a larger value than expected.
thank you
Is GRD IW Sentinel 1A image displayed using SNAP is calibrated?
If we determine calibration factor ‘K’ for such images using point targets will it match with ‘K’ in LUTs