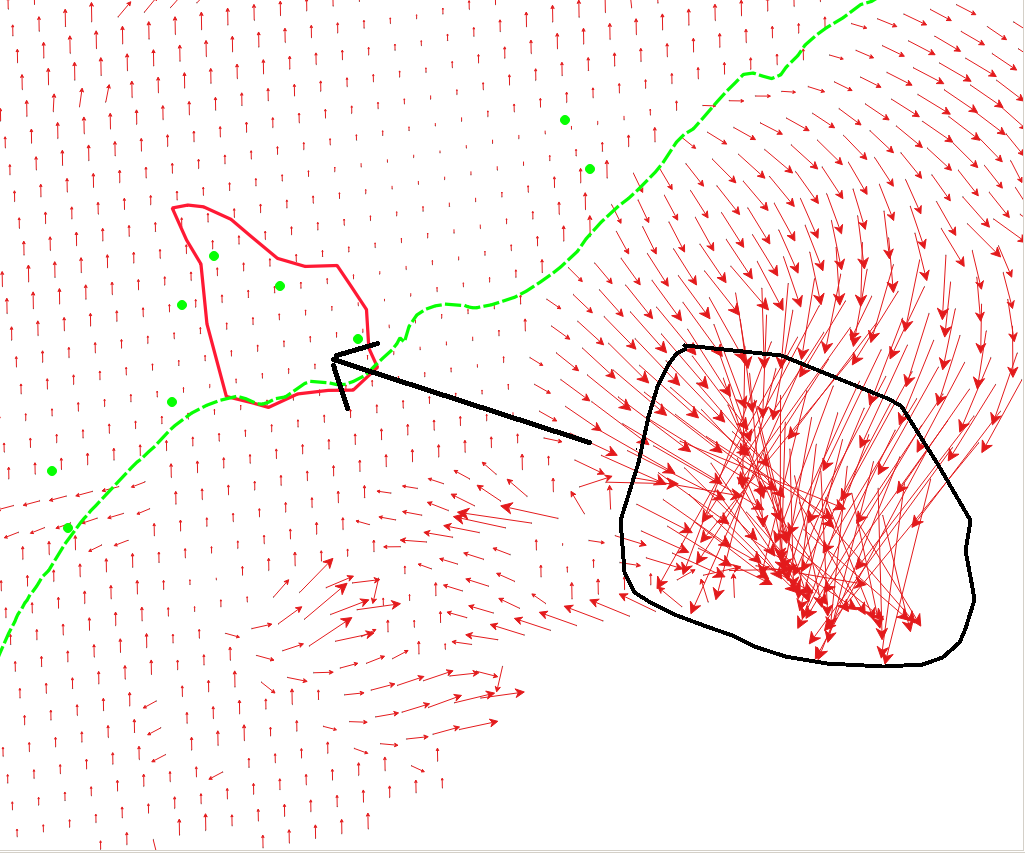
The red polygon is the affected area, the green dotted line is the sea shore line, the green dots are the registered landslides and the red arrows should be the velocities.
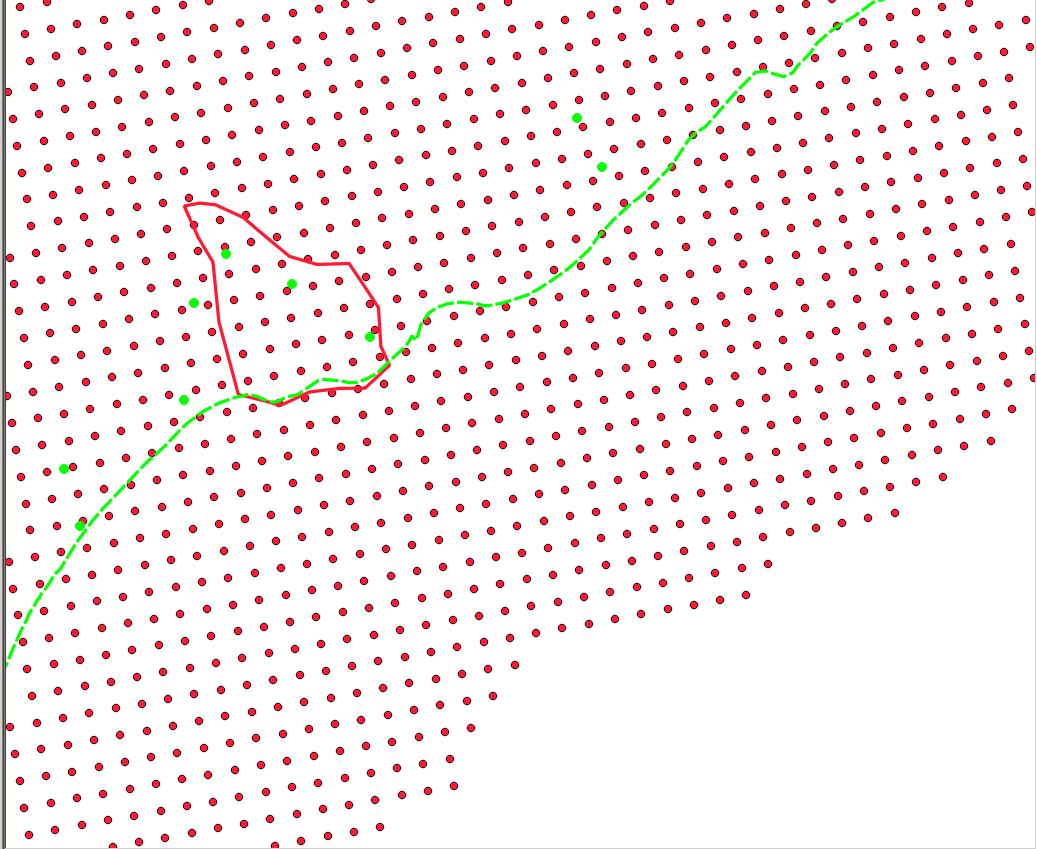
The red polygon is the affected area, the green dotted line is the sea shore line, the green dots are the registered landslides and the red dost are the points where the velocities were taken.
@ABraun
All green dots and red arrows should be behind the dotted line which is delimiting sea and land.
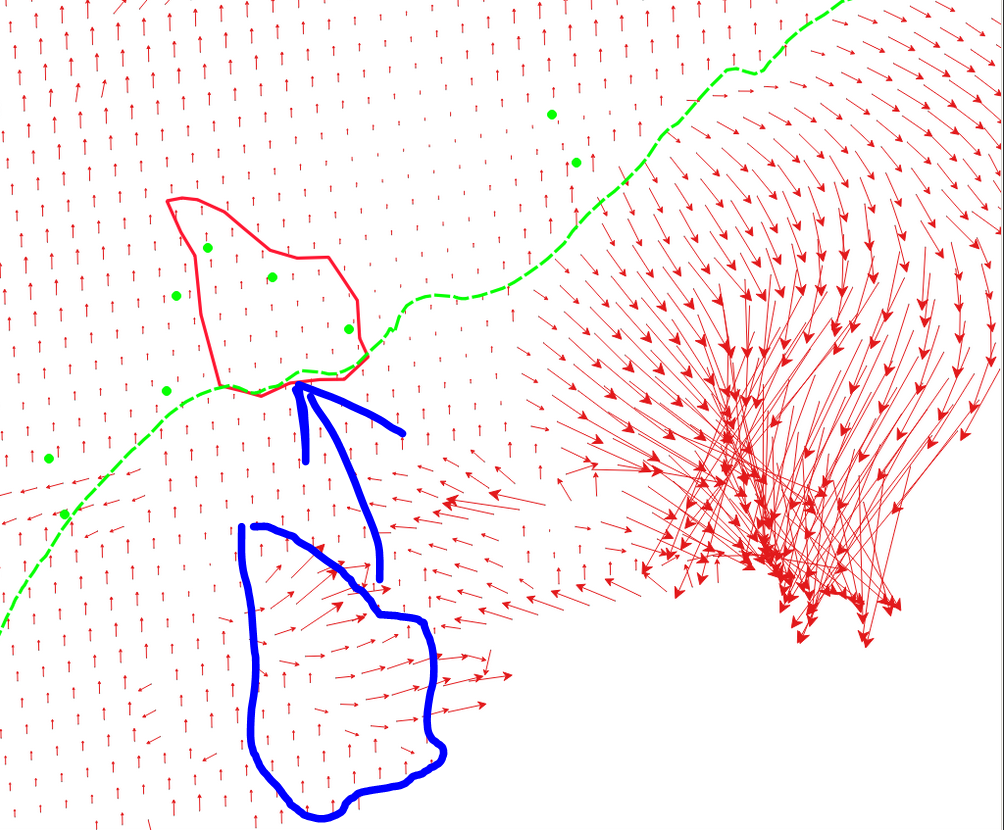
Actually I expected the crossed arrows from the first figure to coincide with the red polygon.
This is why I decided that there should be a shift.
since the event I’d like to track is located in the red polygon.
I hope I could do this in QGIS 3.X.X
I was curios why this had happened after applying the OffsetTracking operator.
what is the scale of this offset? It would be nice too see this on a basemap.
How did you export the displacements after terrain correction?
Is it an option to retrieve the points’ location directly after offset tracking (without terrain projection) just based on the created xml file? (example)

 delay.