Using VV and VH to make DEM

Hi all,

I try to use Sentinel-1 data to generate DEM of Yilan, Taiwan by operating interferometry. Two images that I used are 02/03, 2018 and 02/15, 2018.
What I want to test is to observe the difference of the output DEMs by choosing VV and VH polarization. I think, theoretically, the output DEM will be slightly different because of different land cover. However, the results are totally the same in the end. I wonder if I do anything wrong during interferometry?

The data I use:

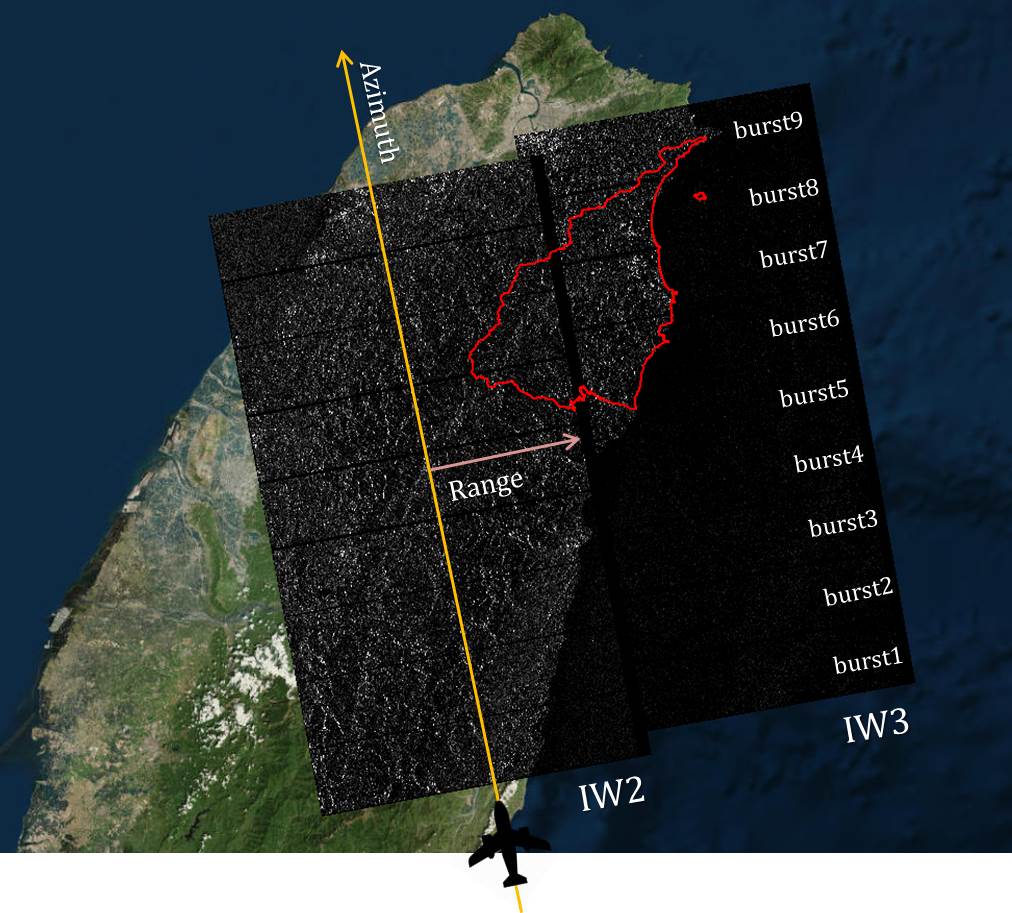
  1. Sentinel-1, 2018.02.03 and 2018.02.15 respectively.
  2. The red polygon is Yilan, which is the area I am interested in.

The process I do:

  1. Coregistration
  2. Interferogram Formation and Coherence Estimation
  3. TOPS Deburst
    (From 1 to 3 I repeat twice for IW2 and IW3)
  4. TOPS Merge
  5. Phase Filtering
  6. Range-Doppler Terrain Correction

** I skipped the process of unwrapping since my purpose is simply making a DEM.
**From 1 to 6 I repeat twice for VV and VH polarization, the rest operations are totally the same.

The output I get:

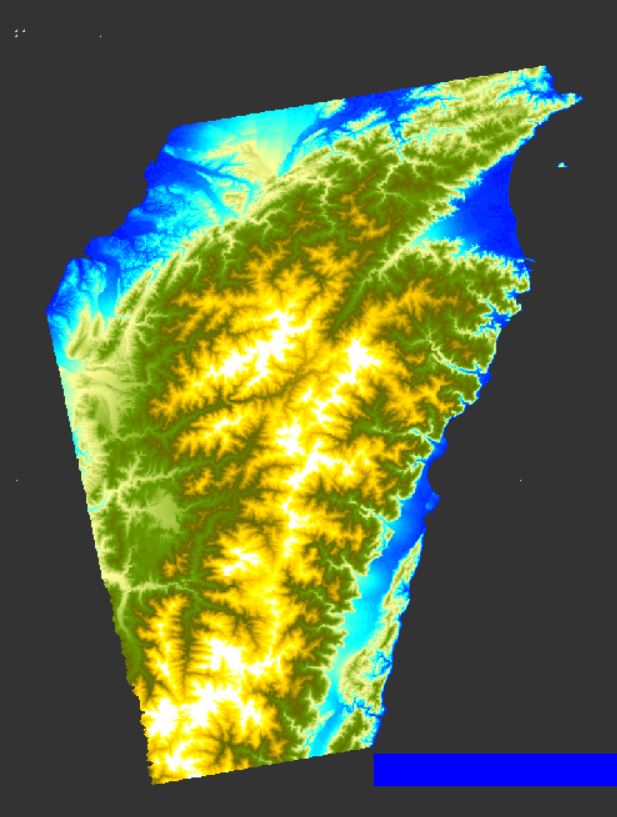
  1. Digital Elevation Model: SRTM 3Sec (Auto Download)
  2. Resolution: 13.97(m) * 13.97(m)
  3. Map Projection: WGS84(DD)

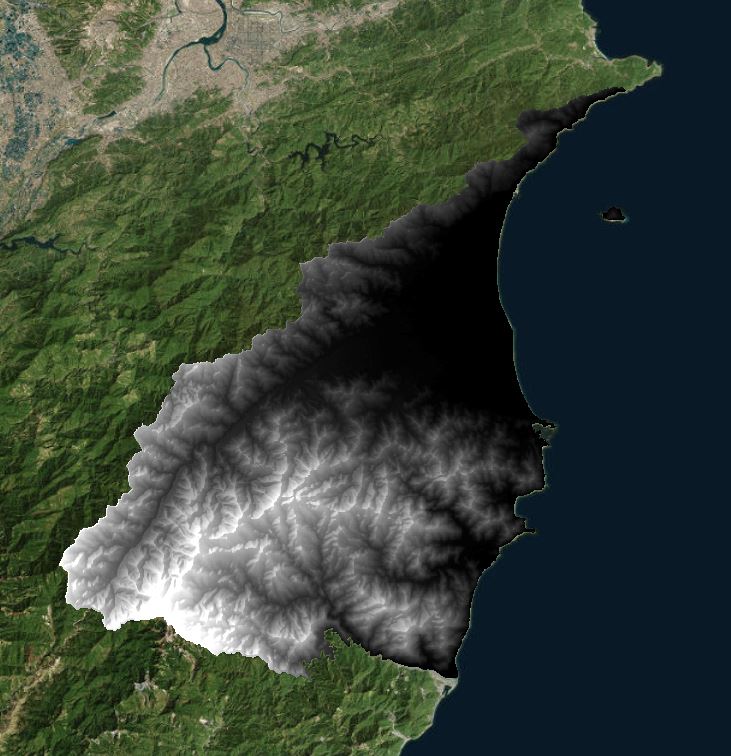
I dragged the file into ArcGIS and clipped out Yilan area.
The elevation value of the DEMs generating by VV and VH are completely the same. (Since the results are the same, I only attach the result of VH polarization.)

Why DEMs generated by VV and VH are the same? Does anyone know where might be the problem? Thanks a lot for reading and answering :slight_smile:

I guess there was a misunderstanding: During the Range Doppler Terrain Correction, a DEM is required to estimate the geometric distortion of the radar signal according to the local topography. You are using the SRTM 3Sec which has a spatial resolution of 90 meters. As stated, this is automatically downloaded by SNAP, it exists since the year 2000.

However, this SRTM has nothing to do with your InSAR result. If you want to create a DEM from radar interferometry, you have to unwrap your interferogram and convert it to elevation. Have a look here: The Order of DEM Creating Steps
Unwrapping is the most important step, so you cannot skip it for DEM generation.

Besides that, I don’t expect a significant difference between phase of VV and VH.
The reason why both of your results are equal is that both simply show the SRTM digital elevation model at resampled spatial resolution of 14 meters (without any increase in quality).

The checkbox to include the DEM in the Range Doppler Terrain Correction module simply outputs the DEM used to estimate this geometric distortion, but not the elevation information from the interferometric phase.

Besides that, I have concerns that InSAR will work over your study area because you have lots of vegetation which causes massive temporal decorrelation within the 12 days between both acquisitions.
Have a look at your interferogram and the coherence layer. They indicate the quality that can be expected from the image pair.

Besides that, I don’t expect a significant difference between VV and VH, because the phase is not related to the backscatter intensity and should mainly respond the same. You can also check by comparing the interferograms. They should largely look the same.

@ABraun thanks very much for your reply :slight_smile:
I got it! I will try to unwrap my inteferogram and convert it to elevation.

Here I have another question: base on what I have learned so far, different landscapes do influence the result of interferometry. It is not only because of the fact that vegetation causes massive temporal decorrelation, so the result becomes worse, but also because different polarization can detect different target better. Here is one of the reference I have read: (see page 21)
http://www.hep.manchester.ac.uk/u/xiaguo/waveoptics/Polarisation_supplement.pdf
Accordingly, I assume that even if there are lots of vegetation in my interest area, I can still tell the slight difference from the final result. So I wonder why you said “the phase is not related to the backscatter intensity”? is it my another misunderstand? :joy:

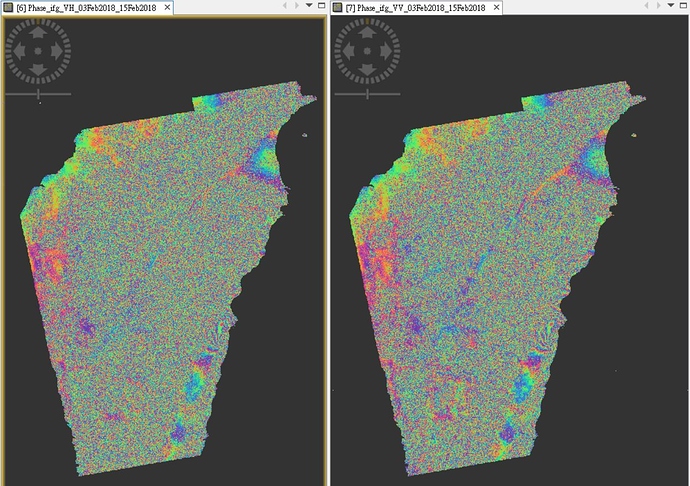
The following picture is the interferogram of VH and VV. There is no apparent difference as you said :slight_smile:

Thanks for reading and replying :blush:

You are right - the polarization does matter in case of backscatter intensity, because cross polarization (VH or HV) is often higher in areas with voluminous objects (branches, canopies, ect.). But the interferogram is based on the phase difference between two images. The phase is the state of the wave when hitting a target. So both VV and VH will hit the target (probably slightly different as you said), but the state of the wave is almost the same.

But I am always open to references which test this difference.

As you see in your interferogram, the only usable areas are along the coast where vegetation cover is low. The areas where you see these fringes (color patterns) are usable for interferometry, but unfortunately, most of your study area lacks of signal correlation. Consequently, there is nothing to unwrap and height information will not be precise.

This source reports the lowest coherence for cross-polarized channels: Revising vegetation scattering theories, so they have the lowest potential for InSAR measurements of topography.

I did a quick test which indicates the same: Better interferograms can be expected with HH or VV. Effect of polarization on interferometric products

@ABraun thanks so much for every pieces of information you have given to me. I will look into it!!! If I have a result, I will update it here :slight_smile:

Hi @ABraun, sorry for late update :stuck_out_tongue: I am here again to share my new results. :grin:

First of all… since I noticed in order to generate a DEM, I made the following mistakes:

  • I used wrong steps with incorrect parameters.

  • My original target area is not suitable for making a DEM since there are too many mountainous area involved. Besides, this area is one of the most rainy area in Taiwan, which means the humidity here is quite high. I think these factors all play important roles in low coherence value in the end.

  • The perpendicular baseline I used in the original images are only 0.01 m which is so ridiculously low… orz

So, I made a new try here. :kissing_closed_eyes:

The following are my steps according to how I choose my new target area, SAR images and steps I used to generate DEMs:

Firstly, I choose mid-Taiwan as my target area since here is relatively dry in comparison to other areas in Taiwan.

Secondly, I choose SAR images of winter time because the weather is drier and less rainy. In addition, plants don’t grow during winter so I assume more bare area can lead to higher coherence value.

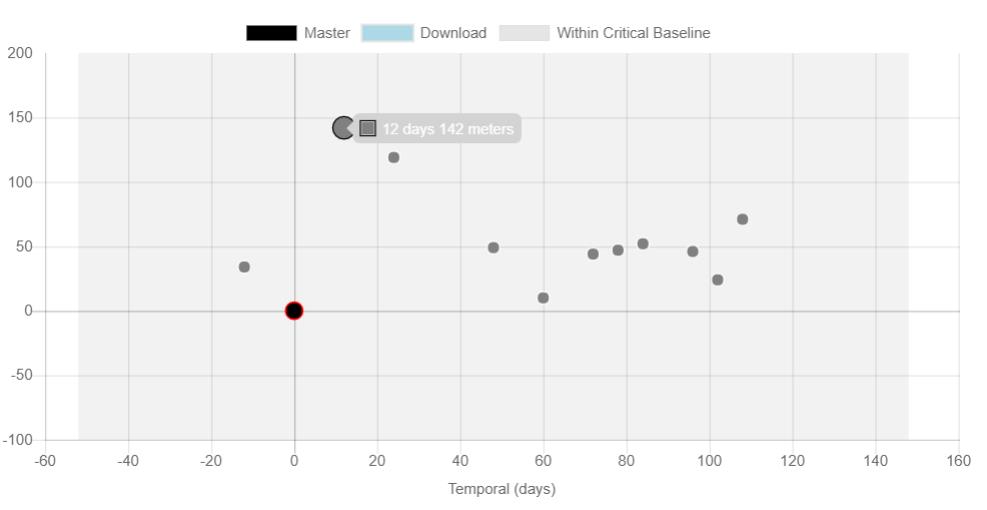
Thirdly, based on the information I have learned from the forum, I checked if there are any SAR img pair available with 150~300 m of perpendicular baseline by the website UAF, https://baseline.asf.alaska.edu/#/baseline. However, the maximum baseline I could find is 141 m with 12 days of temporal gap which I think is acceptable.

Fourthly, I downloaded this two Sentinel-1A SLC products.


By the way, I also checked that this two days were not raining on 2017.11.23 and 2017.12.05, but the relative humidity is range from 62~69%. (it is still a bit too high I think…)

Fifthly, I generate DEM by the following steps: (bold fonts means the process that I did incorrectly before.)

  • S-1 TOPS Coregistration

  • Interferogram Formation (without topographic phase removal)

  • S-1 TOPS Deburst

  • Goldstein Phase Filtering

  • Snaphu Export (choosing TOPO as my statistical-cost mode and MCF as my initial method)

  • Run unwrapping using Cygwin

  • Snaphu Import

  • Phase to Elevation

  • Range-Doppler Terrain Correction

OK…Finally!
Now here comes my test design and my comparisons: :grin:

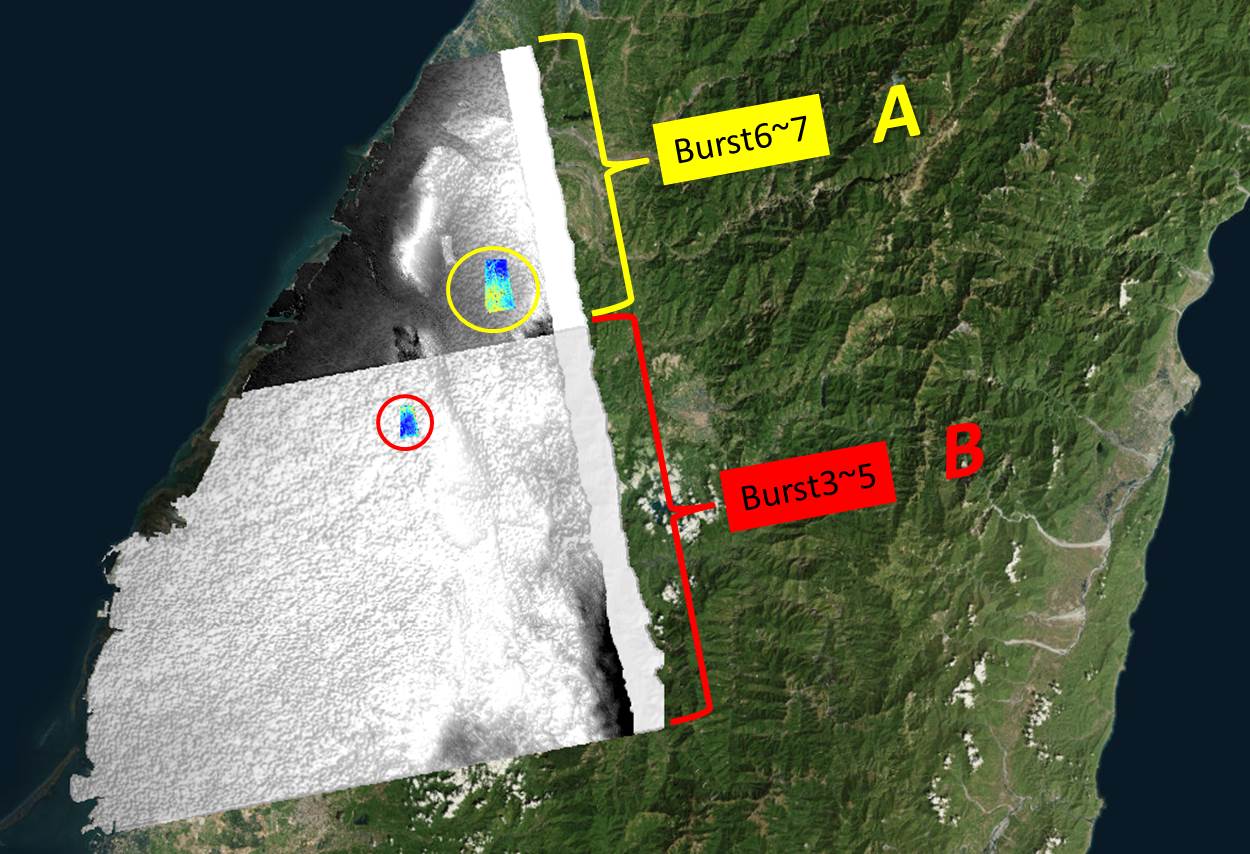
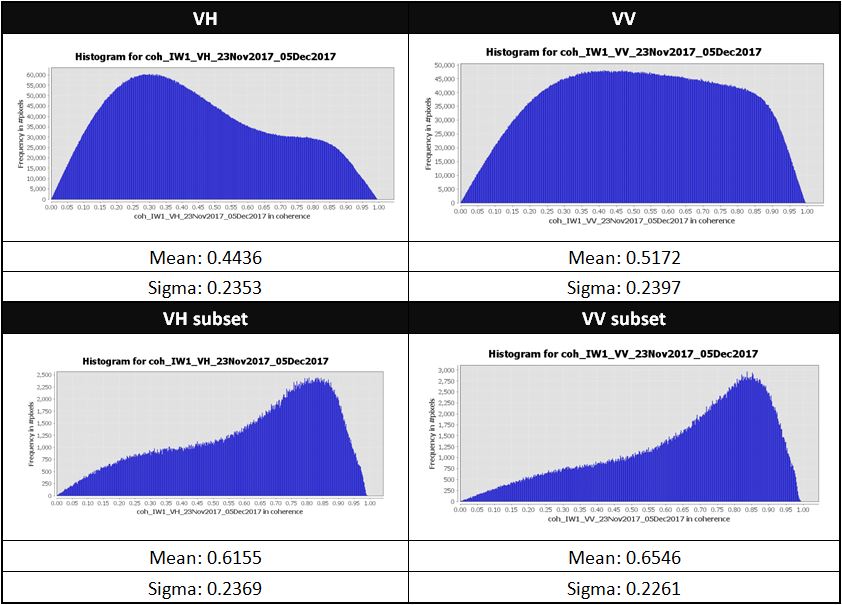
I have two test areas here which are called A (using swath 1 and burst 6~7) and B (using swath 1 and burst 3~5). A has a higher coherence value in general since here involves more urban area.
In each area, I generated DEM with both VV and VH polarization in order to see different result with different polarization.
Then, I select a subset area base on stronger intensity shown in the output file after coregistration, and operate the same process again to see if a stronger coherence value will lead to better result. The subset areas are indicated as yellow and red circles in the figure.

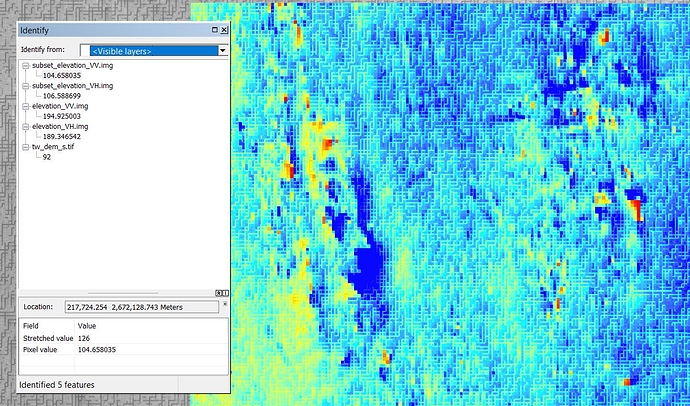
I import the DEMs into GIS and compare to my 5 meter DEM (as true value), and I notice that the coherence value REALLY has a strong influence on the accuracy of output DEM!

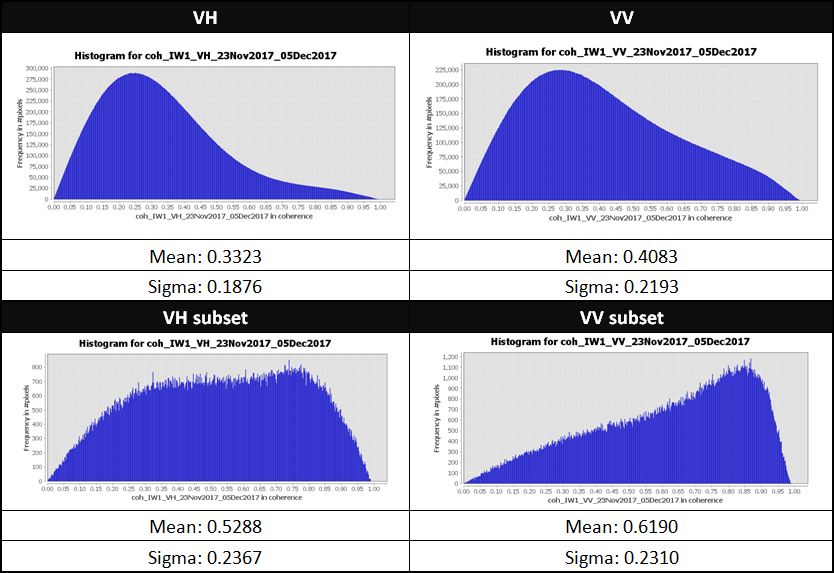
Let’s see the coherence value of B area first. After comparison, I notice that:

  • The coherence value of VV is about 0.1 better than VH, however, it does not necessary reflect to the accuracy of dem. For example, before subset, VH performs 6 meters better then VV but after subset, VV performs 2 meters better than VH.

  • Subset areas perform considerably better. Before subset, the error is at least 100 m, but it improves up to under 15 meter after subset!


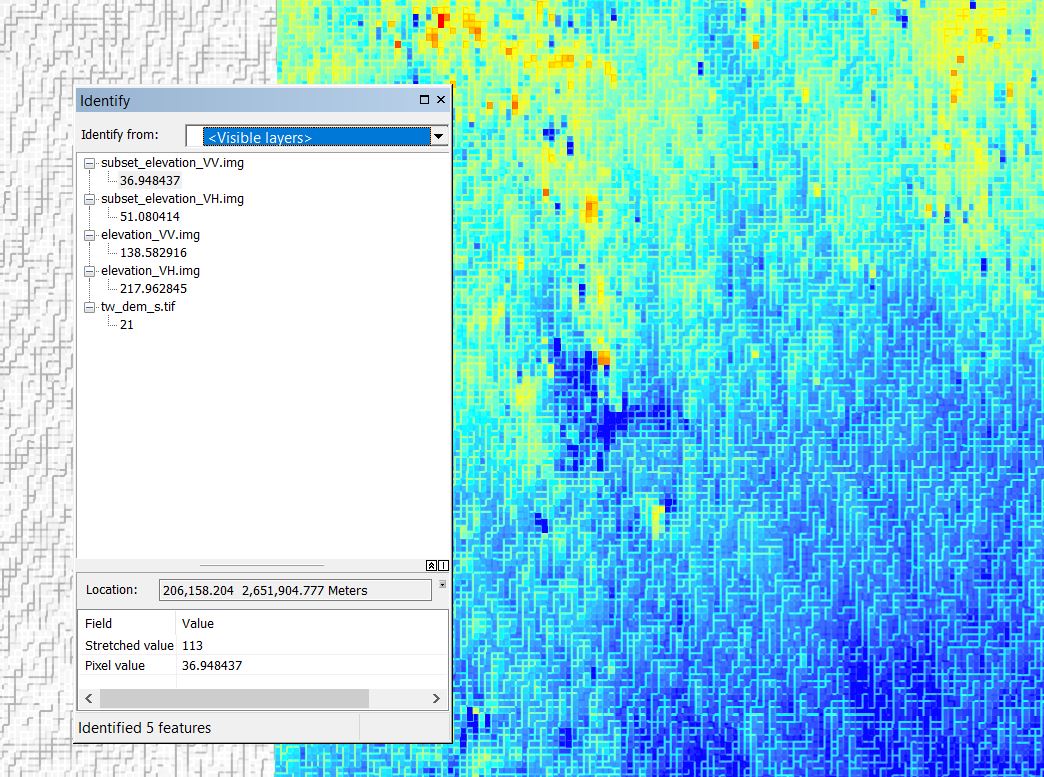
P.S tw_dem_s is my 5 m dem, which is seem as true value here.

Now let’s see the coherence value of A area. The discover is the same as what we have learned from area B, but still we can make the following remark:

  • The coherence value of area A improves 0.1 than area B which leads to a higher accuracy in output DEMs. This can be proved by the error between two area pairs. Without subset, errors in A can be limited to 100 m. With subset, errors in A can be limited to 10 m.


P.S tw_dem_s is my 5 m dem, which is seem as true value here.

The above is my test. I know simply click several points in GIS is not the best way to see the general trend and conduct my comparisons and so on, however, since I only want to make it an easy try, I don’t want to make a sophisticated statistic computation in GIS (using raster calculation or so).

Ok, here I have several questions:

  • Even if I have already tried whatever I have thought about to increase my coherence value, the best result here only shows roughly 10 meters accuracy. I wonder if I can make any more improvements to improve the quality of my DEM?

  • My DEM, as shown in the above images, are somehow “gridish” which means the value is not continuous. I wonder if it is normal or did I make anything wrong?

Thanks for reading and I am really grateful to any of your reply! If you find any incorrect part or you have any suggestion, please feel free to offer me your valuable comments :relaxed:

3 Likes

First of all, I think you did a great job in selecting suitable images and processing the data. Also well documented!

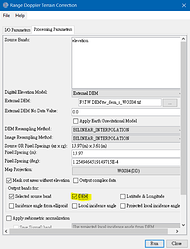
Did you use your high-resolution DEM for the Range Doppler Terrain correction? if so, you could as well check the “Digital Elevation Model” as a further output, which will give you both rasters at the same resolution in the final product.
elevation_VV will be your inSAR DEM
elevation is the one you used for Terrain Correction (your tw_dem_s or SRTM 1ArcSec)

The advantage is that you can then use the scatter plot tool to plot your InSAR elevations against the reference elevations and see where your data is exact and where the error exists.
You can then also calculate a difference raster in the band maths to see where the difference between both elevations is small and where it is large. If you furthermore terrain correct your coherence, you can use it in the band maths as well because it has the same extents. You could then add it to your product of elevation_VV and elevation and make a scatter plot with coherence vs. elevation_VV to see if there are patterns as well.

About the “gridish” DEM: This results from the visualization in ArcMap: If you select “bilinear” in the raster properties (under displa) the colors will be smoothed a bit and not appearing as stairs. Maybe also helps to recognize better patterns.
I’m not sure at which steps these stairs are introduced during the InSAR processing but the easiest way would probably be a median filter 3x3 if you want to remove them permanently from the data.

Very interesting study. Also the difference between VV and VH coherence.

3 Likes

Hi @ABraun,

thanks for your reply and suggestion. I have been trying the methods you offered and I have the following results so far:

  1. Using high resolution DEM for Range Doppler Terrain correction:
    I didn’t use my 5 m DEM for terrain correction but SRTM 3 sec. Besides, I didn’t check “DEM” as a further output neither. Accordingly, I use the pair of A subset to redo terrain correction process.

  2. Compare the output of SRTM 3 sec and 5 m DEM:
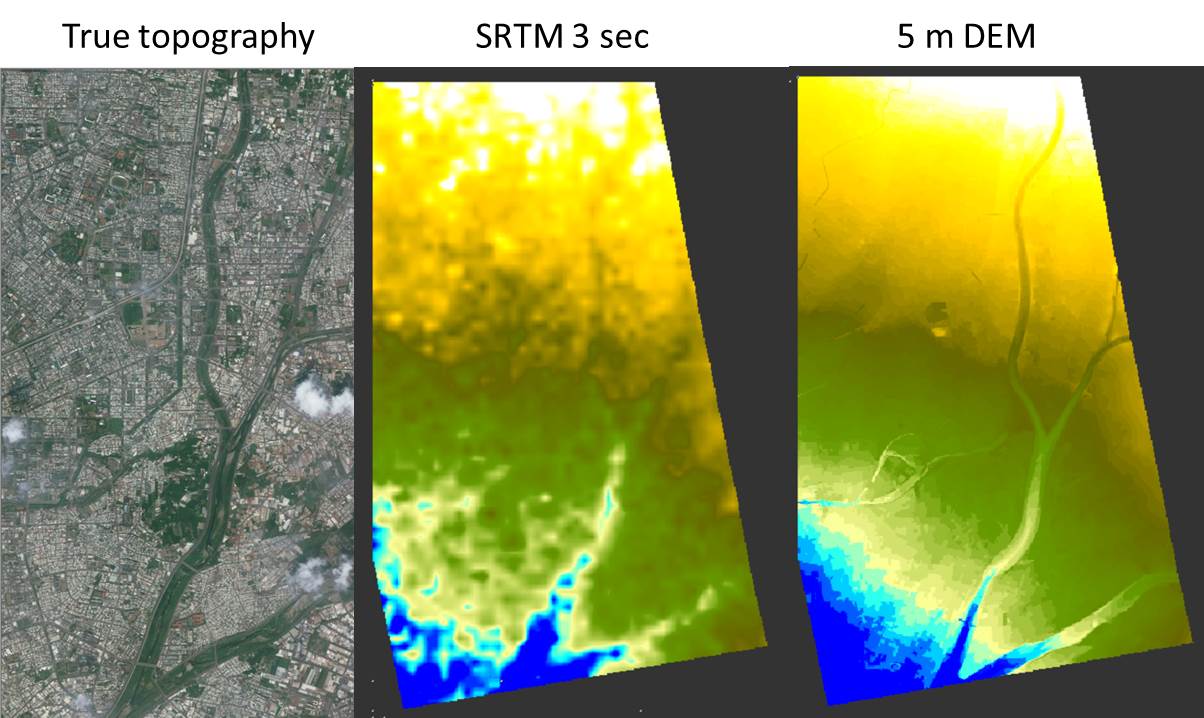
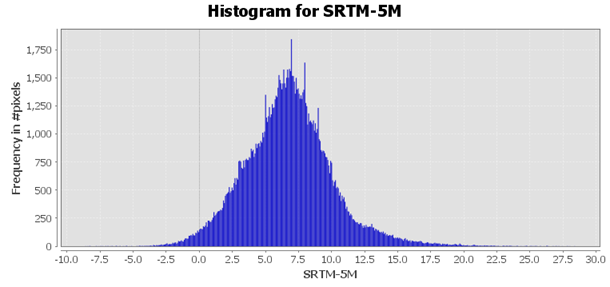
    Here the DEMs were produced by checking “DEM”. I want to compare this two. From the figure below, seems my 5 m DEM has higher resolution and make more sense since it depicts river area better.


    .
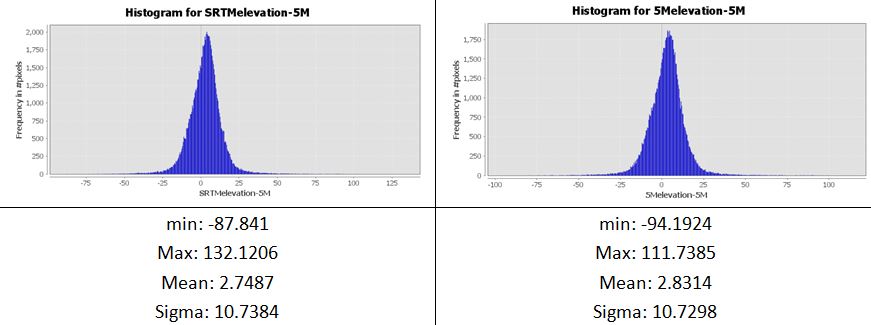
    However, 5 m DEM’s histogram below is quite weird in comparison to SRTM. It has been confusing me because it might indicate the wrong value of my DEM but the InSAR DEM produced by 5 m DEM shows a better result.

    .
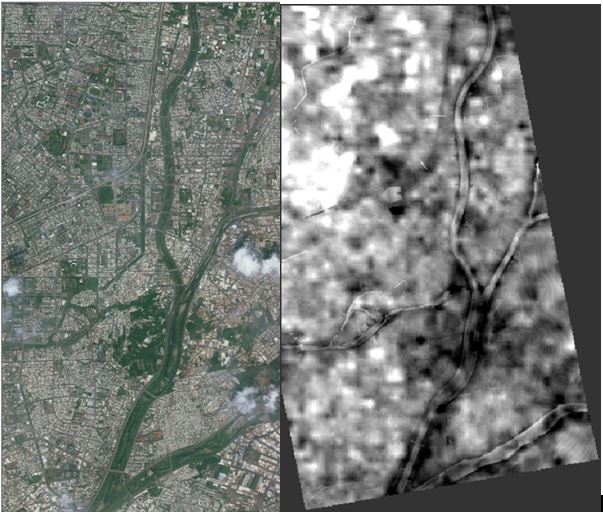
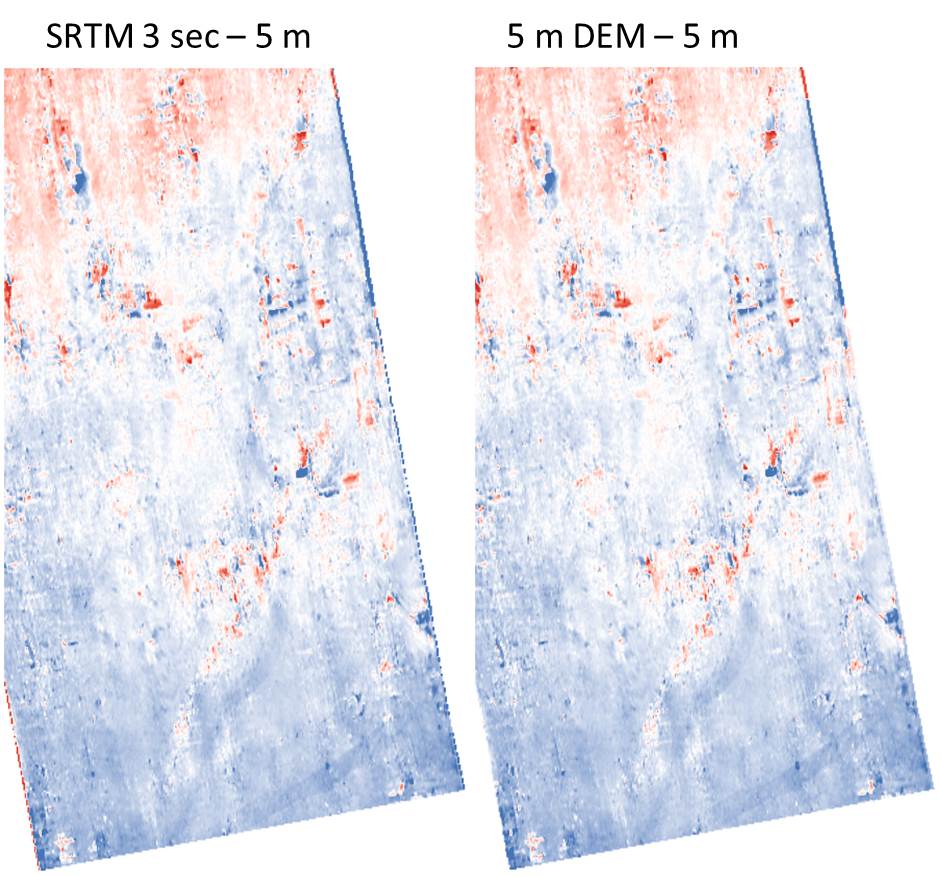
    To make a further comparison, I reduced SRTM by 5 m DEM. It is obvious that the main difference lies in river area, and SRTM is averagely 7 meter higher than 5 m DEM.

    .
    image
    .
    Then I made scatter plots of InSAR elevation (y-axis) that were produced by corresponding reference DEM with their reference elevation (x-axis). Probably for similar reasons that I don’t know, the scatter plot of 5 m DEM has a special “discrete” pattern.

  3. Calculate a difference raster in the band math:
    I used two InSAR DEM to subtract 5 m DEM (as true value) and the output is residual. Actually, the results didn’t show many apparent difference, but I thought the output of 5 m DEM would have been clearly better.
    However, we can see that the error of most of the area can be limited within around 15 meters. One of the interesting things is that the peak is not at the value of zero… lol
    .


    .
    I dragged the files in GIS and revised the display value from 50 (blue) to -50 (red), and 0 (white) indicates the area without residual. We can see a pattern from upper left to lower right. I am concerned that it means that the result is incorrect… but I am not so sure as well.
    Do you know whatever factors that caused this pattern? and I wonder does it matter since the accuracy is still in a certain level.

  4. Others:
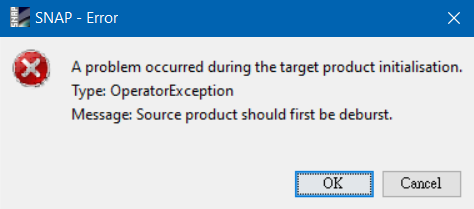
    I tried to terrain correct my coherence band to see if there is a pattern, too. Yet I don’t know why this error message bumps out. The funny thing is that this area doesn’t need to be deburst. Even so, I tried to deburst but SNAP doesn’t allow me to process deburst in this area either.
    1
    .
    Regarding to “gridish” DEM, I followed your steps to select “bilinear” and it improves a lot. I also tried a 3*3 median filter but it reduce my accuracy at the same time, so I temporarily don’t apply filter as long as these grids do not harm me :stuck_out_tongue_winking_eye:

Thanks for reading again… please let me know if you have any comments! I would like to find out more interesting things in this study :blush:

1 Like

In that case your results are very well! Of course, many of the fine structures in the version based on the high-resolution DEM are caused by its spatial resolution. But you can try how much better the SRTM 1 sec is compared to 3 sec (it has a spatial resolution of 30 meters instead of 90 meters). You should then get sufficient results without needing the 5m DEM.

About the debursting: Even if you work with one burst, debursting is required. At best you appy it directly after the interferogram generation and then terrain correct the result. Then you can include it in the output product to mask out low coherence areas.

1 Like

@ABraun ok I got it… I will try it :relaxed:
Thank you so much for your reply! :smile:

Hello all,

sorry that I am so curious that I want to ask a question here…
I just discovered this.

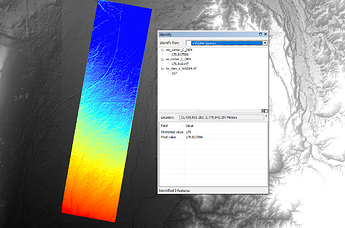
I checked “DEM” in the Range Doppler Terrain Correction step so that I could also have my referenced DEM as my output. Here I use a 5 meter LiDAR DEM as my referenced DEM.

And when I put all of my referenced DEM into Arcgis, I noticed that the elevation are different from my original LiDAR DEM, which confuses me…

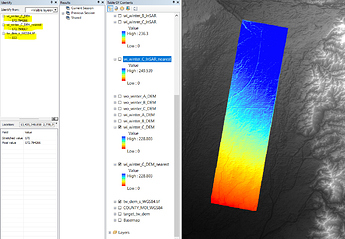
  • wo_winter_C_DEM: my referenced DEM using for DEM generation procedure without doing milti-looking.
  • wi_winter_C_DEM: my referenced DEM using for DEM generation procedure with doing milti-looking.
  • tw_dem_s_WGS84: my original 5 meter Lidar DEM

The difference between output referenced DEM and original LiDAR DEM is generally around 10~20 meters… Does anyone know why this happens?

Many thanks for anyone who reads this post :slight_smile:

@ABraun sorry for the disturbance…
Just for asking… do you know the reason for this? :relaxed:

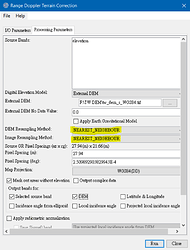
could it be related to the resampling of the pixels to the resolution of the Sentinel-1 output?

Run again and select Nearest Neighbor as DEM resampling type and compare again.

@ABraun I have tried but the result is quite the same as the result of using Bilinear as resampling method.

hmm, strange. I remember that something similar was reported in here, but I can’t find the topic at the moment.

1 Like

Hi Mr ABraun, I have a question from you. How can I export PS_InSAR result into arcgis? Is there any code in matlab that I can use it?

there is a kml export documented in the manual, but it only exports one variable per point (e.g. ‘v-do’) and not the entire displacement time-series.

Thanks a million. So I think exporting one variable for combining ascending and descending results in arc-gis environment based on your proposed paper methodology, is sufficient!?