Hi I’m not entirely sure what to make of the data presented below. The interferogram and displacement image were taken from 2 sentinel-1 images from april 20 to may 2, 2019, with an earthquake of magniture 6.1 in between the dates at the epicenter as shown.
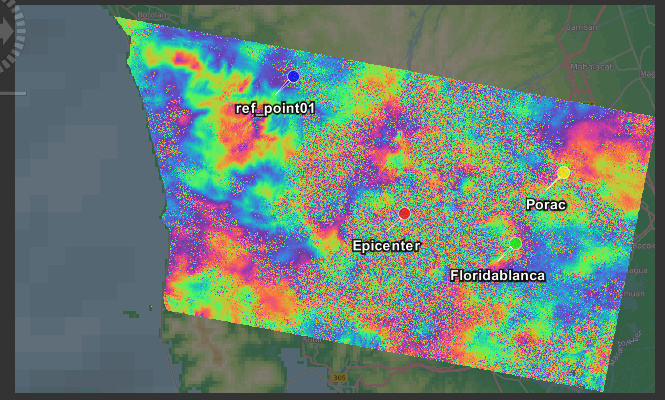
Figure 1. wrapped phase interferogram
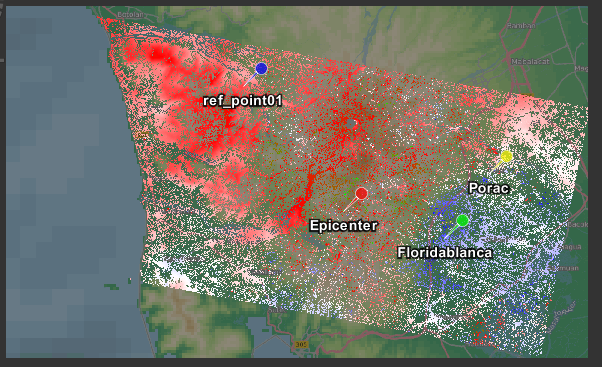
Figure 2a. displacement field
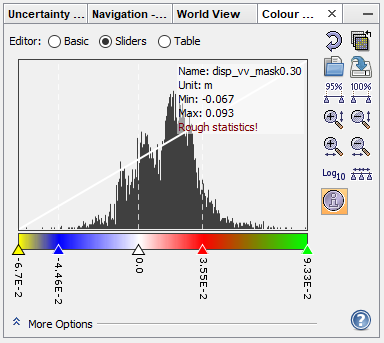
Figure 2b. color map of 2a
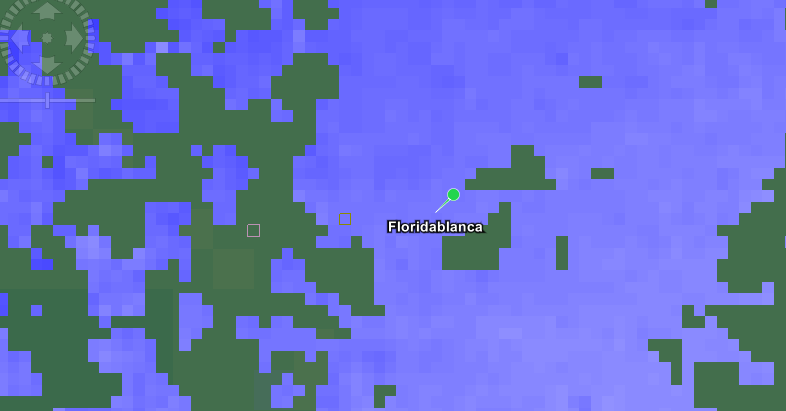
Figure 2c. Focus to Floridablanca
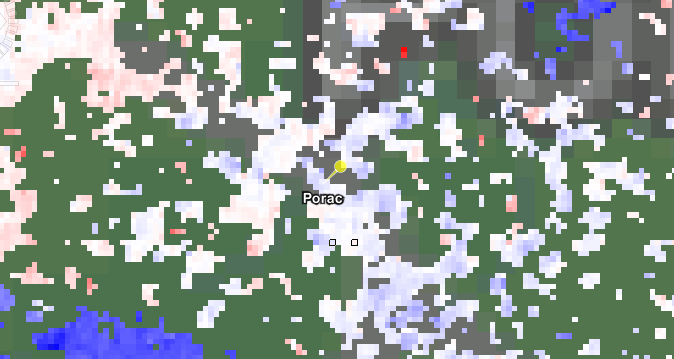
Figure 2d. Focus to Porac
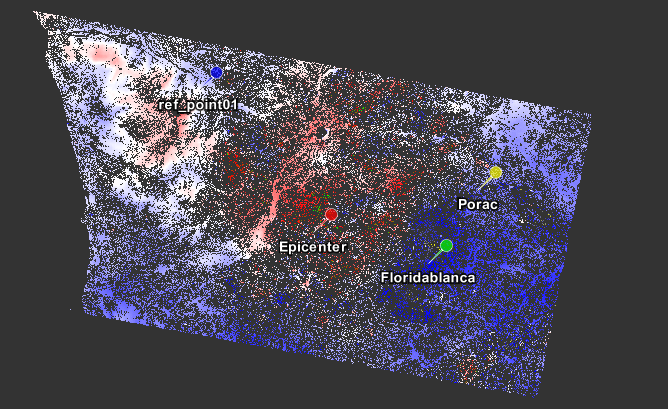
Figure 3a. Displacement field relative to a point of high coherence (ref point 1)
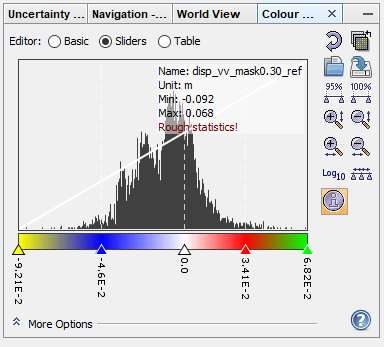
Figure 3b. Color map of figure 3a
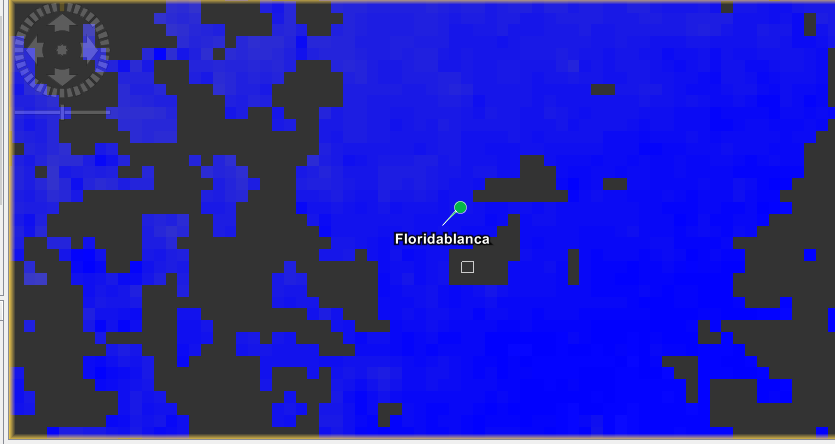
Figure 3c. Zoom Floridablanca
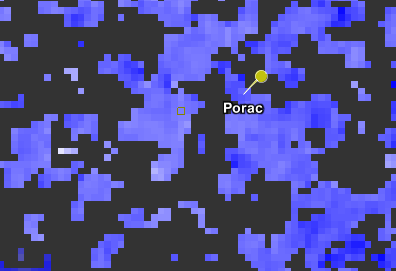
Figure 3d. Zoom Porac
Here are my questions:
Q1: I can’t seem to see any fringes in figure 1 since there’s so much low coherence in and around the epicenter. My understanding is that if there is a relatively strong earthquake, fringes would be developed in and around fault lines.
Q2: Does 2-4cm of displacement of land matter? enough to destroy buildings? because around the pin markers have buildings destroyed.
Q3: What’s the significance of choosing a reference point of high coherence? What I did in Figure 3 is I chose a point of high coherence and elevation with not much vegetation. Then I made the displacement of that pixel zero by countering its relative displacement (in this case, subtract since the pixel has a positive value)
Q4: Unrelated note, but how do I flip the scale in google earth? it seems the displacement has the subsudence (negative value) on the top portion and uplift on the bottom of the scale.
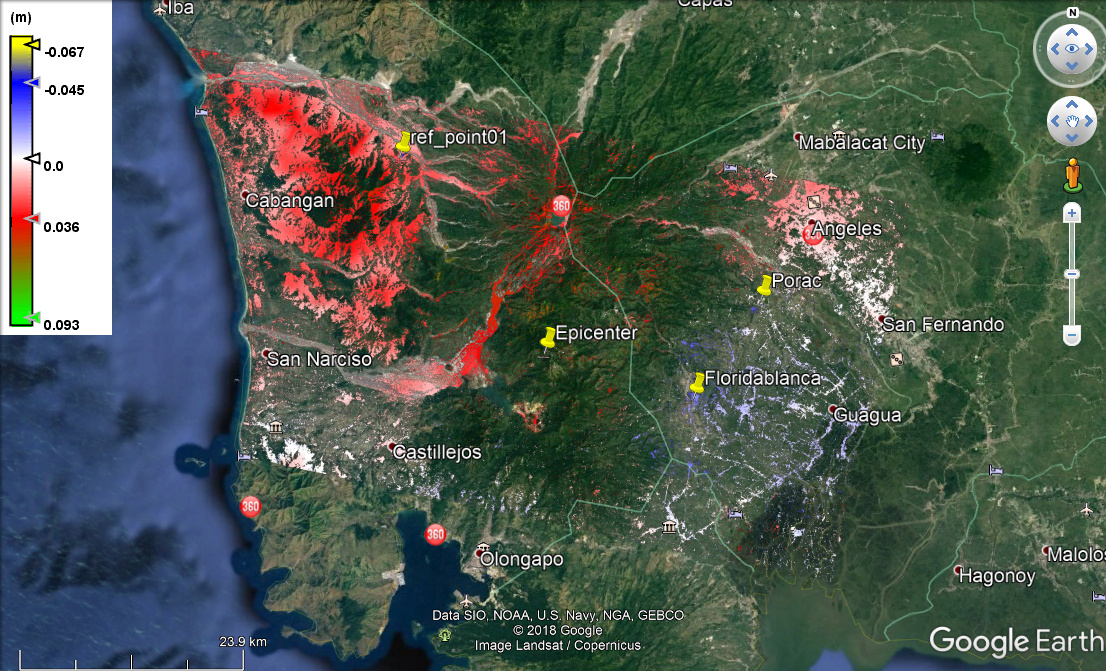
Google Earth View with scale
I have more questions though on the concepts of SAR, especially the math behind how coregistration, differential interferometry, how phase unwrapping works, and their parameters, such as in snaphu unwrapping (what MCF and MST mean, and what the other variables do) but these questions will suffice for now.